

 Stratigraphic ranking of selected invertebrate fossils: A quantitative approach at different temporal and geographic scales
Article number: 22.2.51
https://doi.org/10.26879/912
Copyright Paleontological Society, August 2019
Author biographies
Plain-language and multi-lingual abstracts
PDF version
Submission: 6 August 2018. Acceptance: 31 July 2019.
{flike id=2693}
ABSTRACT
Fossil groups are used for biochronological dating of rocks for decades. This manuscript presents a quantitative approach to appraise and compare the quality of selected taxa as biostratigraphic markers. Based on species occurrence of ammonites, bivalves, and planktic and benthic foraminifers we evaluate the potential of these to rank them quantitatively. The spatiotemporal analyses of occurrence data (species duration, geographic range) were integrated in results of the Unitary Association method, which measures superpositional contradictions in addition to the generation of a number of UAs. The results indicate that Jurassic ammonites have the lowest species duration, and that the majority of species is confined to a single UA-zone. Additionally, ammonites have the lowest numbers of contradicted bio-events. However, planktic foraminifers are more valuable at least in the Cenozoic as they have a high geographic reproducibility and diversity, and higher ISP values. The bivalves and benthic foraminifers both show longer average species durations and more superpositional contradictions per species. Therefore, their biostratigraphic potential is more limited at an interregional scale. The shorter species durations of ammonites and planktic foraminifers in the studied sections can be attributed to their higher extinction rates. As an advantage to simple spatio-temporal analyses, the UA-method can accurately assess the stratigraphic potential of a given taxonomic group. The results obtained herein indicate that the life-habit has direct impact on the species duration and thus, the stratigraphic potential of the fossil groups. Based on the results achieved from this study, an index for ranking fossil groups (Index of Stratigraphic Potential ‘ISP’) is introduced.
Ahmed A. Abdelhady, Geology Department, Faculty of Science, Minia University, 61519 El-Minia, Egypt. Alhady2003@mu.edu.eg
Barbara Seuss, Friedrich-Alexander University, GeoZentrum Nordbayern - Paleobiology Section, Loewenichstraße 28, 91054 Erlangen, Germany. barbara.seuss@fau.de
Hatem F. Hassan, Geology Department, Faculty of Science, Port Said University, 42522 Port Said, Egypt. hatem99_eg@yahoo.com
Key words: invertebrate fossils; quantitative biostratigraphy; biochronology; unitary associations; life-habit; index of stratigraphic potential (ISP)
Final citation: Abdelhady, Ahmed A., Seuss, Barbara, and Hassan, Hatem F. 2019. Stratigraphic ranking of selected invertebrate fossils: A quantitative approach at different temporal and geographic scales. Palaeontologia Electronica 22.2.51A 1-17. https://doi.org/10.26879/912
palaeo-electronica.org/content/2019/2693-ranking-of-invertebrates
Copyright: August 2019 Paleontological Society.
This is an open access article distributed under the terms of Attribution-NonCommercial-ShareAlike 4.0 International (CC BY-NC-SA 4.0), which permits users to copy and redistribute the material in any medium or format, provided it is not used for commercial purposes and the original author and source are credited, with indications if any changes are made.
creativecommons.org/licenses/by-nc-sa/4.0/
INTRODUCTION
For decades, biostratigraphers have constructed their biochronological schemes based on age-diagnostic taxa such as ammonites, planktonic foraminifers, calcareous nannofossils, dinoflagellates, and conodonts (Keller, 1983; Aubry et al., 1988; Brinkhuis, 1994; Pálfy et al., 2000; Guex et al., 2004; Kaufmann, 2006). Definition of these markers was based on qualitative rather than quantitative observations (Bolli et al., 1989). Moreover, there is also noteworthy criticism on biozonations that are based on benthic groups (e.g., bivalves, brachiopods, and echinoids; for review see Gradstein, 2012; Abdelhady and Fürsich, 2015a).
Although Stanley (1979) has estimated the species duration for many fossil groups, he has also highlighted the inconsistency of species range estimation due to the high variation in species duration among different genera and among different time intervals. For example, planktic foraminifers: These are known to have high species duration at a low adaptive radiation (their average species duration is 15 m.y.; see Stanley, 1979, figure 9-1). However, they also have a well-known stratigraphic potential, which accordingly means that species duration alone is not sufficient for the evaluation of the stratigraphic validity of a fossil group. Stanley himself has demonstrated that ranking according to average species longevity forms “a crude approximation” (Stanley, 1979, p. 235).
Further bioecological factors may influence a species’ range. For example, Buzas and Culver (1984) showed that the duration for foraminifer species is 16 to 26 m.y. but that the range is shorter for shallow than for deep-water species. In addition, Crampton et al. (2010) pointed out the correlation between large geographic range and species duration for both, bivalves and gastropods. They highlighted important factors such as life habit and larval development that affect species duration.
To achieve accuracy and precision of biostratigraphical zones, two premises have to be fulfilled: 1) Availability of large datasets covering a considerable geographic area; and 2) quantitative approaches to analyze a large dataset efficiently (Pálfy and Vörös, 1998). The content of fossil-databases is continuously increasing. This progress provides new opportunities for incorporating large datasets and addresses many ecological and stratigraphical issues on a global scale. Recently, besides the well-known databases such as the Paleobiology Database (PBDB) and the Geobiodiversity Database (GBDB; Fan et al., 2013), new databases are available like FaunMap (http://www.ucmp.berkeley.edu/faunmap/) and MioMap (http://www.ucmp.berkeley.edu/miomap/). These databases include vast information on taxonomy, occurrences, and ecology of both fossil and living organisms, which can be used to measure the geographic and/or stratigraphic range size of a given fossil group.
Yet, analyzing large geographic or stratigraphic datasets manually is not possible; fortunately, numerous quantitative stratigraphic approaches have been developed in the past decades such as ‘Unitary Association’ (UA; Guex, 1979), ‘Ranking & Scaling’ (Agterberg and Gradstein, 1999), ‘Constrained Optimization’ (Kemple et al., 1989), and ‘Horizon Annealing’ (Sheets et al., 2012). For a detailed comparison among these biostratigraphic methods we here refer to Gradstein (2012).
One of the major obstacles for a biostratigrapher is the punctual pattern of sedimentation and erosion that results in an incomplete stratigraphic and fossil record. Therefore, it is extremely difficult to ensure that sampling intervals cover species boundaries and at the same, time index fossils are required for a precise age determination. An index fossil is important for temporal correlations and should be 1) stratigraphically restricted; 2) geographically widespread; 3) environmentally independent; and 4) abundant (e.g., Gradstein, 2012; Abdelhady and Fürsich, 2015a; Abdelhady et al., 2018). The identification of species boundaries (i.e., first / last appearance date: FAD / LAD) for benthic invertebrates such as bivalves and benthic foraminifers is facing the problem of being highly facies-dependent. Although pelagic taxa might also correlate with factors related to facies, and therefore, they may also depend on facies but indirectly, qualitative observations indicate that they are less affected (see Gradstein, 2012).
Recently, the UA-method has shown promise to partially annul their limitations in biochronology (Abdelhady and Fürsich, 2015a; Abdelhady et al., 2018). In addition, the UA-method contains supplementary tools for a critical evaluation of the analyzed dataset (Monnet et al., 2011; Guex, 2011). Therefore, we aim to evaluate the stratigraphic potential of the different fossil groups and test the following research hypotheses: 1) Is it possible to evaluate and rank the stratigraphic validity of marine invertebrates quantitatively?; 2) are biologic factors such as life habit and mode of larval development influencing the species duration, and thus the stratigraphic potential of a given taxon?; 3) is there a major difference in both, geographic and stratigraphic range between subsets of species within the major fossil groups?
MATERIAL AND METHODS
Datasets
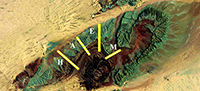
 Acquiring considerable data for quantitative biostratigraphic analyses is problematic. In such analyses, the occurrence of diverse faunal groups in many geologic sections at different spatial scales and for a considerable time interval is the ideal case. Two applicable datasets were used herein. The first includes planktic and benthic foraminifers that occur with high density and diversity in the Paleogene succession of Sinai (Egypt) (Figure 1; Hassan and Elderbak, 2016; Hassan and Nassif 2018; Hassan and Abouelresh 2019). The occurrence data matrix comprises a total of 190 samples at intervals ranging between 20 and 75 cm from three sections (Gebel Falig, Gebel Qabeliat, and Gebel Samra; Appendix 1, Appendix 2).
The second dataset contains occurrence data of ammonites and bivalves in the Jurassic succession from four further sections (see Abdelhady and Fürsich, 2015a; Appendix 3, Appendix 4, Appendix 5). The datasets are suitable as they represent a considerable time interval (~13 m.y.) and represent different sections at distinct geographic distances. In addition, they have well-established biochronological schemes from which their species duration can be accurately estimated.
To increase the amount of available data for analyses, occurrence data of various invertebrates (including planktic and benthic foraminifers, ammonites, and bivalves) were downloaded from the Paleobiology Database (PBDB, https://paleobiodb.org/#/; 10/2014) and added to the regional datasets. Thus, the analyses also include global data and will be appropriate to measure geographic range-size of the four fossil groups at a global scale. Taxa with taxonomic uncertainty (i.e., preceded by aff., cf., or marked with ?) and all unidentified species (genera with sp., sp. A, sp. 1, spp., etc.) were removed from the dataset.
Species Duration
In a first step, samples within every section were assigned to a defined global ammonite or planktic standard zone (Appendix 1 and Appendix 2 for foraminifers and Appendix 3 and Appendix 4 for ammonites and bivalves). If there was more than one sample within such a zone and assuming (for the study) that sedimentation rate is rather consistent, the age of this zone was subdivided into an equal number of intervals (for example, three samples from Gebel Samra represent the planktic foraminifer zone P4c (0.6 m.y.) and thus, the range was subdivided between the three samples, with each sample having a duration of now 0.2 m.y.). The species duration was then calculated by subtracting the species FAD from its LAD within each section. Accordingly, the average species duration from all sections was calculated.
Bivalves and benthic foraminifers were subdivided into two main groups according to their life habit (epifauna and infauna, the latter including semi-infauna), and the species durations of both groups were compared.
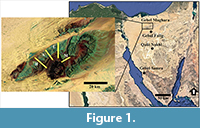
 To test the sufficiency of the data/sampling in the regional dataset, a cumulative plot for the average ranges was drawn for each new species. As soon as the curve stabilizes to the right (i.e., low amplitude without peaks), the dataset/sample size is large enough, and the results can be expected to be reliable. If not, then the amount of data of species/sample size needs to be increased. The cumulative plot indicates that the sample size in this study is sufficient (Figure 2).
Data were tested for their normal distribution. Two-tailed t-tests were used to compare species duration and the geographic range-size between the two main groups (e.g., planktic/nektic vs. benthic) at significance level p < 0.001.
Geographic Range-Size
The second major aspect in biostratigraphy is geographic correlation. The wider the geographic range of a fossil group is, the better it can be used and the more significant the information on correlation will be. To measure the geographic range-size of the examined fossil groups at the regional scale (i.e., the sections of the Sinai) 1) the number of sections in which single species occur is recorded; and 2) the average range-size of all species is compared.
In addition, the ‘index of reproducibility’ (R), which is associated with the Unitary Association method (explained in the following section), was used to compare the geographic reproducibility. In combination with this, the geographic range-sizes of the fossil groups were estimated by using information from the PBDB. The range-size of species (expressed here by the number of latitudinal degrees reached by a species was obtained by subtracting the minimum latitudinal degree from the maximum one. Accordingly, the range-size was averaged for each fossil group in each geologic epoch.
Unitary Association Method
Among the quantitative stratigraphical approaches (QSA), the decision to use the Unitary Association method was based on 1) previous recommendation suggesting it for analyses as performed in this study (e.g., Savary and Guex, 1999; Hammer and Harper, 2006; Monnet et al., 2011, 2015; Abdelhady and Fürsich, 2015a; Guex et al., 2015); 2) on fundamental properties (i.e., deterministic instead of probabilistic), which are optimal in the sense that they provide maximal stratigraphic resolution with a minimum of superpositional contradictions; and 3) on positive results from comparative studies (Baumgartner, 1984; Boulard, 1993; Galster et al., 2010; Monnet et al., 2011; Klein and Korn, 2016; Abdelhady et al., 2018).
According to Gradstein (2012) the Unitary Association method considers a zone as a body of ‘correlative units’ rather than events, which results in a lower stratigraphic resolution, but in a robust and reliable regional correlation. Therefore, to make a long-distance correlation possible the UA-method is the most appropriate choice. Additionally, the UA-method has been selected as it seeks the maximum range of a species, which enables worldwide correlation (Gradstein, 2012, figure 3.7). Chronological exclusion of a taxon from a section is only one of six factors influencing these, while there are five non-chronological ones (for further details we refer to Gradstein, 2012, figure 3.3). In conclusion, potential coexistence of a missing taxon has higher probability than its absence.
The aim of the UA-method is to “produce a biostratigraphic zonation and correlation...” (Hammer and Harper, 2006, p. 306) by the use of faunal associations that live or potentially have lived at the same time. The main steps of the UA-method, summed up here, are as follows: 1) The data are compiled into a presence-absence matrix, with samples in rows and taxa in columns; 2) from these data, a discrete sequence of coexistent taxa of minimal duration (= ‘maximal cliques’, MC; also: initial unitary associations; Hammer and Harper, 2006) is constructed; 3) stratigraphic superpositions of MCs are inferred from the observed superpositional relationships between the taxa they contain; 4) the longest possible sequence of superposed UAs (‘longest path’) is used to construct a sequence of UAs; and 5) finally, the original samples are assigned to UAs whenever possible and are thus, stratigraphically correlated.
The critical step of the UA-model is to resolve conflicts in stratigraphic relationships (for details on the method we refer to Guex, 1991, and for a summary see Abdelhady and Fürsich, 2015a). Statistical and biostratigraphic analyses were carried out with the statistics software Past v. 2.17c (http://folk.uio.no/ohammer/past/; Hammer el al., 2001). Violin diagrams and histograms were produced with the R package ‘vioplot version 0.2’ (Adler, 2005).
The UA-method includes important criteria to evaluate the data, which were used herein to compare differences (Table 1) among the four analyzed fossil groups. These are: 1) The total of UAs provides a direct measurement of how much the analyzed time interval can be further subdivided (i.e., biostratigraphic resolution); 2) contradiction(s) (total number of contradicted bio-events); 3) cliques in cycles (virtual coexistence of two taxa that have not occurred together); 4) index of similarity (D; between successive UAs); and 5) reproducibility index (R; geographic reproducibility of identified UAs).
Index of Stratigraphic Potential (ISP)
In addition to the five parameters of the UA-method (see section above) the absolute species duration, Shannon diversity index, and percentage of species confined to single UA (Table 1) were also included in the calculation of the ‘Index of Stratigraphic Potential’ (ISP), which we introduce in this study.
The ISP is defined as follows: ISP = (average R + % species confined to single UA + UAs/Species + average Shannon) - (contradictions/sample numbers + cliques in cycles + average species duration + average D) (also see Table 2).
These parameters were normalized prior to use. Total contradictions were divided by the total number of samples analyzed. The total number UAs was divided by the total number of species (Table 1 and Table 2). Moreover, all of the eight parameters (UAs/Species, % species confined to single UA, average R, Shannon diversity index, contradictions/samples number, cliques in cycles, average species duration, average D) were converted to a (0:1) scale (Table 2) using the following formula: (group value - minimum of all groups) / (maximum of all groups - minimum of all groups). As the variables used are of different scale and units, the latter needs to be homogenized, to give every factor the same power on the calculation (for example, % species confined to single UA is a number between 0 and 100, while the Shannon index usually ranges from 0 to 3). After normalization/rescaling according to the formula above, each factor had the same scale (Table 2; i.e., same power in the final calculated index).
RESULTS
Species Duration, Diversity and Geographic Range-Size
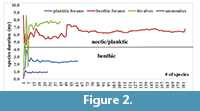
 The cumulative average species duration was plotted against each newly added species. The results show that the graph stabilizes for all fossil groups when at least 50 species are included (Figure 2). After examining the species duration of the invertebrate groups considered in this study, it appeared that ammonites have the shortest species duration (~0.7 m.y.) (Figure 2, Figure 3) followed by planktic foraminifers (2.4 m.y.). Species duration of benthic foraminifers and bivalves is 6.2 and 7.3 m.y., respectively. However, there are exceptions and some bivalve taxa are present for a very short time span (Figure 3). The one-tailed t-test shows a statistically significant variation in species duration between the planktic/nektic fossils (ammonites and planktic foraminifers) and the benthic ones (bivalves and benthic foraminifers) with P > 0.001 (Figure 3).
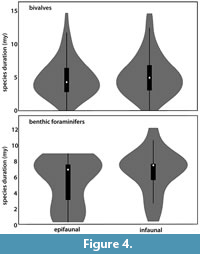 As there was a significant difference in species duration observed that correlates with their life habit, the role of the latter was investigated in more detail. The species duration of infaunal versus epifaunal taxa in both bivalves and benthic foraminifers was compared. No significant difference was found between epifaunal and infaunal taxa as shown in the Box plot (p < 0.001) (Figure 4).
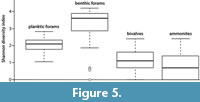
The diversity of the invertebrates in the study sections shows a pronounced variation between the different groups. A box plot (Figure 5) of the Shannon diversity index calculated for each stratigraphic sample indicates that benthic foraminifers have a distinctly higher diversity compared to planktic ones. Similarly, bivalves have relatively higher diversity than ammonites (Figure 5).
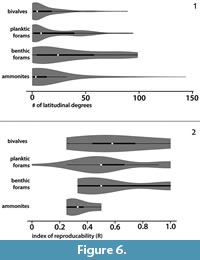
 The geographic range-size of the analyzed fossil groups for the global data in the Violin plots (Figure 6) show that individual ammonite species have the widest geographic ranges (Figure 6.1). However, the average range of the ammonite species throughout their presence on Earth is not more than a few latitudinal degrees, which is comparable to the range of bivalves and benthic foraminifers. Foraminifers have the longest average geographic range-size, and benthic ones distinctly exceed that of the planktic species. The index of reproducibility (R), which is one of the parameters calculated automatically by the UA-method (see below), can be used for regional scale analyses. The created violin plot (Figure 6.2) shows that R is higher for bivalves than for ammonites while benthic and planktic foraminifers have comparable values and lie in between.
Unitary Associations
 The results of the UA-method indicate considerable variation among the examined invertebrate groups (Appendix 6, Appendix 7, Appendix 8, Appendix 9). Raw results would suggest that foraminifers have the highest and comparable number of UAs, while ammonites and bivalves each have only eight UAs. After normalization (Table 2), to make the data comparable, this is different and benthic groups (e.g., benthic foraminifers and bivalves) produced less numbers of UAs compared to nektic/planktic taxa (ammonites and planktic foraminifers) if the UAs normalized to the species number examined. In addition, superpositional contradictions are considerably lower in ammonites and planktic foraminifers compared to bivalves and benthic foraminifers (Table 1 and Table 2).
Contradicting stratigraphic events can be evaluated by the total number of cliques in cycles. The UA results show that the number of cliques in cycles is highest in benthic foraminifers and bivalves but low for ammonites and even absent for planktic foraminifers (Table 2).
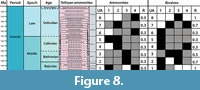
The reproducibility matrix, which indicates which UA is identified in which area (i.e., geographical reproducibility), is important for correlations. 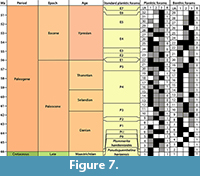 The index of reproducibility (R; being independent of the number of sections) is defined as the proportion of the identified UAs to both potentially and identifiable ones (Mailliot et al., 2006), and is summarized in the reproducibility matrices (Figure 7 and Figure 8). Although, the index of reproducibility R is only a guideline, it can be used herein for evaluation of the biostratigraphic markers. R values are lowest for ammonites (Table 2), which coincides with the geographic range obtained from the global data (Figure 6). In contrast, planktic foraminifers and benthic taxa have a relatively higher R value (Figure 6.2). The latter is not in line with the global data (Figure 6.1), which points to a high variability of the geographic range-size within taxa of the same analyzed fossil group (i.e., interspecific variation is higher than intra-specific variations).
 The percentages of species confined to a single UA, produced automatically in the UA method, are higher in ammonites and very low in benthic foraminifers, while both planktic foraminifers and bivalve have comparable intermediate values (non-normalized; Table 2). An average value was estimated from the similarity coefficient D (Table 2) between the successive UAs for each taxonomic group with ammonites having highest average D values among the investigated fossil groups (Table 2).
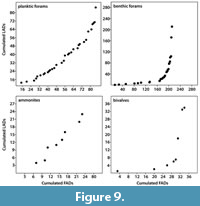 Evaluating the extinction rates of the different fossil groups shows that extinction rates of nektic/planktic taxa (ammonite and planktic foraminifers) are higher in the studied sections than those of benthic ones (parable-shaped graphs for bivalves and benthic foraminifers; Figure 9), which is correlated to the species duration estimated herein (i.e., the higher the extinction rate, the shorter the species duration). Moreover, extinction rates are more variable in benthic taxa, while planktic/nektic ones have relatively stable rates through the analyzed time intervals (Figure 9).
Index of Stratigraphic Potential (ISP)
The ISP value was newly obtained for the analyzed fossil groups and can now be used to compare their stratigraphic potential. At first, there was a conspicuous variation between planktic/nektic fossils and benthic ones. The benthic taxa, which are more prone to facies and other stratigraphic distortion had low or even negative values, while planktic and nektic ones have (pronounced) positive values (Table 2). In case of this study and the taxa used herein, after normalization planktic foraminifers have the highest ISP-value followed by ammonites, bivalves, and benthic foraminifers.
DISCUSSION
Comments on the Data and Methods
The PBDB includes a vast set of records of collection-based occurrence and taxonomic data for various organisms of all geologic ages. Therefore, the PBDB encourages and enables addressing large-scale biological and stratigraphic questions (Varela et al., 2015). However, data that could have been entered bed-by-bed or at the zone-level, were entered at a lower resolution (epoch level ~ 2 m.y.). Therefore, a proper species range analysis is not possible. A high-resolution (bed or biozone level) database is greatly required for evaluating species duration at different spatiotemporal scales.
The use of benthic invertebrates such as bivalves and benthic foraminifers on biostratigraphy is facing two main problems: 1) The taxa are strongly facies-dependent which means, that their occurrence is controlled by the environment during life and time of deposition (Hallam, 1969, 1971); and 2) the presence of the same species in different provinces may show a time lag (i.e., a migration delay; see Boggs, 2001). Pelagic taxa might also correlate with factors related to facies (during lifetime or after deposition) and therefore, they may depend indirectly on facies as well (see Gradstein, 2012).
In addition to the facies problem, many other taphonomic distortions may hinder the recognition of true species boundaries such as sampling quantity and quality, species abundance (density), misidentification, time lag due to species migration, and different evolution rates at different latitudes (for review see Gradstein, 2012).
However, combining many stratigraphic sections by using quantitative biostratigraphic models may overcome some of these complications and provide acceptable biochronological results (see also Abdelhady and Fürsich, 2015a; Abdelhady et al., 2018). One of these models that do so is the Unitary Associations method (Baumgartner, 1984; Galster et al., 2010; Monnet et al., 2011; Abdelhady and Fürsich, 2015a; Klein and Korn, 2016). According to Klein and Korn (2016), the results of the UA-method perfectly mirror the empirical data from a single outcrop and the biozonation is more robust compared to other quantitative methods. Seeking the maximum range of species instead of an average one, as does the UA-method, overcomes limitations of species range determination and enhances stratigraphic correlations. The UA-method creates potential correlations of stratigraphic boundaries (Pálfy and Vörös, 1998; Pálfy, 2007). Therefore, applying the UA-method to large datasets of benthic organisms (e.g., benthic foraminifers and bivalves) may partially annul their limitations in biochronology. The results obtained indicate that the UA-method and their associated parameters have a great significance in evaluating the stratigraphic potential of the fossil groups.
The tools provided by UA-method have enabled us to critically evaluate the invertebrate groups in this study as biostratigraphic indicators. These tools include the total number of contradictions, which factors that control the stratigraphic validity of the investigated fossils. These contradictions may be the result of facies dependency (i.e., the examined areas represent different environments and as a taxon may be facies controlled/dependent it might therefore be absent in one environment and at the same time it lives in another one). Furthermore, such contradictions may also be the result of taphonomic and/or diagenetic loss.
The total number UAs is of importance as well in our study. The results indicate that these numbers depend on the biological characteristics of an animal group. Rapid evolutionary rates enable rapid and sharp changes in biological communities, as the origin of fossil assemblages. As mentioned previously, the UA-method produces zones similar to the Oppel zones and, therefore, they are optimal by providing maximal stratigraphic resolution with a minimum of superpositional contradictions (Angiolini and Bucher, 1999). Although other stratigraphic methods may provide a higher stratigraphic resolution (e.g., the RASC method), geographic correlation may be not possible (see Klein and Korn, 2016; Abdelhady et al., 2018).
Benthic foraminifers are comparable to bivalves in most stratigraphic ranking parameters. Therefore, we conclude that life-habit plays an important role in shaping species geographic range size (Abdelhady and Fürsich, 2015b) and species duration (Crampton et al., 2010). The benthic lifestyle likely increases the facies dependency of the fauna inducing that their stratigraphic indices are loaded. The lower stratigraphic index of the benthic foraminifers relatively to bivalves may be related to the fact that many bivalve taxa have a planktotrophic larval development mode (e.g., oysters, pectinids, and heterodonts) and, therefore, have a higher capability to disperse over greater distance in immature stages. This result is also supported by Abdelhady and Fürsich (2015b) and according to Crampton et al. (2010) the planktotrophic larval type of gastropods is associated with large range-size and duration indirectly, whereas direct association of larval type and geographic range was not confirmed.
Stratigraphic Value of Benthic Taxa
Both spatial and temporal ranges of taxa can be used as preliminary assessment tools to evaluate the stratigraphic potential of studied fossils. Taxa with poor spatial documentation and long stratigraphic ranges are considered to be a low order stratigraphic marker and vice versa. Poor lateral distribution of a taxon may be related to its bio-/ecological traits (Kammer et al., 1997; Liow, 2007). Such taxa have poorly constrained superpositional relationships.
Although the mean duration of bivalve species is estimated to be ~15 Ma (e.g., Stanley, 1979), the ranges in this study are distinctly shorter (~3.3 m.y.). The latter is same for ammonites, and benthic and planktic foraminifers as well (for comparison see Stanley, 1979). This seems to confirm the inconsistence of species range estimations due to high variation among different genera and among different time intervals. The interval covered by our study is rather short with only ~13 m.y. and FADs and/or LADs of many species analyzed herein lie beyond the base/top of the sampled sections of Sinai. Moreover, the studied sections have occupied lower latitudes during deposition, where species duration is believed to be shorter than at higher latitudes (see Mittelbach et al., 2007). The covered time interval and the low latitude setting of the sections in this study may justify the shorter durations estimated herein. Nevertheless, further investigation of invertebrate species duration at long-interval, higher latitudes, and combining multiple sections is recommended to fill the gaps in the stratigraphic ranges of fossil groups.
Our results showed that R is higher for bivalves than for ammonites, and both benthic and planktic foraminifers have comparable values (Figure 6.2). We speculate that this indicates that, at regional scale, benthic taxa may be more useful than nektic/planktic taxa, especially where they occur in a great abundance (see also Abdelhady et al., 2018).
The geographic range-size of some ammonites is very wide (Figure 6.1). However, the average in the global data and the R index is surprisingly low. We conclude, as for now, that for those taxa with very wide geographic range (representing the global/Tethys index biozones) their stratigraphic value is lower than previously assumed.
Based on log-linear models of families of New Zealand´s Cenozoic marine mollusks, Crampton (2010) found that life habit, duration, and planktotrophic larval development, all are associated with a large range size for gastropods but not for bivalves. The result in our study (i.e., the insignificant difference in species duration among infaunal and epifaunal bivalves (Figure 4) agrees with the results observed by Crampton et al. (2010).
The high proportional abundance, the relatively good fossil record and the restricted stratigraphic range of some bivalve orders offer valuable biozonation tools (Ayyasami, 2006) and e.g., rudist and inoceramid bivalves have a well-known stratigraphic value, especially in the Cretaceous (Masayuki and Tatsuro, 1998; Masse, 1996). Additionally, McRoberts (2010) has introduced a biochronological scheme for the Triassic based on bivalves. This scheme is based on the fact that several Triassic bivalve genera have short stratigraphic ranges at a wide geographic distribution comparable to that of ammonites (e.g., Claraia, Daonella, Enteropleura, Eomonotis, Halobia, Monotis and Peribositria), which likely is the result of their opportunistic nature (i.e., they have occupied different environments). Abdelhady (2008) found that oyster bivalves are good age markers for the Late Cretaceous where some genera such as Pycnodonte, Ampohidonte, and Rhynchostreon have limited stratigraphic distribution.
According to Gradstein (2012) there are five non-chronological causes for species absence. We therefore conclude that facies dependency of benthic taxa (only one of the five) is not the main cause for lower stratigraphic potential. Other possible errors may originate from the fact that paleontological species are morphospecies that are recognized on a limited availability of anatomical characteristics where fossil species may not coincide with extant biospecies. In addition, criteria used to define fossil species vary among researchers (see Sepkoski, 1998 and Gradstein, 2012).
Additional errors may result from patchy sampling at both spatial and temporal scales. Further obstacles are that fossiliferous horizons received limited/or no attention in contrast to fossiliferous areas. Moreover, sampling of macroinvertebrates usually is not quantitative, while sampling of microinvertebrates is more systematic. Furthermore, extracting fossils from hard and lithified rocks may cause pronounced sampling artifacts. In addition, species of particular interest (for stratigraphic correlation; e.g., ammonites, conodonts) have received much more attention than less useful fossils (e.g., gastropods). However, for the best possible results the data analyzed herein were sampled at a rigorous quantitative approach to minimize the effects of these (see above) extrinsic factors. In addition, we have normalized all parameters (excluding species range) and scaled them on 0 to 1 scale for robust results.
Stratigraphic Ranking
Integration of many parameters, which are 1) easy to calculate; and 2) independent of sample, species, and section number and/or distance, ensure reproducibility of the developed method (ISP) and indicate that they effectively measure the quality of fossils to be used for biostratigraphy. Moreover, the parameters implemented include all of the criteria of an index fossil (i.e., the spatial/temporal range and abundance). Calculation tests excluding one or more parameters, revealed no effect on the final results, which point to the robustness of the calculated index.
Bivalves and benthic foraminifers have considerable geographic distribution (R, section similarity; Table 1), while planktic foraminifers and ammonites have a shorter species range and lower contradictions per species value (Table 2). Therefore, we can conclude that their stratigraphic value exceeds that of bivalves and benthic foraminifers.
For robust ranking, an index (ISP), which integrates abundance and geographical and stratigraphical parameters, was developed herein to support quantitative ranking (compare Table 2; normalized column). Although ammonites have the shortest species duration, the planktic foraminifers with their higher diversity and wide geographic range also ensure a useful geographic correlation, which is the major concern in biostratigraphical studies.
According to Stanley (1979), bivalves characterized by species longevities in contrast to ammonites, with average species durations that do not exceed a million years. Stanley has ranked macroinvertebrates according to their average species longevity (Stanley, 1979; Figure 9) as follows: foraminifers (15-30 m.y.) > bivalves (15 m.y.) > gastropods (10 m.y.) > echinoids (5 to 7 m.y.) > ammonites (~ 1 m.y.). Therefore, and in agreement with Stanley (1979), we conclude that species duration alone is not significant enough for evaluating the stratigraphic validity of a fossil group and further parameters such as geographic range-size and abundance should be included. Also factors, such as a species’ life mode (i.e., infauna vs. epifaunal) and geographic dispersal, may play a major role in determining a species’ longevity. In addition, there may be major contrast between subsets of species within the major fossil groups. For example, at regional scale there is a high value for the benthic foraminifers (see Abdelhady et al., 2018). Moreover, imperfection of the fossil record (e.g., sampling artifacts, preservation bias, and small population size) may burden direct enumeration of species longevities from stratigraphic data.
Although benthic taxa are environmentally controlled, they may be of valuable stratigraphic significance (McRoberts, 2010). In addition, the relatively newly introduced QSA such as UA, RASC (Ranking and Scaling), and CONOP (Constrained Optimization; Hou, 2014) may enhance the potential of these fossil groups as an age-determinant (Galster et al., 2010; Monnet et al., 2011, 2015). Ammonites have a high reputation to be excellent age biomarkers, but quantitative methods can significantly improve the quality of ammonite biozonations (e.g., Pálfy and Vörös, 1998; Pálfy et al., 1997, 2003; Pálfy, 2007; Abdelhady and Fürsich, 2015a; Monnet et al., 2015; Abdelhady et al., 2018). The invertebrate fossil groups in this study are ranked from first to fourth order as follows: planktic foraminifers, ammonites, bivalves, and benthic foraminifers (Table 2, normalized dataset) with the benthic taxa, which are more prone to facies and other stratigraphic distortion being loaded negatively, while planktic and nektic fossils have a positive value for the ISP (Table 2). The shorter species duration of ammonites (nektic) and planktic foraminifer species in the studied sections can be attributed to their higher extinction rates (Figure 9).
Ranking of the selected fossil groups in our study is based on the analyzed datasets (i.e., on data that are limited to specific spatial (geographic area) and temporal [Jurassic/Paleogene] boundaries). The implemented parameters were normalized, which is valuable if differences in parameters are related (directly or indirectly) to biotic traits such as diversity. However, ranking might differ if either or both the area and the time interval is changed for analysis. Therefore, we highly recommend future studies using regional and global data to test the consistency of the methods used and obtained in this study.
CONCLUSIONS
• To evaluate the stratigraphic potential of marine invertebrates at regional and worldwide scales, occurrence data of foraminifers, ammonites, and bivalves from field sampling as well as from the PBDB were analyzed.
• The examined invertebrate groups have comparable geographic range size, however, ammonites and planktic foraminifers have more temporal restrictions. Superpositional contradictions were low in nektic/planktic groups in comparison with benthic foraminifers and bivalves. In contrast to planktic-benthic spatiotemporal differences, the comparison of infaunal and epifaunal lifestyle retained no significant difference at both regional and worldwide scale.
• In contrast to simple spatiotemporal analyses, the tools provided by UA-method have enabled a critical evaluation of the invertebrate groups as biostratigraphic indicators. Therefore, the value of the planktic taxa as a stratigraphic marker exceeds that of benthic ones.
• Based on both, the spatiotemporal data and the UA-model, the invertebrate fossil groups can be ranked from first to fourth order as follows: planktic foraminifers, ammonites, bivalves, and benthic foraminifers.
ACKNOWLEDGMENTS
Our thanks go to the anonymous reviewers for critical and valuable comments to improve the quality of the manuscript. We also thank M. Aberhan (Berlin) for support in using the stratigraphic data from the PBDB. A. Abdelhady is grateful for support by the Deutsche Gesellschaft für Internationale Zusammenarbeit (GIZ) / Centre for International Migration and Development (CIM) (grant #41704). B. Seuss is thankful for financial support by the DFG (SE 2283/2-1). This is PBDB publication #342.
REFERENCES
Abdelhady, A.A. 2008. Cenomanian/Turonian mass extinction of macroinvertebrates in the context of paleoecology. A case study from north Wadi Qena, Eastern Desert, Egypt. p. 103-127. In Elewa, A.M.T. (ed.), Mass Extinction. Springer, Berlin. https://doi.org/10.1007/978-3-540-75916-4_9
Abdelhady, A.A. and Fürsich, F.T. 2015a. Quantitative biostratigraphy of the Middle to Upper Jurassic strata of Gebel Maghara (Sinai, Egypt). Newsletters on Stratigraphy, 48:23-46. https://doi.org/10.1127/nos/2014/0053
Abdelhady, A.A. and Fürsich, F.T. 2015b. Palaeobiogeography of the Bajocian-Oxfordian macrofauna of Gebel Maghara (North Sinai, Egypt): Implications for eustasy and basin topography. Palaeogeography, Palaeoclimatology, Palaeoecology, 417:261-273. https://doi.org/10.1016/j.palaeo.2014.10.042
Abdelhady, A.A., Seuss, B., El-Dawy, M.H., Obaidalla, N.A., Mahfouz, K.H., and Hussein, A.A.A. 2018. The Unitary Association method in biochronology and its potential stratigraphic power between benthic and planktic organisms: A case study on foraminifers from Paleocene-Eocene strata of southern Egypt. Geobios, 51:259-268. https://doi.org/10.1016/j.geobios.2018.06.005
Adler, D. 2005. Vioplot: Violin plot. R package version 0.2. https://cran.r-project.org/web/packages/vioplot/index.html
Agterberg, F.P. and Gradstein, F.M. 1999. The RASC method for ranking and scaling of biostratigraphic events. Earth-Science Reviews, 46:1-25. https://doi.org/10.1016/S0012-8252(99)00007-0
Angiolini, L. and Bucher, H. 1999. Taxonomy and quantitative biochronology of Guadalupian brachiopods from the Khuff Formation, Southeastern Oman. Geobios, 32:665-699. https://doi.org/10.1016/S0016-6995(99)80057-6
Aubry, M.P., Berggren, W.A., Kent, D.V., Flynn, J.J., Klitgord, K.D., Obradovich, J.D., and Prothero, D.R. 1988. Paleogene geochronology: An integrated approach. Paleoceanography and Paleoclimatology, 3:707-742. https://doi.org/10.1029/PA003i006p00707
Ayyasami, K. 2006. Role of oysters in biostratigraphy: A case study from the Cretaceous of the Ariyalur area, southern India. Geosciences Journal, 10:237-247. https://doi.org/10.1007/BF02910367
Baumgartner, P.O. 1984. Comparison of Unitary Associations and probabilistic ranking and scaling as applied to Mesozoic radiolarians. Computer & Geoscience, 10:167-183. https://doi.org/10.1016/0098-3004(84)90015-3
Boggs, J.S. 2001. Sedimentary structures, p. 88-130. In Boggs, J.S. (ed.), Principles of Sedimentology and Stratigraphy. Pearson Prentice-Hall, Upper Saddle River, New Jersey.
Bolli, H.M., Saunders, J.B., and Perch-Nielsen, K. 1989. Plankton Stratigraphy: Volume 1, Planktic Foraminifera, Calcareous Nannofossils and Calpionellids. Cambridge University Press, Cambridge.
Boulard, C. 1993. Biochronologie quantitative, concepts, methodes et validité. Documents des Laboratoires de Géologie de Lyon, 128:1-259.
Brinkhuis, H. 1994. Late Eocene to Early Oligocene dinoflagellate cysts from the Priabonian type-area (Northeast Italy): Biostratigraphy and paleoenvironmental interpretation. Palaeogeography, Palaeoclimatology, Palaeoecology, 107:121-163. https://doi.org/10.1016/0031-0182(94)90168-6
Buzas, M.A. and Culver, S.J. 1984. Species duration and evolution: Benthic foraminifera on the Atlantic continental margin of North America. Science, 225:829-830. https://doi.org/10.1126/science.225.4664.829
Crampton, J.S., Cooper, R.A., Beu, A.G., Foote, M. and Marshall, B.A. 2010. Biotic influences on species duration: Interactions between traits in marine molluscs. Paleobiology, 36:204-223. https://doi.org/10.1666/09010.1
Fan, J.X., Chen, Q., Hou, X.D., Miller, A.I., Melchin, M.J., Shen, S.Z., Wu, S.Y, Goldman, D., Mitchell, C.E., Yang, Q., Zhang, Y.D., Zhan, R.B., Wang, J., Leng, Q., Zhang, H., and Zhang, L.N. 2013. Geobiodiversity Database, a comprehensive section-based integration of stratigraphic and paleontological data. Newsletters on Stratigraphy, 46:111-136. https://doi.org/10.1127/0078-0421/2013/0033
Galster, F., Guex, J., and Hammer, Ø. 2010. Neogene biochronology of Antarctic diatoms, a comparison between two quantitative approaches, CONOP and UAgraph. Palaeogeography, Palaeoclimatology, Palaeoecology, 285:237-247. https://doi.org/10.1016/j.palaeo.2009.11.015
Gradstein, F.M. 2012. Biochronology, p. 43-61. In Gradstein, F.M., Ogg, J.G., Schmitz, M.D., and Ogg, G.M. (eds.), The Geologic Time Scale. Elsevier, Amsterdam. https://doi.org/10.1016/B978-0-444-59425-9.00003-2
Guex, J. 1979. Terminologie et methodes de la biostratigraphie moderne. Bulletin de la Sociétè Vaudoise des Sciences Naturelles, 74:169-216.
Guex, J. 1991. Biochronological Correlations. Springer, Berlin.
Guex, J. 2011. Some recent ‘refinements’ of the Unitary Association method, a short discussion. Lethaia, 44:247-249. https://doi.org/10.1111/j.1502-3931.2011.00283.x
Guex, J., Bartolini, A., Atudorei, V., and Taylor, D. 2004. High-resolution ammonite and carbon isotope stratigraphy across the Triassic-Jurassic boundary at New York Canyon (Nevada). Earth and Planetary Science Letters, 225:29-41. https://doi.org/10.1016/j.epsl.2004.06.006
Guex, J., Galster, F., and Hammer, Ø. 2015. Discrete Biochronological Time Scales. Springer, Berlin. https://doi.org/10.1007/978-3-319-21326-2
Hallam, A. 1969. Faunal realms and facies in the Jurassic. Palaeontology, 12:1-18.
Hallam, A. 1971. Provinciality in Jurassic faunas in relation to facies and palaeogeography. Geological Journal, Special Issue, 4:129-152.
Hammer, Ø. and Harper, D.A.T. 2006. Paleontological Data Analysis. Blackwell, Oxford. https://doi.org/10.1002/jqs.1107
Hammer, Ø., Harper, D.A.T., and Ryan, P. 2001. PAST, paleontological statistics software package for education and data analysis. Palaeontologia Electronica, 4:1-9.
|https://palaeo-electronica.org/2001_1/past/issue1_01.htm
Hassan, H.F. and Abouelresh, M.O. 2019. The effect of early Paleogene sea-level change on biostratigraphy and paleoenvironmental settings: an example from north Sinai, Egypt. Micropaleontology, 65:127-143.
Hassan, H.F. and Elderbak, K. 2016. Foraminiferal biostratigraphy and paleoenvironments of the lower Paleogene succession in central and south Sinai, Egypt. Geological Society of America Abstracts with Programs 48(7). Denver, Colorado, USA. https://doi.org/10.1130/abs/2016AM-283711
Hassan, H.F. and Nassif, M.S. 2018. Campanian-Maastrichtian paleotemperature and paleodepth changes along Tethyan transect, North Sinai, Egypt. Journal of African Earth Sciences, 144:41-58. https://doi.org/10.1016/j.jafrearsci.2018.03.019
Hou, X. 2014. CONOP - A quantitative stratigraphic software and an approach to its parallelization. GSA Annual Meeting in Vancouver, British Columbia. https://gsa.confex.com/gsa/2014AM/finalprogram/abstract_248455.htm
Kammer, T.W., Baumiller, T.K., and Ausich. W.I. 1997. Species longevity as a function of niche breadth: Evidence from fossil crinoids. Geology, 25:219-222. https://doi.org/10.1130/0091-7613(1997)025<0219:slaafo>2.3.CO;2
Kaufmann, B. 2006. Calibrating the Devonian time scale: A synthesis of U-Pb ID-TIMS ages and conodont stratigraphy. Earth-Science Reviews, 76:175-190. https://doi.org/10.1016/j.earscirev.2006.01.001
Keller, G. 1983. Biochronology and paleoclimatic implications of middle Eocene to Oligocene planktic foraminiferal faunas. Marine Micropaleontology, 7:463-486. https://doi.org/10.1016/0377-8398(83)90011-7
Kemple, W.G., Sadler P.M., and Strauss. D.J. 1989. A prototype constrained optimization solution to the time correlation problem. In Agterberg, F.P. and Bonham-Carter G.F. (eds.), Statistical Applications in the Earth Sciences. Geological Survey of Canada Paper 89-9:417-425. https://doi.org/10.4095/128081
Klein, C. and Korn, D. 2016. Quantitative analysis of the late Famennian and early Tournaisian ammonoid stratigraphy. Newsletters on Stratigraphy, 49:1-26. https://doi.org/10.1127/nos/2015/0068
Liow, L.H. 2007. Does versatility as measured by geographic range, bathymetric range and morphological variability contribute to taxon longevity? Global Ecology and Biogeography, 16:117-128. https://doi.org/10.1111/j.1466-8238.2006.00269.x
Mailliot, S., Mattioli, E., Guex, J., and Pittet, B. 2006. The early Toarcian anoxia, a synchronous event in the western Tethys? An approach by quantitative biochronology (Unitary Associations), applied on calcareous nannofossils. Palaeogeography, Palaeoclimatology, Palaeoecology, 240:562-586. https://doi.org/10.1016/j.palaeo.2006.02.016
Masayuki, N. and Tatsuro, M. 1998. Palaeontology and stratigraphy of the inoceramid species from the mid-Turonian through upper middle Coniacian in Japan. Acta Geologica Polonica, 48:435-482.
Masse J-P. 1996. Lower Cretaceous rudist biostratigraphy of southern France - a reference for Mesogean correlations. Revista Mexicana de Ciencias Geológicas, 12:36-256.
McRoberts, C.A. 2010. Biochronology of Triassic bivalves. In Lucas, S.G. (ed.), The Triassic Timescale. Geological Society London, Special Publications, 334:201-219. https://doi.org/10.1144/SP334.9
Mittelbach, G.G., Schemske, D.W., Cornell, H.V., Allen, A.P., Brown J.M., Bush, M.B., Harrison, S.P., Hurlbert, A.H., Knowlton, N., Lessios, H.A., McCain, C.M., McCune, A.R., McDade, L.A., McPeek, M.A., Near, T.J., Price, T.D., Ricklefs, R.E., Roy, K., Sax, D.F., Schluter, D., Sobel, J.M., Turelli, M. 2007. Evolution and the latitudinal diversity gradient: Speciation, extinction, and biogeography. Ecology Letters, 10:315-331. https://doi.org/10.1111/j.1461-0248.2007.01020.x
Monnet, C., Brayard, A., and Bucher, H. 2015. Ammonoids and quantitative biochronology - a Unitary Association perspective. Topics in Geobiology, 44:277-298. https://doi.org/10.1007/978-94-017-9633-0_11
Monnet, C., Klug, C., Goudemand, N., De Baets, K., and Bucher, H. 2011. Quantitative biochronology of Devonian ammonoids from Morocco and proposals for a refined unitary association method. Lethaia, 44:469-489. https://doi.org/10.1111/j.1502-3931.2010.00256.x
Ogg, G.J., Ogg, G.M., and Gradstein, F.M. 2016. A Concise Geologic Time Scale. Elsevier, Amsterdam. https://doi.org/10.1016/B978-0-444-59467-9.00001-7
Pálfy, J. 2007. Applications of quantitative biostratigraphy in chronostratigraphy and time scale construction. Stratigraphy, 4:195-199.
Pálfy, J., Mortensen, J.K., Smith, P.L., Friedman, R.M., McNicoll, V., and Villeneuve, M. 2000. New U-Pb zircon ages integrated with ammonite biochronology from the Jurassic of the Canadian Cordillera. Canadian Journal of Earth Sciences, 37:549-567. https://doi.org/10.1139/cjes-37-4-549
Pálfy, J., Parrish, R.R., and Smith, P. 1997. A U-Pb age from the Toarcian (Lower Jurassic) and its use for time scale calibration through error analysis of biochronologic dating. Earth and Planetary Science Letters, 146:659-675. https://doi.org/10.1016/s0012-821x(96)00241-5
Pálfy, J., Parrish, R.R., and Vörös, A. 2003. Mid-Triassic integrated U-Pb geochronology and ammonoid biochronology from the Balaton Highland (Hungary). Journal of the Geological Society, 160:271-284. https://doi.org/10.1144/0016-764902-029
Pálfy, J. and Vörös, A. 1998. Quantitative ammonoid biochronological assessment of the Anisian-Ladinian (Middle Triassic) stage boundary proposals. Albertiana, 21:19-26.
Savary, J. and Guex, J. 1999. Discrete biochronological scales and Unitary Associations: Description of the BioGraph computer program. Mémoires de Géologie, 34:1-281.
Sepkoski, J.J. 1998. Rates of speciation in the fossil record. Philosophical Transactions of the Royal Society of London B, 353:315-326. https://doi.org/10.1098/rstb.1998.0212
Sheets, H.D., Mitchell, C.E., Izard, Z.T., Willis, J.M., Melchin, M.J., and Holmden, C. 2012. Horizon annealing, a collection-based approach to automated sequencing of the fossil record. Lethaia, 45:532-547. https://doi.org/10.1111/j.1502-3931.2012.00312.x
Stanley, S.M. 1979. Macroevolution: Pattern and Process. W.H. Freeman and Company, San Francisco.
Varela, S., González-Hernández, J., Sgarbi, L.F., Marshall, C., Uhen, M.D., Peters, S., and McClennen, M. 2015. PaleobioDB, an R package for downloading, visualizing and processing data from the Paleobiology Database. Ecography, 38:419-425. https://doi.org/10.1111/ecog.01154
