![]()
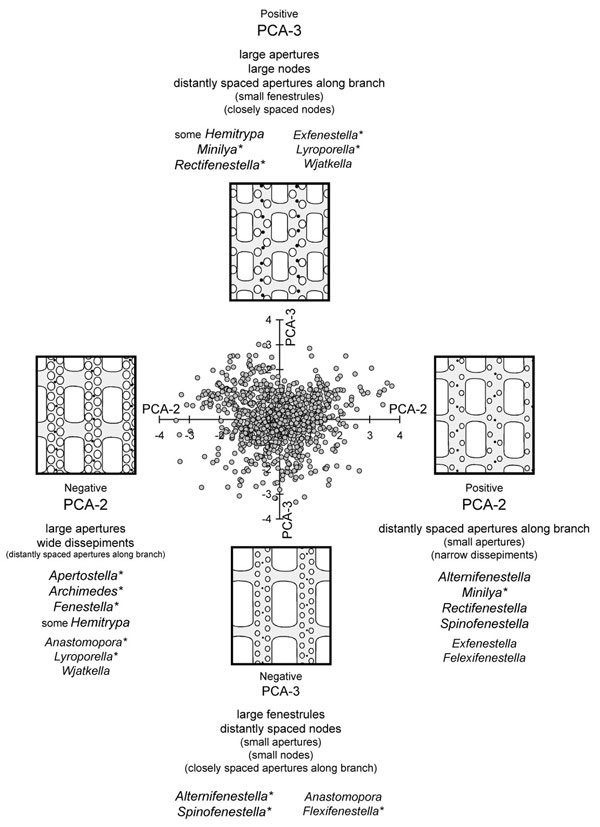
FIGURE 5. Scatter plot of PCA-2 vs. PCA-3, which combined account for 24.2% of the total variance. PCA-2 reflects an inverse relationship between size of apertures and their spacing along branch (Table 4). PCA-3 reflects an inverse relationship between the size of apertures and nodes and spacing of apertures vs. the size of fenestrules and spacing of nodes (Table 5). Figure 6 is an inclined, three dimensional view of this image. Three genera, Cubifenestella, Hemitrypa, and Laxifenestella are centered (no predictable distribution) on PCA-2.