![]()
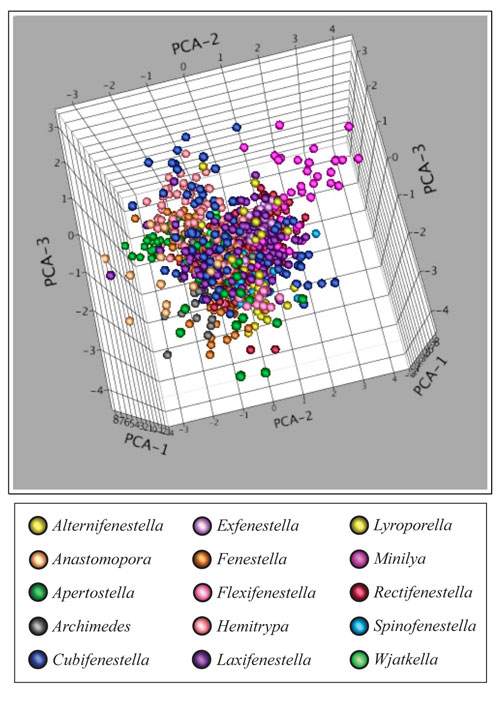
FIGURE 6. Scatter plot of all genera for PCA-1 vs. PCA-2 vs. PCA-3, which combined account for 64.9% of the variance. This view permits an evaluation of distributions along PCA-2 and PCA-3. Animation of the three axes in rotation is provided by Animation 1, which can also be accessed via the Animation Menu. Figure 5 is an orthogonal view (PCA-2 vs. PCA-3) of this image.