Results and discussion
 Shape variation Shape variation
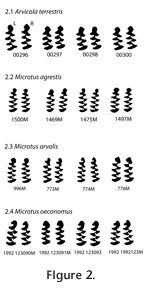
Typical variation among individuals and between left and right teeth is illustrated in
Figure 2. Variation in the shape of the anterior cap is easily seen between individuals, but the left and right teeth of the same individual have the similar cap shapes.
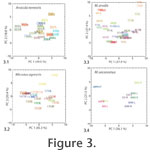
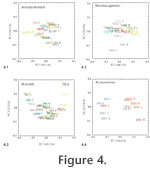
The similarity between left and right molars may also be seen in the PC scatterplots (Figure 3 and
Figure 4). More often than not, the left and right teeth of the same individual are nearest neighbours in the plots, both for Eigenshape and semilandmarks.
MANOVA and Components of Variance
 The results presented visually above can be measured quantitatively by partitioning shape variation into between-individual and between-side components with MANOVA. Both Eigenshape and semilandmark analyses showed that between-individual variance was much greater than variance between left and right teeth (Table 1). Microtus agrestis and M. oeconomus had the greatest amount of asymmetry (22.4-28.5%), whereas Arvicola terrestris and M. arvalis had less (11.4-13.8%). These results suggest that within-species variation is only marginally inflated by random environmental effects. The results presented visually above can be measured quantitatively by partitioning shape variation into between-individual and between-side components with MANOVA. Both Eigenshape and semilandmark analyses showed that between-individual variance was much greater than variance between left and right teeth (Table 1). Microtus agrestis and M. oeconomus had the greatest amount of asymmetry (22.4-28.5%), whereas Arvicola terrestris and M. arvalis had less (11.4-13.8%). These results suggest that within-species variation is only marginally inflated by random environmental effects.
Using left-right asymmetry as a minimum estimate of environmental variance (E), heritability (h2) of tooth shape in the four species was estimated (Table 1). Heritabilities ranged from 0.71 to 0.89.
 Matching Contralateral Teeth Matching Contralateral Teeth
In many cases, contralateral teeth from the same individual were more similar to the teeth of another individual than to each other. Using Procrustes distance, which is a form of nearest-neighbour matching, we found that in Arvicola terrestris,
two out of 28 (7.1%) teeth did not match to their contralateral counterpart; in Microtus agrestis 15 out of 24 (62.5%) did not match; in M. arvalis 20 out of 38 (52.6%) were mismatched; and in M. oeconomus
four out of 14 (28.5%) were incorrectly matched.
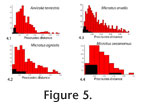 Procrustes distances between teeth of different individuals were often larger than between teeth of the same individual, but many teeth of different individuals had Procrustes distances that were as small as those between teeth of the same individual (Figure 5). Thus, teeth of the same individual cannot reliably be matched based on shape alone. Procrustes distances between teeth of different individuals were often larger than between teeth of the same individual, but many teeth of different individuals had Procrustes distances that were as small as those between teeth of the same individual (Figure 5). Thus, teeth of the same individual cannot reliably be matched based on shape alone.
The Relative Merits of Eigenshape and Semilandmarks (Procrustes)
As discussed above, the PC plots of molar shape generated by Eigenshape and semilandmark analyses were broadly similar. The fact that corresponding plots had the same teeth as outliers on each of the two PC axes indicates that both methods are recovering the same variation (Figure 3). For example, the right and left molars of specimen 00303 of Arvicola terrestris lie at one end of the first PC extracted by both methods, and specimen 00304 lies at one end of PC2. The fact that the positive and negative ends of the axes are flipped can be ignored because shape does not have an inherent directionality. The percentages of within and between individual variation were roughly the same regardless of which method was used.
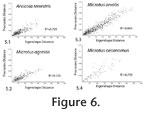 That the two methods yield similar results can be further tested by comparing Eigenshape and Procrustes distances between pairs of teeth (Figure 6). We calculated all possible pairwise distances using both methods for each of the four species. The tight correlation between the two distances again indicates that each is measuring the same differences in shape and that one method can safely be substituted for the other. That the two methods yield similar results can be further tested by comparing Eigenshape and Procrustes distances between pairs of teeth (Figure 6). We calculated all possible pairwise distances using both methods for each of the four species. The tight correlation between the two distances again indicates that each is measuring the same differences in shape and that one method can safely be substituted for the other.
|