FIGURE 1. Geometric relationship of the observed temporal range or density, OTD, for a taxon of interest, and the estimated temporal range or density, ETD, which is the sample space from which OTD is inferred to have been drawn. OTD is cross-hatched here and in following illustrations. ETD involves a one-tailed extension of OTD backward in geological time from t2 to an inferred time of origin at t1. The sample space here is uniform, meaning that it has a constant width and there is a constant probability of drawing a sample from any part of the linear range of ETD—making OTD µ (t3 - t2) and ETD µ (t3 - t1)—this simplification is relaxed in the applications considered here. For purposes of inference, sample size n is restricted to the number of stratigraphic samples in OTD drawn independently from ETD (total sample size in OTD could of course be much larger than n if recovery of one sample led, directly or indirectly, to recovery of others). The probability that a sample drawn from ETD falls in OTD is the ratio of areas (or volumes) OTD/ETD, the probability two samples drawn independently from ETD both fall in OTD is the product of their independent probabilities, and the probability n - 1 independent samples from ETD fall in OTD is consequently (OTD/ETD)n-1 (we consider observed t2 and inferred t1 to be a function of n - 1 samples rather than all n because one sample is committed to fix the end of both OTD and ETD at t3).
Likelihood estimation involves comparison of the relative likelihoods of different hypotheses concerning t1 and ETD, where the likelihood of a particular hypothesis is proportional to the probability of the observed results, n samples in OTD, for that hypothesis: k · P(OTD, n|ETD), with k being an arbitrary constant. Given the geometric model shown here and the observed results, n samples falling in OTD, the hypothesis about t1 and ETD that has maximum likelihood is the hypothesis that t1 = t2 and ETD = OTD. Maximum likelihood, by convention, has an associated likelihood ratio L of k · P divided by itself: L = (k · P)/(k · P) = 1, and competing likelihood ratios are necessarily smaller, lying in the range 0 to 1. Note that while P less than or equal to 1, there is always a likelihood ratio L = 1 and L is consequently an upper bound for P.
How small a likelihood ratio L is acceptable depends on our choice of a critical likelihood or critical likelihood ratio l. In the following applications we consider two values of l, l = 0.5 and l = 0.05; these are upper limits for ordinary levels of significance a = 0.5 and a = 0.05 and hence define conservatively narrow 50% and 95% confidence limits for t2 and OTD in terms of an hypothesized origination time t1 and ETD.
In general, ETD = OTD / (n-1)Öl and we are interested to know how large we can make ETD and still expect all samples from ETD to fall in OTD in 1 out of 1/l trials—in other words, how large can ETD be and still yield OTD some small but still reasonable proportion of the time?
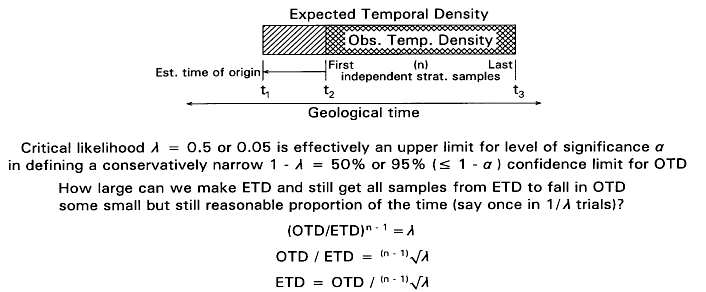
FIGURE 2. Relationship of estimated temporal range or density [ETD] of a taxon to its observed temporal range or density [OTD], expressed as a function of the number of independent samples n found in OTD, for critical likelihood l = 0.05. Note that ETD is 20 × OTD for n = 2 (exceeding OTD by 1900%), but this proportion falls rapidly to less than 2 × OTD when n = 6 (exceeding OTD by 82.1%) and less than 1.1 × OTD when n = 33 (exceeding OTD by only 9.8%). For values of sample size n considered in applications here, n = 42 and n = 56, differences in ETD are insensitive to small changes in n (addition or subtraction of a sample changes the difference between ETD and OTD by 0.002 to 0.001 or 0.2 to 0.1%).
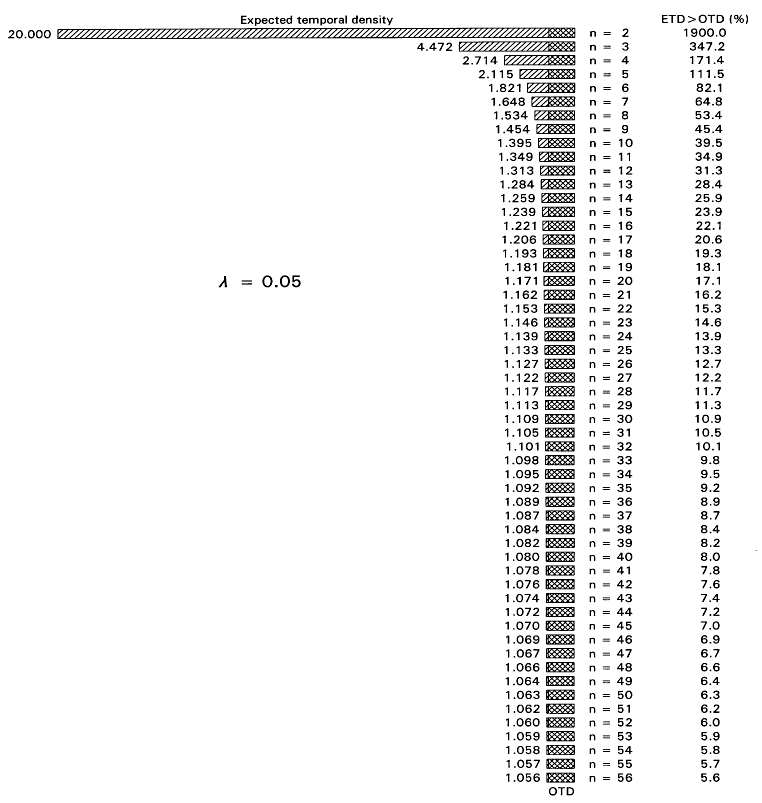
FIGURE 3. Relationship of estimated temporal range or density [ETD] of a taxon to its observed temporal range or density [OTD], expressed as a function of the number of independent samples n found in OTD for critical likelihood l = 0.05 (heavier line) and also for l = 0.5 and l = 0.01 (lighter lines). For values of sample size n considered in applications here, n = 42 and n = 56, differences in ETD are not very sensitive to small changes in l.
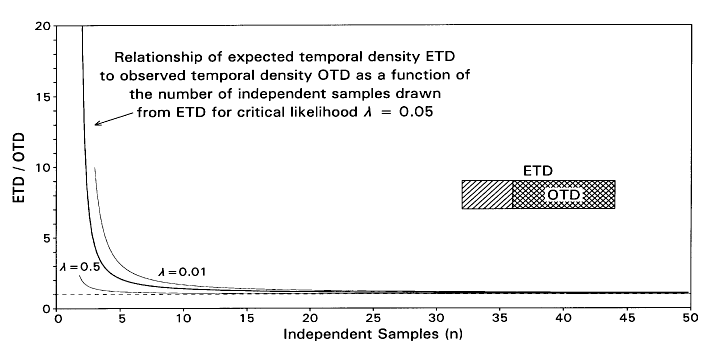
FIGURE 4. Graphical model for analysis of the time of origin of Archaeoceti, assuming that all uncertainty is in the left or origination tail of the confidence interval (compare work sheet in Table 2). Sample space is three-dimensional and composed of five volumes: A is the partially-stippled volume preceding inferred origination and diversification of the taxon of interest; B is the thin wedge-shaped origination volume (hatched) reflecting the density of potential fossils during diversification; C is the volume representing the density of the known fossil record (cross-hatched); D is negligible because we are not concerned with extinction here; and E is the partially-stippled volume succeeding inferred extinction or conversion to another taxon. For comparison with other figures, tables, and text, volume C is the observed temporal density OTD, and volumes B + C together are the expected temporal density ETD. The sample space shown here reflects the exponentially declining availability of older fossil-bearing sedimentary rocks at the earth's surface (F), and diversification of Archaeoceti at a constant rate in the d dimension from the time they are first inferred to have existed until they are first found as fossils. Simulation built into the analysis tests analytical assumptions by repeatedly drawing samples of size n = 42 from B + C (or ETD) and counting the number of times all fall in C (or OTD) in 1000 trials (one sample is shown in simulation bar at bottom of figure). All samples drawn from B + C fell in C in 53 of 1000 simulation trials, which is close to the 50/1000 times expected with a critical likelihood l = 0.05.
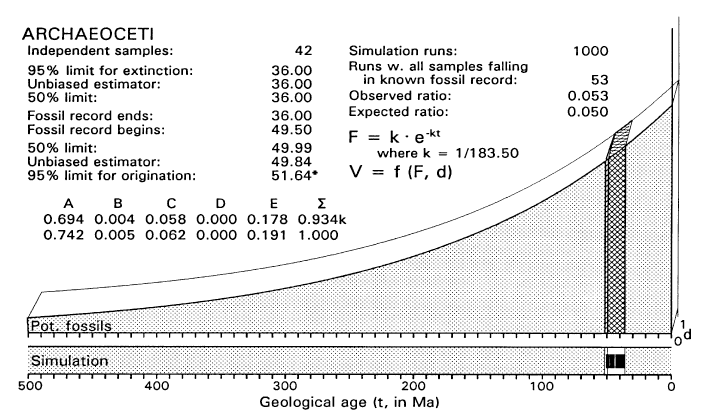
FIGURE 5. Likelihood function for the time of origin of Archaeoceti, calculated as shown in Table 2 (but with a 0.0001 increment of origination volume). Note that maximum likelihood here (L = 1) corresponds to the time t = 49.5 Ma when the fossil record of Archaeoceti begins. L = 0.05 (the critical likelihood l employed here) when t is about 51.6 Ma. Given present evidence, there are about 2 chances in a thousand that archaeocetes existed and will be found as fossils at the Paleocene-Eocene boundary, and 6 chances in a billion that archaeocetes existed and will be found as fossils at the Cretaceous-Paleocene boundary.
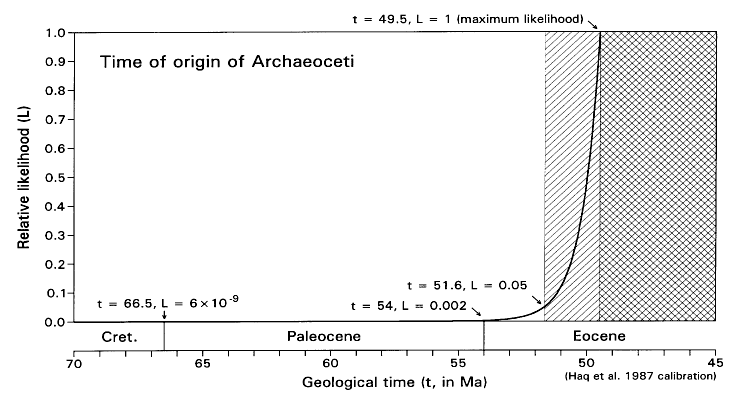
FIGURE 6. Graphical model for analysis of the time of origin of Mesonychia, assuming that all uncertainty is in the left or origination tail of the confidence interval (compare work sheet in Table 4). Sample space is three-dimensional as in Figure 4. The sample space shown here reflects the exponentially declining availability of older fossil-bearing sedimentary rocks at the earth's surface (F), and diversification of Mesonychia at a constant rate in the d dimension from the time they are first inferred to have existed until they are first found as fossils. Simulation built into the analysis tests analytical assumptions by repeatedly drawing samples of size n = 56 from B + C (or ETD) and counting the number of times all fall in C (or OTD) in 1000 trials (one sample is shown in simulation bar at bottom of figure). All samples drawn from B + C fell in C in 37 of 1000 simulation trials, which is close to the 50/1000 times expected with a critical likelihood l = 0.05.
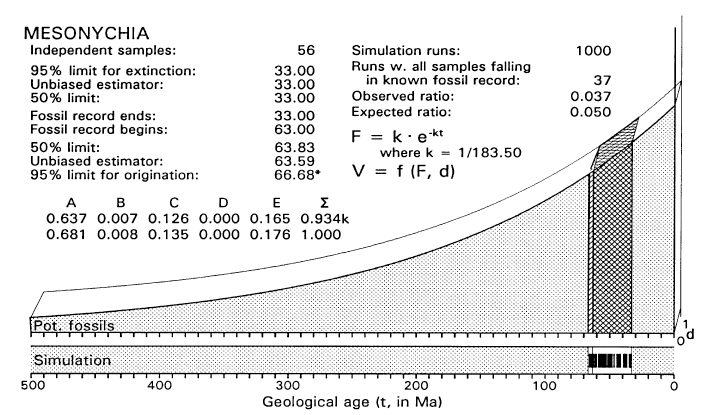
FIGURE 7. Likelihood function for the time of origin of Mesonychia, calculated as shown in Table 4 (but with a 0.0001 increment of origination volume). Note that maximum likelihood here (L = 1) corresponds to the time t = 63 Ma when the fossil record of Mesonychia begins. L = 0.05 (the critical likelihood l employed here) when t is about 66.7 Ma.
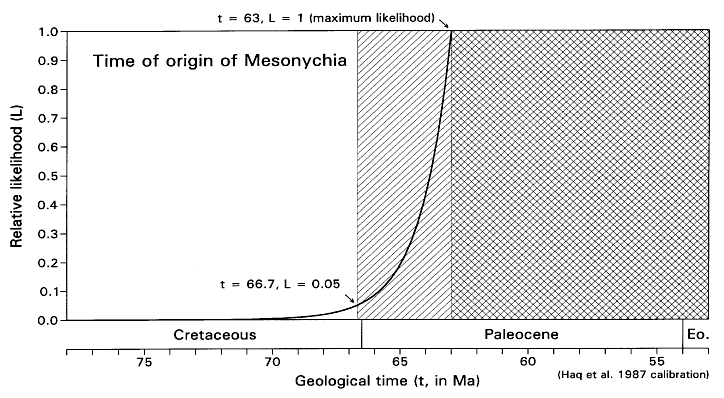
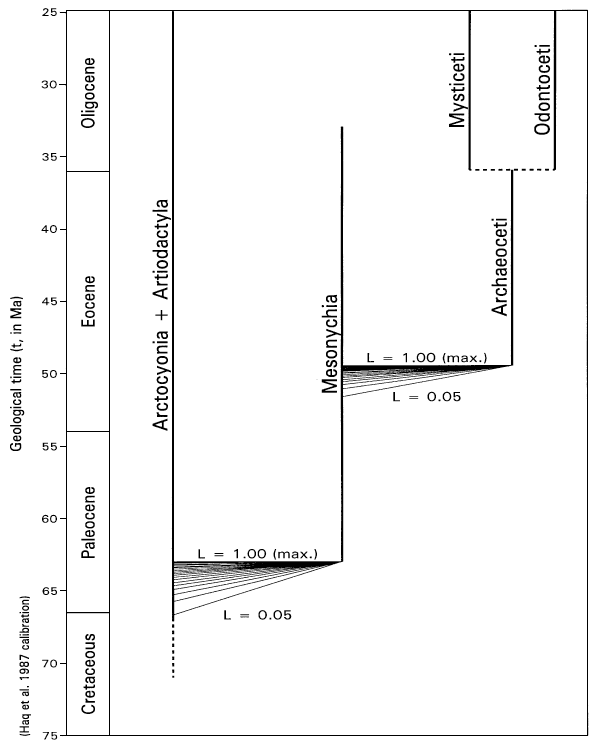
FIGURE 8. Range chart of Arctocyonia (extinct) + Artiodactyla (extant), Mesonychia (extinct), and Archaeoceti (extinct) + Mysticeti/Odontoceti (both extant). Spectra of reasonable likelihoods (0.05 less than or equal to L less than or equal to 1.00) for the time of origin of Mesonychia from Arctocyonia + Artiodactyla and the time of origin of Archaeoceti from Mesonychia, are shown in the context of condylarthran, artiodactyl, and cetacean phylogeny (phylogenetic relationships follow Van Valen 1966, 1971, 1978; Rose 1996; Geisler and O'Leary 1997; and others). From a paleontological point of view the origin of Cetacea is constrained by fossils to lie within the interval from 49.5 to about 51.6 Ma (early Eocene). From a neontological point of view the divergence time of Cetacea and Artiodactyla is constrained by fossils to lie within the interval from 63 to about 66.7 Ma (early Paleocene to latest Cretaceous).