

 Evolutionary modelling from family diversity
Article number: 2.2.11A
Copyright Palaeontological Association, 22 October 1999
https://doi.org/10.26879/99011
Author biographies
Plain-language and multi-lingual abstracts
PDF version
Submission: 18 July 1999. Acceptance: 19 August 1999
ABSTRACT
The Fossil Record 2 database of the times of first and last appearance of plant and animal families can be searched on the Internet. To demonstrate how these data can be used we have compared the output for mammals and angiosperms with plots from other databases. Interestingly, the same trends are also evident in these plots. We have also used this search facility to test the hypothesis that some groups of organisms diversify quickly and decline slowly. We propose a modified logistic curve to model the global trajectory of the diversification pattern that mimics a bell-shaped curve. The diversification pattern fluctuates around the global trajectory until its eventual extinction unless the organisms are exposed to a considerable amount of external perturbation. When the current global trajectory shows a clear downward trend the final extinction date of the group of organisms can be predicted assuming there are no large external perturbations in the future. However, the diversity curve from North American Pleistocene mammal data suggests that a mass extinction caused by human perturbation has already begun.
Michael C. Boulter. Palaeobiology Research Unit, University of East London, Romford Road, London E15 4LZ, UK. M.C.Boulter@uel.ac.uk
Dilshat Hewzulla. Palaeobiology Research Unit, University of East London, Romford Road, London E15 4LZ, UK. dilshat@uel.ac.uk
KEY WORDS: evolution, origination, extinction, diversity, fossil record, database, modelling, interactive searching
Final citation: Boulter, Michael C. and Hewzulla, Dilshat. 1999. Evolutionary modelling from family diversity. Palaeontologia Electronica, 2.2.11, 23 pp. https://doi.org/10.26879/99011
https://palaeo-electronica.org/content/2-2-model
Copyright: October 1999 Palaeontological Association.
This is an open access article distributed under the terms of Attribution-NonCommercial-ShareAlike 4.0 International (CC BY-NC-SA 4.0), which permits users to copy and redistribute the material in any medium or format, provided it is not used for commercial purposes and the original author and source are credited, with indications if any changes are made.
creativecommons.org/licenses/by-nc-sa/4.0/
INTRODUCTION
Of late there are several newly compiled databases giving the stratigraphic ranges of extinct and surviving groups being made available on the Internet. The most comprehensive of these is The Fossil Record 2 (Benton 1993) for which experts in each phylum of animals and plants estimate the time of first and last appearance of a total of 7,186 families. Although this database is a great advance over the first version (published 25 years earlier), there remains substantial distrust of some of its content. This uncertainty has impeded the development of reliable mathematical models describing the diversification of these organismal groups. As long as these data depend on the fossil record no diversification model can be believed to be absolutely correct; there may always be the possibility that some maxima or minima are artifacts of uneven fossilisation processes, the effects of an incomplete record, or human errors in collecting the data, identifications, and database construction. Nevertheless, the well-established theory of punctuated equilibrium (Eldredge and Gould 1972) and the familiar family diversity curve (Sepkoski 1984) are relied upon by many evolutionary biologists. Their favoured step-wise model of diversification has been supported recently by Courtillot and Gardemar (1996), but our own analyses give a very different interpretation (Hewzulla et al 1999).
Despite the effect of these well-known aspects of the fossil record, diversification patterns may gain more confidence by comparison with different sources of evidence, such as geology and molecular biology. For example, if some maxima or minima coincide with the times of continent collisions such patterns may more closely reflect the actual process of biological diversification. The first part of this study was undertaken in order to examine the effect of interdatabase comparisons in estimating the accuracy of patterns generated from databased fossil stratigraphical ranges. Because there are so many of these now available on the world wide web (WWW), we present a technique that enables any user to interact with a web-based database and have complete choice in selecting different kinds of data to produce different diversity curves. If you have a Java-enabled browser, you can make visual comparisons of whatever you choose from The Fossil Record 2 database.
Our investigation then goes on to present a mathematical model based on the assumption that the diversification pattern of any organismal group fluctuates around a global trajectory defined by the Nee and May (1997) mathematical model so long as it has not been exposed to strong external environmental perturbations. The Nee and May model is a modified logistic model that includes a factor controlling the global extinction of the constituent group; in other words, based on the assumption that every organismal group--whether it is a species, family or order--will eventually become extinct, regardless of the diversification rate. Although we accept that the parameters of such a model may vary according to uncertainties in the fossil record of a group, our trials show that the predicted bell-shape the diversification pattern does stay relatively stable.
SEARCHING AND PRESENTING THE FAMILY DATA
This article uses the special facilities of electronic publishing to link relevant database searches and analyses so that readers can examine and manipulate data on their own screens. Interested users can include as much of the data as they need in their own analyses and may easily download and manipulate far more data than are presented here. This is done through links in the text to include times of first and last appearance of all the taxa listed in The Fossil Record 2 from named environments: marine, brackish, freshwater, terrestrial, lagoonal, volant, and littoral.
These data are organized in the different ranks of taxa, habitats, and stratigraphic ranges in which the species composing the families lived, originated, and became extinct. Users can search from lists within kingdom, habitat, age, chapter number and other classifications within The Fossil Record 2. They may also plot various patterns within any of these levels, selecting the maximum or minimum extent for each family range (e.g., The Fossil Record 2, uncertainty about the reliable range is available and is shown in the retrieved data).
However, it is important to consider very carefully which rank of taxa you select for such curves because different kinds of organisms diversify at different rates and over differing scales of morphological complexity. There is also considerable variation in the taxonomic judgements of different specialists, and in how to define the level of each hierarchy from the different cultures between, say, botanists and zoologists. Even if we limit the comparison to similar habitats there are substantial differences of scale and judgement.
There is another important set of factors that may influence these kinds of results: whether family data are a good proxy for diversity at the species level. Families originate and disappear only by virtue of the origination and extinction of their first and last constituent species. Do data categorised at other taxonomic levels give similar trends? There are several dangers here, not least those concerning which taxonomic hierarchy is to be searched. Left alone, these Fossil Record 2 searches may turn this into a tautology, but the advent of molecular and morphological cladistics of modern organisms may help break that circle for groups with modern representatives. Such problems also call into question the identification of an extinction event. Is it an artifact of classification? Because of these problems, this article is offered with words of extreme caution about how you use the fossil record and our database, some aspects of which have recently been debated on the Nature website.
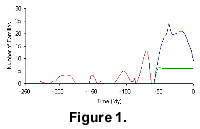 To introduce a little of what can be done easily, the results from three searches are plotted in Figure 1, showing the number of extinctions, and the family diversifications of different groups. The red line shows the record of saurischian dinosaur family extinctions. The blue line shows the family diversity of the Artiodactyla. The green line shows a diversity record for the grass-like families of the monocotyledon Commelinales (after "The Thorne System" in Brummitt 1992). When you have created each of these curves by clicking on the links, you can plot them together on one screen by pressing the "Add previous data" button.
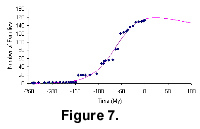
Several features emerge when the diversity curves are examined and compared to one another and to other trends. For example, not of least significance is that total mammal family diversity reached a maximum (172 families) at the middle Miocene and that the group has shown a mean trend toward extinction since then. There is another peak, comprising 148 families, at the approximate time of the Eocene-Oligocene boundary, but the stratigraphic scales used in this database are not accurate enough to make definite correlations with La Grande Coupure in Europe (Pomerol 1973) or the time interval when plants show maximum warmth in the London and Paris basins. Even then, the global ranges of The Fossil Record 2 are difficult to compare with these regional features. The plant family data show a different reaction from the Early Eocene to the present. Their number stays constant or continues to increase, albeit at a reducing rate. This can be seen in Figure 7 from the total plant family diversity plot in The Fossil Record 2. A number of mammal orders show peaks of family diversity around the Eocene--Oligocene boundary (e.g., Soricomorpha, Rodentia, Primates, Artiodactyla and Proboscidea). It is not our purpose here to give detailed interpretations of these interactions, but rather, to demonstrate the tools we have created that enable users to search different aspects of The Fossil Record 2 database for taxa of their choice.
One of our early objectives in planning this method of analysis was to compare the rates and times of diversification of plants and animals. The sheer quantity of data available and the many tens of thousands of curves that can be created for such comparisons overwhelmed us. By providing these tools to the palaeontological community our original objective can now be accomplished in principle, by allowing palaeontologists with different interests to compare taxa across their whole range of interests in systematics, ecology, and stratigraphy.
MATHEMATICAL MODELLING OF THE DIVERSIFICATION PATTERNS
Since the first organism appeared on Earth, life has diversified massively. Despite the different levels of fluctuations on different timescales, global diversity has increased exponentially on the macro-level (e.g., Hewzulla et al. 1999). However, this process is driven by extinction as well as by origination. Here we discuss the diversification patterns of individual groups to compare to our recent synoptic analysis of all terrestrial and marine data (Hewzulla et al. 1999). The logistic model is a widely accepted way to incorporate both exponential growth and the factor that limits the maximum growth allowed by the system. However, the logistic model still fails to explain how a particular group of organisms diversifies and eventually declines. Clearly the simple exponential model is no longer applicable at this level, otherwise no group would ever be driven to extinction.
The fact that old groups become extinct and new ones originate yields a more unstable sense of change. May and Lawton (1995) have suggested that the average life-span of a single species can be calculated using origination and extinction dates by assuming that a species has a higher risk of becoming extinct when its life span exceeds an average value. We have extended this idea to higher levels of classification, leading to the hypothesis that most organismal groups have a limited life-span at the macroevolutionary level. Under this model even the most successful groups may be destined to become extinct.
Our theoretical model is based on the observation that many families diversify according to such a distribution, diversifying relatively slowly at first and then radiating more quickly, reaching a maximum level over varying lengths of time, and becoming extinct slowly over longer periods of time (unless some environmental crisis disrupts the pattern). Nee and May (1997) have given a mathematical explanation of how an ecological community tends to preserve its tree structure over the loss of its member species that increases the chances of recovery after the extinction event. That can explain the slow decrease in the diversity of a group of organism during its final extinction. This supports our hypothesis that evolutionary changes in taxonomic groups resemble bell-shaped curves, with protracted origins prior to radiation and a long demise. Hence, we use a modified version of the logistic model to represent the bell-shaped diversification curves and test the hypothesis using the data from The Fossil Record 2:
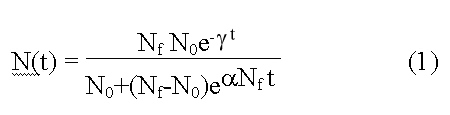
Where: N(t) = is the estimated diversity at time.
N0 is diversity at t=0, determined by the initial state of the model. Nf is called niche capacity that corresponds to the equilibrium diversity when γ = 0.0. γ is the extinction factor that determines how and when the extinction takes place. The higher the γ value, the stronger the suppression imposed onto the increase of diversity at the earlier stage, and the quicker the decrease of the diversity at the later stage. The α is the origination factor that tends to increase diversity. The model incorporates both the exponential and the logistical interpretation of evolutionary change. When γ = 0 it becomes a logistic model. The lower part of the logistic model approaches the exponential curve when Nf is very large.
According to our model, and according to common sense, a group reaches its peak and inevitably declines to extinction. However, apart from this deterministic component, an actual diversification process comprises indeterministic fluctuations that are caused both by internal dynamics and external perturbations (e.g., the effects of asteroids, continental movements, Hewzulla et al. 1999). The actual diversification pattern fluctuates around the trajectory determined by the analytic model. Therefore, the attainment of a local peak does not necessarily mean that the model will decline afterwards to extinction. When a local peak is reached, there is no way of telling whether further changes will lead to extinction or rise again to another local peak. In most cases, we will not know whether these fluctuations are caused by internal dynamics of the system or external perturbations. However, when there is a sudden large deviation from the model it is more likely caused by external (= environmental) factors.
Below we apply our mathematical model to the data and calculate the best-fit parameters in order to try to reveal a global trend that filters out the local fluctuations. When the global trajectory shows a clear downward trend to the present, we calculate the future extinction date of the group of organisms. However, in some cases the pattern does not show a clear global downward trend and, in these cases, the data are not sufficient to calculate the parameter that determines the group's extinction.
SOME EXAMPLE DIVERSITY CHANGES
As an example of the application of such a model, we have applied it to groups of dinosaurs, mammals, and angiosperms. A detailed theoretical discussion of sources of bias in these data is beyond the purpose of this article. We know that filtering data and different classifications may affect the parameters of our model, but its overall properties still stand.
When calculating the parameters of our mathematical model for a particular group of organisms we always start from the date of the first record in that group as t=0, so that the parameters of the various groups of organisms can be compared with each other and the behaviour of the model analysed more easily.
 Dinosaurs
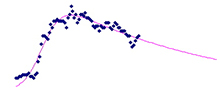
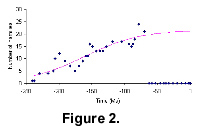
The diversification pattern of saurichian dinosaurs from The Fossil Record 2 and its fit to our model are shown in Figure 2. The earliest record is dated at 240 million years ago. We can see from the figure that saurichian dinosaur families diversified and became extinct suddenly about 65 million years ago. The fact that the global trajectory curve from the dinosaur data deviates suddenly from the model and becomes extinct suggests influence by external factors. Without that catastrophic event, saurichian dinosaurs may have continued well into the Cenozoic. We can see from the figure that the global trajectory did not show a downward trend at the mass-extinction event. This means that the data are insufficient to calculate the parameter γ (which indicates how fast the extinction would have taken place under normal circumstances).
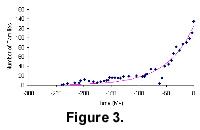 It is interesting to consider the families assigned in The Fossil Record 2 to the dinosaur group and those assigned to the birds (Aves) as a single group to be analysed since it is commonly accepted that birds arose from within the saurichian clade. Figure 3 shows that although the Saurichia + Aves group did not become extinct during the K-T mass extinction, this event had a very deep effect on its diversification pattern. Group diversity quickly recovered from the mass-extinction minima, however, and has been restored to its previous trajectory. Actually, expansion after the K-T event is seen only from the birds' diversity, indicating that the birds may continue to diversify exponentially for some time in the future and that the current diversity may still represent the early part of their bell curve.
Mammals
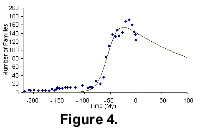 Figure 4 shows the diversification pattern of mammals from The Fossil Record 2 and its fit to the model. From Figure 4 we can see that the modern mammal groups show a clear downward trend. Based on data from The Fossil Record 2 and the modified logistic model the extinction of mammals can roughly as predicted to occur some 900 million years from now.
To test the validity of these results we have compared the output for mammals and angiosperms with plots from two other databases. One is of our family assignations of Tertiary mammals listed by John Alroy on his "North American Fossil Mammal Systematics Database" website. Our purpose in making this comparison is to see if these independently-compiled data show similar trends. Alroy’s website gives good interpretations of mammalian appearance events and discusses ways of correcting sampling bias. We can also see a global downward trend from the diversification pattern of North American mammals that are calculated from Alroy's data (see Figure 5). The earliest record is dated at 78 Ma. The projected intersection point with the time axis of the curve is approximately 360 million years in the future.
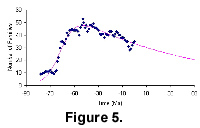 The North American Tertiary mammals curve shows a radiation after the K-T event and reaches a diversity peak around the time of the Eocene-Oligocene boundary. However, for North American mammals, family diversity starts to decline, from more than 50 just before the Oligocene to about 30 families by the end of the Tertiary.
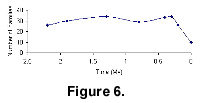 Another mammalian electronic database we have compiled is from the data in the appendix of Kurten and Anderson’s (1980) monograph of Pleistocene mammal species. The diversity curve for this dataset are shown in Figure 6. The curve of data from the Pleistocene shows a dramatic fall in the number of families beginning around 250,000 years ago. Debate will continue as to whether this decline was caused by climate change or by the intrusion of humans into the North American environment. However, there is no doubt that the last data point (the Recent) coincides, in a geological sense, with the industrial revolution and dramatic increases in the use of fossil fuels. This level is matched by the Kurten and Anderson data, further confirming some stability in the recognised fossil record. A number of mammal orders show family extinctions through the Pleistocene: Pilosa, Cingulata, Rodentia, Artiodactyla, Perissodactyla and Proboscidea. The Primates are the only group to show an increase over this same interval.
 Angiosperms
Figure 7 shows the diversification pattern of angiosperms from The Fossil Record 2. The angiosperm diversity curve shows that angiosperm families went through slow long-tailed initial diversification, and then a quicker exponential radiation. The rate of the diversification decreases towards the end of the curve. The intersection point of the global trajectory with the time axis is at around 3,000 million years from now. The earliest record is dated at 243.05 Ma (after The Fossil Record 2).
The angiosperm family diversity reaches a peak at the Eocene-Oligocene boundary, marking the end of the grand radiation of the group after the Cretaceous-Tertiary mass-extinction event. Although the rate of radiation falls dramatically, the level of diversity remains very high. So, unlike the mammals, angiosperm family diversity continues to increase through the Late Mesozoic and Cenozoic and there are no extinctions in the Pleistocene.
Agnatha and Cimolesta
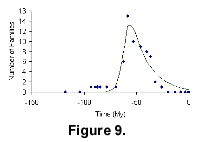
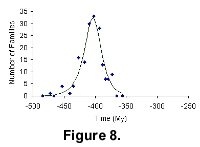 Our final examples showing bell-shaped diversity are from two extinct groups of animals, the Agnatha and the Cimolesta. We have chosen these because the full extent of their stratigraphic range is known. It is interesting that the much older group gives a more or less symmetrical bell curve, while the younger Cimolesta shows faster radiation than extinction.
The diversification of Agnatha and their fit to our mathematical model is shown in Figure 8. The earliest record is dated at 484.55 Ma; the youngest record is dated at 372.2 Ma.
The diversification pattern of Cimolesta and its fit to the mathematical model are shown in Figure 9. The earliest record is dated at 118.25 Ma, while the youngest record is dated at 19.8 Ma.
CONCLUSIONS
 For more than a quarter of a century Eldredge and Gould's (1972) theory of punctuated equilibrium has been admired by many evolutionary biologists. Further support has come recently from Coutillot and Gaudemer (1996) working with The Fossil Record 2 database. More recently, we (Hewzulla et al, 1999) have shown that an exponential increase with 1/f fluctuations in Family diversification, rather than a punctuated equilibrium, is more likely.
Our results presented here are from terrestrial groups as well as marine ones. We have based the equation for our model on the initial exponential rise of each Family (but not genus or species), which moves towards stabilisation at the equilibrium, and then go through slower decline to extinction. For most Families we have tested there is a final slower decrease to eventual extinction; of course, mass extinction events from outside the biological system interfere with the internal evolutionary changes.
We mean that the biological system of all life on our planet evolves from within itself. That is the basic driving force for evolution and it works at morphological and cellular levels. External environmental influences from ecosystems cloud the patterns from this process. Things like changing climate and the interactions between planets disturb the biological pattern. Ecological niches have limited space and energy; they have other influences on the very complex process of evolution. The effects of unexpected environmental noises like these are what Eldredge, Gould, Courtillot, Gaudemer and others perceive as coming from a punctuated equilibrium. We think they hide the primary changes which are derived from within the system.
ACKNOWLEDGEMENTS
We thank our placement student F.C. Popol for preparing the family assignations for Figure 4 and Figure 5, and D. Polly for discussions about the mammal curves. Three referees gave some very constructive comments and we thank them sincerely for their help in putting us on the right path.
REFERENCES
Benton, M. J. (ed.) 1993. The Fossil Record 2. Chapman and Hall, London.
Brummitt, R. K. 1992. Vascular Plant Families and Genera. Royal Botanic Gardens, Kew.
Courtillot, V., and Gaudemer, Y. 1996. Effects of mass extinctions on biodiversity. Nature 381, 146-148.
Eldredge, N., and Gould, S.J. 1972. Punctuated equilibria: an alternative to phyletic gradualism, p. 82-115. In Schopf , T. J. M (ed.), Models in Paleobiology. Freeman, San Francisco.
Hewzulla, D., Boulter, M. C., Benton, M. J., and Halley, J. M. 1999. Evolutionary patterns from mass originations and mass extinctions. Philosophical Transactions of the Royal Society B, 354, 463-469.
Kurten, B., and Anderson, E. 1980. Pleistocene Mammals of North America. Columbia University Press, New York.
May, R. M., and Lawton J. H. 1995. Assessing extinction rates, p. 1-24. In Lawton, J. H. and May, R. M. (eds.), Extinction Rates. Oxford University Press, Oxford..
Nee, S., and May, R. M. 1997. Extinction and the loss of evolutionary history. Science 278, 692-694.
Pomerol, C. 1973. Stratigraphie et Paléogéographie Ère Cénozoïque. Doin, Paris.
Sepkoski, J. J. 1984. A kinetic model of Phanerozoic taxonomic diversity. Paleobiology 10, 246-267.
