 Breaking free from the matrix: Segmentation of fossil images
Article number: 17.3.1T
https://doi.org/10.26879/441
Copyright Paleontological Society, December 2014
Author biographies
Plain-language and multi-lingual abstracts
PDF version
Submission: 16 November 2013. Acceptance: 5 December 2014
{flike id=1005}
ABSTRACT
The traditional method for separating a fossil from its matrix is to physically remove the matrix, risking damage to the fossil. Non-destructive technologies, such as computed tomography (CT) scanning, digitally remove the matrix. However, these techniques have multiple disadvantages: they are time consuming, involve highly skilled preparators or technicians, or require expensive equipment. Image segmentation, coupled with wavelet denoising, provides a rapid, inexpensive, and non-destructive way to digitally separate matrix from fossil in standard digital camera images. This method uses off-the-shelf software and produces results that can then be input into software for morphometric analysis or used to speed up more traditional segmentation techniques. A comparison of alternative methods for image segmentation and wavelet denoising indicate that Otsu’s method and other global thresholding techniques perform best for this purpose. This approach is illustrated here with images of Eucalyptocrinites holdfasts. The resulting images are used for morphometrics. These methods have great potential for studies that utilize the rapidly growing resource of online museum digital image catalogs.
Chris M.E. Honeycutt. Department of Laboratory Sciences, Jefferson Community College, 1220 Coffeen Street, Watertown, New York 13601, USA cebey@sunyjefferson.edu
Roy E. Plotnick. Department of Earth and Environmental Sciences, University of Illinois at Chicago, Science and Engineering South Building, (MC 186), 845 West Taylor Street, Chicago, Illinois 60607-7059, USA plotnick@uic.edu
Fabien Kenig. Department of Earth and Environmental Sciences, University of Illinois at Chicago, Science and Engineering South Building, (MC 186), 845 West Taylor Street, Chicago, Illinois 60607-7059, USA fkenig@uic.edu
Keywords: image; segmentation; wavelets; extraction; crinoid; holdfast
Final citation: Honeycutt, Chris M.E., Plotnick, Roy E., and Kenig, Fabien. 2014. Breaking free from the matrix: Segmentation of fossil images. Palaeontologia Electronica 17.3.1T: 1-18. https://doi.org/10.26879/441
palaeo-electronica.org/content/2014/1005-image-segmentation
INTRODUCTION
Qualitative and quantitative analyses of form that are fundamental to systematics, morphometrics, functional morphology, biostratigraphy, and the study of evolutionary trends (Webster and Sheets, 2010; Antcliffe and Brasier, 2011) usually require that specimens be separated in some way from their surrounding matrix. Until a few decades ago, mechanical extraction using tools to physically remove the matrix was the sole preferred method for separating specimens from surrounding sediment. This approach has many shortcomings, including that it is slow, requires highly trained preparators, and risks damaging the specimen (Sohl, 1989). Furthermore, in many cases, the matrix cannot be removed because it provides support for the specimen, which would otherwise disintegrate.
Since the 1990s, mechanical extraction has been supplanted in some applications by less destructive techniques such as digital laser scanning and computed tomography (CT) (Sutton, 2008; Knoll et al., 2012). Many of these techniques allow the matrix to remain physically intact and can produce a detailed three-dimensional (3-D) map of each fossil (Antcliffe and Brasier, 2011; Rayfield et al., 2000). However, these techniques also have shortcomings; they are expensive, require specialized equipment, and cannot be used for all specimens (Antcliffe and Brasier, 2011). For example, CT scans work by creating a map of density distribution by measuring the X-ray transmission through specimens. Thus, while CT scans work well if there is a significant difference in density between the matrix and the fossil, they work poorly on specimens where the fossil and matrix have a similar mineral composition and are similar densities (Abel et al., 2012).
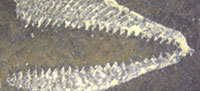
 As an example, a specimen of Eucalypocrinites holdfast from the Waldron Shale of Indiana was sent to University of Texas High-Resolution CT Facility to determine if the crinoid root system penetrated the exposed sediment. Unfortunately, the density of the calcite comprising the crinoid and the marl of the matrix were too similar for the technique to work. The result of the test scan was an attractive 3-D image (Figure 1) that added little to our knowledge of the detailed geometry of the specimen.
Matrices can also be removed from images of fossil samples. In the pre-digital age, parts of a photograph containing the fossil of interest were carefully cut out with a sharp knife for plates or masked during the production of the print (Palmer, 1965). Today photo editing software users construct masks with tools that allow them to define regions of interest (ROIs). The result is a two-dimensional image of the object without the matrix. This separation of foreground from background is called segmentation. For objects with complicated shapes, manual digital segmentation using image processing software remains painstaking and slow (Currano, 2013). It requires close attention to which parts of the image belong to the fossil and which to matrix.
The number of fossil images easily available for detailed analysis is rapidly increasing. Major natural history collections, such as the Yale Peabody Museum of Natural History, the Field Museum of Natural History, and the University of Colorado Museum of Natural History, are now creating searchable digital photo collections of paleontological specimens. Type specimens are also becoming increasingly available through online collections such as the GB3D Type Fossils Online project (www.3d-fossils.ac.uk/). These initiatives will provide a tremendous resource to future researchers, particularly if quantitative means of analyzing fossils via digital images becomes easier and less expensive. Online sources have also made available scanned images of fossils from publications dating back into the 19th century, although many of these images are of poor quality.
In this paper we explore methods for quantitative digital extraction and analysis of fossils that vastly simplify the process of isolating specimens from the matrix in images. The resulting processed images are readily available for analysis. This method relies on basic digital camera images and the off-the-shelf software such as MATLAB and R, which are widely available. We describe and test a range of advanced image segmentation techniques on images of crinoid holdfasts and discuss limitations of the present methods and future directions to improve results. These methods are able to distinguish fossil from matrix accurately. We then show how the product of these image processing techniques can be used in several applications, including morphometrics and improving plates scanned from legacy publications.
IMAGE SEGMENTATION: REVIEW AND CURRENT APPLICATIONS
A major goal of image analysis is to automatically group pixels into sets based on their properties, a procedure known as automatic segmentation, also sometimes referred to as unsupervised segmentation (e.g., Deng and Manjunath, 2001). This can be contrasted with manual segmentation, where a human user looks at the image and subjectively selects ROIs using tools such as the “magnetic lasso” in Adobe Photoshop™. Intermediate to automatic and manual segmentation is computer-aided segmentation, where the bulk of the work is done automatically but the results are monitored and adjusted by a user. Automatic segmentation is a rapidly developing method for identifying and isolating relevant information from color and grayscale images and for producing automatic classifications. Over the last 35 years, image segmentation has evolved from a sub-discipline of computer science to a technique widely used in medical imaging, automated object recognition, and remote sensing (Rangayyan and Ayres, 2006; Ilea and Whelan, 2011; Zheng et al., 2013).
Traffic enforcement by cameras is one current application of image segmentation. License plates of offenders are often identified using the image segmentation method connected component analysis (CC analysis), which distinguishes between pixels in the background and those belonging to the alphanumeric characters in the license plate (Anagnostopoulos et al., 2006; Zheng et al., 2013). The characters and the background are analogous to the fossil and the matrix, respectively.
There are several aspects of license plate images that make them ideal for simple, reliable automatic segmentation. First, the characters and background of a license are markedly different colors. Second, these characters have straight edges with clear boundaries. Third, in a well-illuminated setting there will be little color variation within a single license plate or among license plates from the same state. Fourth, the sets of pixels of the characters and the background are each homogeneous in their properties and thus can be easily distinguished and then classified. Finally, license plates do not have distracting clutter complicating the image (Wilson et al., 2007; Xie and Bovik, 2013; Poletti et al., 2012).
In contrast to license plates, paleontological photographs share many of the problems and technical difficulties encountered when analyzing complex natural images and biological objects in other disciplines, such as medical imaging (Ilea and Whelan, 2011; Xie and Bovik, 2013). The foreground fossils and background matrix are often of similar colors with low contrast. The borders of fossils in photographs are frequently fuzzy or irregularly shaped. Images of specimens may contain a great deal of color variation and shadows which complicate correct pixel classification. Shadows are a particular issue in specimens with relief. Finally, the images often have natural irregularities such as fragments from other fossils and anthropogenic irregularities such as scratches produced by preparation and variations in photographic technique. All of these factors make the image more complicated and difficult to segment.
However, new techniques for image segmentation developed for medical images, such as those of chromosomes and vascular networks (Lesage et al., 2009; Poletti et al., 2012), have been developed to address problems with biological objects. We will describe and compare a range of such image segmentation techniques and apply them to images of crinoid holdfasts.
SPECIMEN IMAGES
The Silurian camerate crinoid Eucalyptocrinites is a frequently cited example of an organism with a radix holdfast (Brett, 1981). Specimens of the isolated holdfasts of this genus from the Waldron Shale of Indiana are very common fossils in American museum collections. Photographs of these fossils were taken on-site at museums. The fossil holdfasts are generally exposed on the surface of the matrix and cannot be removed without destroying their structure, making quantitative analysis of the holdfast structure difficult.
 The Eucalyptocrinites root structures are highly variable in preserved morphology and display a wide range of curves, edges, and angles. The holdfast and matrix have similar colors and there is low contrast between them. The holdfast and surface matrix are usually uneven, producing subtle shadows and other inhomogeneities in photographic images. The images of these holdfasts, thus, exhibit many of the complexities that are generally observed in photographs of fossils and thus provide a good test case for the methods described here.
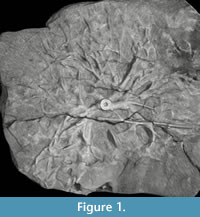
Representative unprocessed photographs of Eucalyptocrinites are shown in Figure 2 and Figure 3. Photographs were taken with a Canon PowerShot S3 IS digital camera. The camera effective pixels are approximately 6 million; images are approximately 2,000-3,000 pixels wide by 1,500 to 1,700 pixels high. The original images were saved in JPEG format to reduce file size. However, TIFF format is generally recommended when file size is not an issue and a researcher does not intend to manually preprocess the images. The images ranged from 150 to 200 PPCM (pixels per centimeter). Lighting was provided by oblique floodlights, adjusted to heighten relief.
METHODS USED IN DIGITAL EXTRACTION
 The key step in processing the original digital photographic image is thresholding, a group of methods of separating objects from their background. Before this can be performed, the image often needs to be prepared, a step referred to as preprocessing. This is akin to data transformations prior to multivariate statistical analyses. After thresholding, the segmented image can be further refined using postprocessing techniques (Figure 2). We will describe the thresholding step first, as this will make clear when and what types of pre- and postprocessing are necessary. Each of these steps is illustrated with the branch of the Eucalyptocrinites root in Figure 2.3. The Matlab code associated with segmentation of this image, as well as the original image (as a zipped Matlab MAT and M files), are available in the online supplement to this paper.
Segmenting an Image Using Thresholding
Properties of image pixels, such as grayscale intensity or color values, can be represented in a histogram. The histogram can be divided into sections that define pixel classes. These divisions are thresholds. For example, a single threshold value can be chosen that groups all pixels in the image by their grayscale values and separates them into two classes. Thresholding techniques range from simple to intricate and from fast to computationally intensive. They may include methods that employ artificial intelligence, neural networks and genetic algorithms (Wei and Xin, 2010; Davies, 2012). Thresholding can be very complex, depending on methods used to choose the thresholds and on whether the thresholding is applied to the entire image or to selected regions.
In this study we use Otsu’s method, the most widely employed variance-based automatic thresholding technique (Otsu, 1979). Variance-based approaches are particularly powerful when the pixels of interest (foreground) are relatively rare compared to pixels to be discarded (background), leading to a small peak associated with the foreground in the grayscale histogram. In variance methods, the intensity histogram is analyzed to find the natural groupings of all pixels. These groups are identified based on the ratios of the among-group variance, within group variance, and total variance of histogram values. Among group variance, within group variance and total variance are the same as the terms used in analysis of variance (ANOVA). However, unlike ANOVA, variance methods of thresholding attempt to identify natural groups of pixels rather than analyze predefined groups (Davies, 2012).
Otsu’s method groups pixels in grayscale images into classes based on thresholds. In the case of a single threshold, for example, it converts the image into a black-and-white image. It groups the pixels into two classes, foreground and background, and the optimal threshold ϕopt between the two groups is chosen to maximize the between-class variance of grayscale values (σ 2between). For multiple thresholds, Otsu’s method produces sets based on maximizing the among group variance σ2 among. Mathematical details on Otsu’s method can be found in Otsu (1979) and Honeycutt and Plotnick (2008).
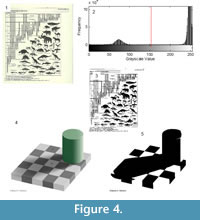 Otsu’s method performs best when there is a strong contrast between the foreground and background and there are no shadows (Figure 4). For example, when the yellowed pages of a book shown in Figure 4.1 are thresholded, the text and figures are clearly visible (Figure 4.1-3). In contrast, the presence of shadows introduces complications. In the artificial image in Figure 4.4, a shadow is cast by a cylinder onto a checkerboard. The light checks that lie within the shadow of the cylinder are actually of the same shade of gray as the dark checks outside the shadow. Despite this, because the human brain can correct for light and shading, people see a checkerboard pattern (Adelson, 1993, Davies, 2012). This phenomenon is known as the “checker shadow illusion.” However, Otsu’s method cannot distinguish between shadows and non-shadows, and in the resulting image the light square in the shadow are incorrectly classified as dark squares (Figure 4.4). Two images that appear similar in their histogram distributions thus may behave very differently using a single threshold for the entire image, otherwise known as global thresholding.
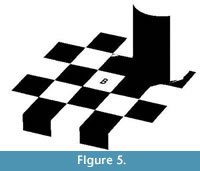 Problems of contrast introduced by shadows can be addressed by dividing the image into regions and identifying different thresholds for each region (Figure 5). This method of dividing the image into regions is called local thresholding. Local thresholding can solve many of the problems associated with global thresholding. For example, in the checker shadow illusion, black checks can be correctly identified as black by simply separating the image into two local regions (Figure 5).
One local thresholding method, adaptive thresholding (AdT), is a promising technique for paleontological images. The image is first divided into rectangular tiles ( tessellations ), and Otsu’s thresholding is then applied to each tile (Grisan et al., 2009; Poletti et al., 2012). In many types of complex images, AdT provides improved accuracy compared to global methods with a relatively low computation time (Poletti et al., 2012).
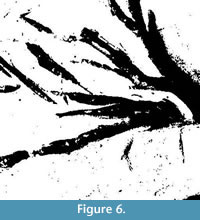
The effect of global thresholding on the image of a crinoid holdfast (Figure 2.2), without any other pre- or postprocessing methods, can be seen in Figure 6. The crinoid root is largely identified but there is a great deal of noise within the image.
 Pre-Processing: Denoising Images Using Wavelets
Many images have extraneous noise and other small irregularities, such as light and dark spots, that will result in incorrect pixel classification during thresholding. For example, the small specks of black on white and blurred edges result from pixels classified due to their grayscale value. Most of these irregularities can be removed before thresholding by denoising the image, a preprocessing technique. One powerful method for denoising images uses discrete wavelet transforms (DWTs).
Most natural images exhibit certain scale-dependent properties. Big objects tend to have similar colors or tone over a large area. These large-scale features are punctuated by smaller scale discontinuities, such as points or edges. In most natural images, both large and small-scale features are not repeating or symmetrical; i.e., their properties are not well-represented by sinusoidal functions.
Wavelets are a family of bounded waveforms that are well suited for transforming and filtering such non-repeating, non-symmetrical data (Daubechies, 1992; Salomon, 2006). Unlike sine waves, wavelets do not repeat endlessly but are finite in extent; it is this feature that gave wavelets their name, which means “little wave.” 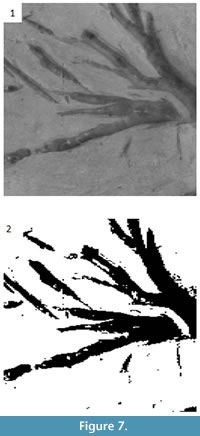 Wavelets can also be readily rescaled while retaining their shape. Wavelets can therefore approximate the form of small to large features. A third property of wavelets is that they form an orthonormal basis. Because of this property, when a wavelet is used to transform data it preserves the information perfectly: the coefficients of the transformed dataset (often called the decomposition ) and the corresponding wavelet matrix can be used to restore the original data set. This is not always true of transforms that use sinusoidal functions, such as those used in Fourier transforms. By changing the coefficients of the decomposition, such as setting them to zero, we can change the properties of the restored data. Note that there are an infinite number of possible wavelets; in this study we used the Haar wavelet, which due to its shape and simplicity is ideal for rapidly transforming images (Papadakis et al., 1999; Porwik and Lisowska, 2004; Buades et al., 2005).
Because of the way in which a discrete wavelet matrix transforms a signal, the decomposition is organized by scale or “levels.” The first level represents the largest scale and coarsest resolutions, the second the next smallest and so on. Each level has half the scale and twice the resolution as the previous level, a method known as dyadic downsampling. For an M-by-M image, such as in our example, maximum downsampling results in N levels, where N is equal to log2(M) (Daubechies, 1992). Noise in the data will usually occur only at the smallest scales and thus will be present in very high levels of the decomposition. We can remove noise therefore, by setting the coefficients in those levels of the decomposition to zero and then reconstructing the signal; this method is known as wavelet shrinkage (Graps, 1995; Buades et al., 2005). The effects of denoising on the tile of the crinoid branch can be seen in Figure 6, where the original image has been denoised (Figure 7.1). However, the effects of denoising are most noticeable after thresholding (Figure 7.2).
Post-Processing: Connected Component Analysis and Binary Image Morphology
Once the image is segmented, it can be further improved using connected component (CC) analysis and binary image morphology (Davies, 2012). Both CC analysis and binary image morphology are methods applied to a binary (black and white) image. Thus, these methods are useful after segmentation.
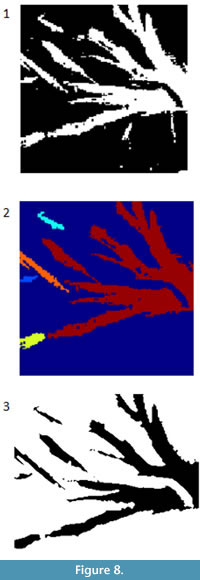 A connected component in a binary image is a cluster of pixels of the same value that are adjacent to one another but are separated from other clusters of pixels. The segmented image derived from the image shown in Figure 2 consists of multiple white patches (Figure 8.1). These white patches can be labeled and treated separately. For example the false color image in Figure 8.2 shows the five largest connected components. Statistics on the connected components can allow the user to identify and remove large groups of pixels. For example, small dots or long, irregular shapes may show up from processing. CC analysis allows the user to identify those objects and potentially remove them. This process can be done interactively or automatically.
Even after the removal of unwanted objects by CC analysis, the remaining objects may have unattractive and unrealistic features such as rough edges. Binary image morphology can be used to smooth the edges of the objects. Binary image morphologies modify the shapes in the image using morphological operators employing the logical operators NOT, AND, and OR on local pixel groups (Bovik, 2009; Davies, 2012). In a manner similar to wavelets, morphological operators operate on a local basis by using windows that can take on a variety of shapes, such as a straight line, a cross, a square or a circle (Bovik, 2009).
The effects of post-processing on the tile can be seen in Figure 8. First, CC analysis is used to remove the artifacts that can be identified by their connected components statistics (Figure 9.1). Next, binary image morphology is used to smooth the edges of the segmented image (Figure 9.2), which results in the final segmented image. This segmented image can be used as a binary mask and additional binary morphological techniques applied to create an outline of the segmented image on the original image (Figure 9.3).
Methods of Analyzing Results
As discussed above, there are many options and potential combinations of techniques available for image segmentation. Our objective here is to not only present successfully segmented images but also to provide an overview of multiple techniques and determine which are most applicable to image segmentation of fossil photographs. Following Poletti et al. (2012), we compared the results of multiple thresholding techniques. We compared segmenting techniques using standard parameters of image analysis. Image quality parameters are all based on the same concept: how well a completely automatic classification of pixels as foreground and background compares to the way a human would classify the image pixels. To do this, the image is manually segmented. The manually segmented image is referred to as the ground truth image. The ground truth image is then compared to a version that was preprocessed, segmented, and postprocessed by computer. The two images are then statistically compared (Baldi et al., 2000). 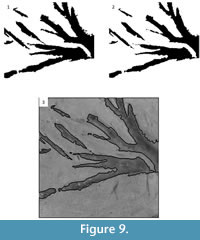 Here we have chosen the two most reliable parameters: accuracy and the Matthews correlation coefficient (MCC). Accuracy is the number of correctly classified pixels over the total number of pixels. Thus, accuracy can be simply seen as the percent of pixels correctly identified by the program (Poletti et al., 2012). Accuracy is thus an intuitive measure of the quality of the segmentation. MCC has been found to most closely correlate to how a human would describe the quality of the segmentation. Compared to other parameters it is less likely to give a counterintuitive answer. For example, the accuracy can be relatively high, but due to blurriness or a great deal of scatter, the image would appear low quality to a human. Thus, MCC is becoming increasingly common in the evaluation of segmentation techniques (Matthews, 1975; Baldi et al., 2000).
Poletti et al. (2012) observed that the local thresholding method AdT using Otsu’s variance-based thresholding method produced the most reliable results. Here we also use AdT as our global method, but to expand on the work of Poletti et al. (2012) we have also considered the potential impact of wavelet denoising as a pre-step and used CCA to separate objects related to the crinoids from other objects in the image.
We used these metrics to compare among different options used for pre-processing, segmentation, and post-processing. For pre-processing, we compared removing scales of noise by changing the wavelet decomposition used. For thresholding, we compared AdT and global applications of Otsu’s method. Our test image is the crinoid shown in Figure 2.1. The ground truth image was generated from this one by hand, using the selection tools in ImageJ.
RESULTS
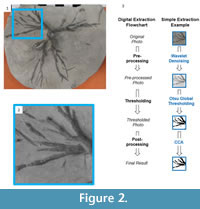
Sections of the images of the root systems, like those shown in Figure 2.1 were processed using wavelet denoising, global thresholding, CC analysis, and binary image morphology. In these cases, computer-aided classification worked very well in producing clean final images (Figure 3.1-2). Generating the best final result for each image, however, even those from the same root system, often required different choices of parameters. This was particularly true for the post-processing stage. This high degree of regional variability and supervision makes most specimens complicated to work with.
This limitation became clearer when we attempted to analyze entire images at one time using a single set of parameters. Different regions of the original images (Figure 2) responded differently to the thresholding producing major artifacts in the analyses. These issues are shown clearly in Table 1, where accuracy and MCC values are low, for both global and local methods.
Because a smaller region generated a better result than global segmentation, we applied AdT to see if local thresholding produced a better result. The performance of AdT on the grayscale image was extremely poor. While other studies have found local thresholding far more successful than global thresholding (Grisan et al., 2009; Poletti et al., 2012), in the case of crinoid images local thresholding resulted in an image with more noise than signal.
DISCUSSION
Computer-Aided Segmentation versus Automatic Segmentation
The purpose of any tool is to complete tasks with greater speed, accuracy, and efficiency. Completely automatic segmentation can produce relatively high quality results with minimal user input, if the inputs are high quality images with minimal imperfections, such as pronounced shadows, scratches, variations in mineralogy, or the presence of debris. However, none of the photos used in this paper were originally taken with the intent to subsequently segment the images. Pictures were taken to produce images that clearly showed the fossils. These photos emphasized enhancing relief, which produced shadows that unfortunately make them difficult to segment. Automatic segmentation worked well with relatively homogeneous portions of these images, but performed poorly when applied to the entire image. Here we present a modified form of the segmentation methods discussed above that can be applied to imperfect images.
Holdfasts in printed photos were outlined in red by hand and then re-scanned. These re-scanned images were then processed using automatic segmentation. While not fully automated, this method vastly reduced the time required to segment the image, from hours to a few minutes and produced a very accurate result (Table 1). Although automatic segmentation is ultimately the goal of segmentation, this practical technique is useful for speeding up and simplifying a variety of analysis tasks.
Applications to Morphometrics
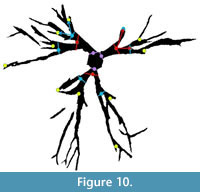 By saving the images as a Matlab variable, segmented images can be used in theoretical morphologic simulations, such as branching (McGhee, 1999), or in biomechanical models, such as finite element analysis. Quantitative comparisons between biomechanical models and large numbers of specimens can be made. While a thorough quantitative analysis of holdfast morphology is outside the main scope of this paper, we present a preliminary analysis of the specimens shown in Figure 2.1 to demonstrate the potential applications of our technique to morphometrics. Following Webster and Sheets (2010), we have selected topologically relevant and replicable loci on each specimen, in this case the two initial branching points of the crinoid holdfast roots (Figure 10).
 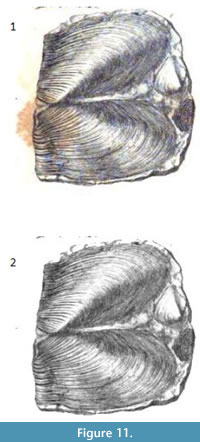 These points are not homologous, so we did not use geometric morphometrics. We have grouped our branching lateral roots into orders following the literature of binary branching tree systems, such as tree branches or the dendrites of neurons (e.g., Solar and Štampar, 2003; Rosso et al., 2004). Roots connected to the central stem are order 1, while the first roots branching from the order 1 roots are order 2, and so on.
We then have calculated five parameters for each order: the length of root branch, the width of the root branch, the distance of the nodes from the center, the angle of branches originating from each node; and the area of the branches (Figure 9). Although a sample set of four crinoids holdfasts is too small to make any broad statements about Eucalyptocrinites holdfast morphology in general, some patterns arise among all four specimens (Table 2). Branch width, area, and branching angle all decline substantially between first and second order root branches. This small subset suggests that there is possibly a correlation between root branch order and root thickness similar to that observed in the plate root systems of trees (Ennos, 1993).
Preparing Images from Legacy Publications
Scanned images of older journals and monographs are increasingly available online. The original copies of plates in these legacy publications may have suffered degradation over time, especially if acid paper was used. In addition, the scans may be of variable quality. The methods described in this paper have the potential to improve and repair these figures.
As an example, simple segmentation without additional processing was applied to an image from Murchison (1839). As is often the case with older books the original plate (Figure 11.1) is marred by reddish brown splotches (“foxing”). Thresholding was used on the green portion of the original RGB image to create a clipping mask. The clipping mask was then used to produce the results in Figure 11.2. The stains are not visible anymore and the remainder of image is unchanged.
CONCLUSIONS
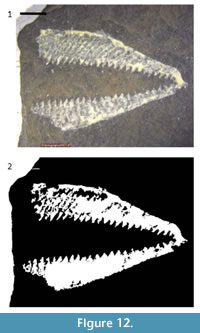
Standard digital images of specimens can be processed, using off-the-shelf software, to separate fossils from their surrounding matrix. For some images, such as scanned figures from legacy publications, segmentation can be a simple, powerful tool for correcting imperfections. This technique is relatively simple, inexpensive, and nondestructive. Such “virtual preparation” has tremendous potential for preparing images for subsequent analysis; the methods described here can be adapted relatively easily for other specimens. For example, the graptolite rhabdosome in Figure 12.1 was segmented using the same series of methods as for the crinoid branch with only two major differences. First, a larger number of objects have been retained after CC analysis in the graptolite rhabdosome image than in the crinoid branch image. Second, the graptolite image required fewer binary image morphology operations, particularly erosion. Thus, these methods may have great utility in the study of a variety of fossil images, including micropaleontology, compression fossils, such as the leaves used in the study of insect herbivory (Currano, 2013).
 However, like medical imaging, on which it is based, fully automatic segmentation of fossil images requires further development. In more complex real images, such as those of fossils with notable relief, relying on automatic segmentation alone will frequently result in poor output images with high levels of noise. Pre- and post-processing techniques can minimize noise, but the most reliable results are obtained by combining traditional manual and computer segmentation methods.
While small, clear images such as the crinoid branch in Figure 2.2 can be segmented relatively easily using completely automatic classification, like landmark based morphometric analysis (Webster and Sheets, 2010), most complicated images require a mix of automatic preprocessing and segmentation. Future research will help identify the strengths and weaknesses of supervised preprocessing, particularly preprocessing by student researchers.
Other avenues of future research include applications of segmented images to biomechanical problems through computer modelling. One possible avenue for modelling crinoid biomechanics is through Finite Element Analysis (FEA). FEA is a computer model of a design that is stressed and analyzed for responses to stress. A system of nodes is used to create a grid system known as a mesh. The mesh is programmed to contain structural properties which will react to different loads. FEA would allow a researcher to take the 2-D segmented image of the crinoid and approximate its 3-D structure, thus many of the advantages of a 3-D structure that is provided by a CT scan. By generating a precise map of the crinoid holdfast, it is therefore potentially possible to model its responses to bending and other stresses using FEA. Beyond the applications to crinoids, image segmentation may prove an important step in the process for functional analysis through computer modelling.
The recent interest in building searchable databases of paleontological images suggests that there is a need to identify photographic techniques that can aid in producing images that are easily segmented. Metrics should be developed that will help a photographer identify whether or not an image can be easily segmented and used in further studies. Libraries of easily segmented, and thus easily analyzed, paleontological images would have great potential for a wide range of studies, such as analyses of morphological disparity.
ACKNOWLEDGEMENTS
We thank B. Hunda at Cincinnati Museum Center, M. Florence and F. Marsh at the National Museum of Natural History and P. Mayer at the Field Museum of Natural History for giving access to the collections. We would also like to thank the thoughtful and insightful comments provided by the two anonymous reviewers. This material is based upon work supported by the National Science Foundation under EAR 0921771 to Plotnick as well as EAR-0646848 to the University of Texas High-Resolution CT Facility.
REFERENCES
Abel, R.L., Laurini, C.R., and Richter, M. 2012. A palaeobiologist’s guide to ‘virtual’ micro-CT preparation. Palaeontologia Electronica 15.2.6T:17pp, palaeo-electronica.org/content/issue-2-2012-technical-articles/233-micro-ct-workflow
Adelson, E.H. 1993. Perceptual organization and the judgment of brightness. Science, 262:2042-2044.
Anagnostopoulos, C.N.E., Anagnostopoulos, I.E., Loumos, V., and Kayafas, E. 2006. A license plate-recognition algorithm for intelligent transportation system applications. IEEE Transactions on Intelligent Transportation Systems, 7:377-392.
Antcliffe, J.B. and Brasier, M.D. 2011. Fossils with little relief: using lasers to conserve, image and analyze the Ediacara biota, p. 223-240. In Laflamme, M., Schiffbauer, J.D., and Dornbos, S.Q. (eds.), Quantifying the Evolution of Early Life: Numerical Approaches to the Evaluation of Fossils and Ancient Ecosystems. Topics in Geobiology Volume 36. Springer, New York.
Baldi, P., Brunak, S., Chauvin, Y., Andersen, C.A., and Nielsen, H. 2000. Assessing the accuracy of prediction algorithms for classification: an overview. Bioinfomatics, 16:412-424.
Bovik, A. 2009. The Essential Guide to Image Processing. Elsevier, Burlington, Massachusetts.
Brett, C. E. 1981. Terminology and functional-morphology of attachment structures in pelmatozoan echinoderms. Lethaia, 14:343-370.
Buades, A., Coll, B., and Morel, J.M. 2005. A review of image denoising algorithms, with a new one. Multiscale Modeling & Simulation, 4:490-530.
Currano, E.D. 2013. Ancient bug bites on ancient plants record forest ecosystem response to environmental perturbations, p. 157-174. In Bush, A.M., Pruss, S.B., and Payne, J.L. (eds.), Ecosystem Paleobiology and Geobiology. The Paleontological Society Papers, 19. The Paleontological Society, Boulder, Colorado.
Daubechies, I. 1992. Ten lectures on wavelets, Philadelphia: Society for Industrial and Applied Mathematics. 61
Davies, R. 2012. Computer and Machine Vision: Theory, Algorithms, Practicalities (fourth edition). Academic Press, Waltham.
Deng, Y. and Manjunath, B.S. 2001. Unsupervised segmentation of color-texture regions in images and video. Pattern Analysis and Machine Intelligence, IEEE Transactions, 23:800-810.
Ennos, A.R. 1993. The scaling of root anchorage. Journal of Theoretical Biology, 161:61-75.
Graps, A. 1995. An introduction to wavelets. Computational Science & Engineering, IEEE. 2:50-61.
Grisan, E., Poletti, E., and Ruggeri, A. 2009. Automatic segmentation and disentangling of chromosomes in Q-band prometaphase images. IEEE Transactions on Information Technology in Biomedicine: A Publication of the IEEE Engineering in Medicine and Biology Society, 13:575-581.
Honeycutt, C.E. and Plotnick, R. 2008. Image analysis techniques and gray-level co-occurrence matrices (GLCM) for calculating bioturbation indices and characterizing biogenic sedimentary structures. Computers & Geosciences, 34:1461-1472.
Ilea, D.E. and Whelan, P.F. 2011. Image segmentation based on the integration of colour-texture descriptors--A review. Pattern Recognition, 44:2479-2501.
Knoll, F., Witmer, L.M., Ortega, F., Ridgely, R.C., and Schwarz-Wings, D. 2012. The braincase of the basal sauropod dinosaur spinophorosaurus and 3D reconstructions of the cranial endocast and inner ear. PLOS One, 7:e30060. doi:10.1371/journal.pone.0030060
Lesage, D., Angelini, E.D., Bloch, I., and Funka-Lea, G. 2009. A review of 3D vessel lumen segmentation techniques: Models, features and extraction schemes. Medical Image Analysis, 13:819-845.
Matthews, B.W. 1975. Comparison of the predicted and observed secondary structure of T4 phage lysozyme. Biochimica et Biophysica Acta, 405:442-451.
McGhee, G.R.J., 1999. Theoretical Morphology, The Concept and its Applications. Columbia University Press, New York.
Murchison, R.I. 1839. The Silurian System, Founded on Geological Researches. Richard and John E. Taylor, London, England.
Otsu, N. 1979. A threshold selection method from gray-level histograms. IEEE Transactions of Systems, Man, and Cybernetics, 9:62-66.
Palmer, A.R. 1965. Preparation of plates for paleontologic publication, p.456-459. In Kummel, B. and Raup, D. (eds.), Handbook of Paleontological Techniques. W.H. Freeman and Company, San Francisco.
Papadakis, M., Šikić, H., and Weiss, G. 1999. The characterization of low pass filters and some basic properties of wavelets, scaling functions and related concepts. Journal of Fourier Analysis and Applications, 5:495-521.
Poletti, E., Zappelli, F., Ruggeri, A., and Grisan, E. 2012. A review of thresholding strategies applied to human chromosome segmentation. Computer Methods and Programs in Biomedicine, 108:679-688.
Porwik, P. and Lisowska, A. 2004. The Haar-wavelet transform in digital image processing: its status and achievements. Machine Graphics and Vision, 13:79-98.
Rangayyan, R.M. and Ayres, F.J. 2006. Gabor filters and phase portraits for the detection of architectural distortion in mammograms. Medical and Biological Engineering and Computing, 44:883-894.
Rayfield, E.J., Norman, D.B., Horner, C.C., Horner, J.R., Smith, P.M., Thomason, J.J., and Upchurch, P. 2000. Cranial design and function in a large theropod dinosaur. Nature, 409:1033-1037.
Rosso, S.B., Sussman, D., Wynshaw-Boris, A., and Salinas, P.C. 2004. Wnt signaling through Dishevelled, Rac and JNK regulates dendritic development. Nature Neuroscience, 8:34-42.
Salomon, D. 2006. Data Compression: The Complete Reference. (fourth edition). Springer-Verlag, London.
Sohl, N. 1989. Mechanical extraction of fossils: extraction by hammers, chisels, and picks, p. 204-207. In Feldmann, R.M., Chapman, R.E., and Hannibal, J.T. (eds.), Paleotechniques. The Paleontological Society Papers Volume 4. The Paleontological Society, Ithaca.
Solar, A. and Štampar, F. 2003. Genotypic differences in branching pattern and fruiting habit in common walnut (Juglans regia L.). Annals of Botany, 92:317-325.
Sutton, M.D. 2008. Tomographic techniques for the study of exceptionally preserved fossils. Proceedings of the Royal Society B: Biological Sciences, 275:1587-1593.
Webster, M. and Sheets, H.J. 2010. A practical introduction to landmark-based morphometrics, p. 163-188. In Alroy, J. and Hunt, G. (eds.), Quantitative Methods in Paleobiology. The Paleontological Society Papers Volume 16. The Paleontological Society, Ithaca.
Wei, W. and Xin, Y. 2010. Rapid, man-made object morphological segmentation for aerial images using a multi-scaled, geometric image analysis. Image and Vision Computing, 28:626-633.
Wilson, J.N., Gader, P., Wen-Hsiung, L., Frigui, H., and Ho, K.C. 2007. A large-scale systematic evaluation of algorithms using ground-penetrating radar for landmine detection and discrimination. IEEE Transactions on Geoscience and Remote Sensing, 45:2560-2572.
Xie, F. and Bovik, A.C. 2013. Automatic segmentation of dermoscopy images using self-generating neural networks seeded by genetic algorithm. Pattern Recognition, 46:1012-1019.
Zheng, L., He, X., Samali, B., and Yang, L.T. 2013. An algorithm for accuracy enhancement of license plate recognition. Journal of Computer and System Sciences 79:245-255.
