

APPENDIX 1.
Localities containing specimens used in this study. Locality numbers follow the system of each institution; those beginning with “V” are UCMP localities; those beginning with “C” are UWBM localities. All localities are in Montana except for V5620, which is in Wyoming. Abbreviations: Fm, formation; La, Lancian; n, number of specimens from the locality; Pu1, Puercan 1; Pu3, Puercan 3.
| Loc. Number | Locality NAme | County | Fm | Biozone | n |
| C0338 | Bug Creek A | McCone | Hell Creek | mixed | 2 |
| C1115 | Celeste's Magnificent Microsite | Garfield | Hell Creek | Lancian | 1 |
| C1163 | MacDonald | Garfield | Tullock | Pu3 | 1 |
| C1521 | Wake Up | Garfield | Hell Creek | Lancian | 1 |
| C1845 | Bug Creek | McCone | Hell Creek | mixed | 1 |
| V5620 | Lull 2 | Niobrara | Lance | Lancian | 4 |
| V65127 | Bug Creek Anthills General | McCone | Hell Creek | mixed | 11 |
| V70201 | Bug Creek Anthills C | McCone | Hell Creek | mixed | 4 |
| V70209 | Bug Creek W | McCone | Hell Creek | mixed | 4 |
| V71203 | Harbicht Hill 1 | McCone | Hell Creek | mixed | 1 |
| V72129 | Garbani 04-Nw-S Level 1 | Garfield | Tullock | Pu3 | 1 |
| V72207 | Windy Hill | Garfield | Hell Creek | Lancian | 2 |
| V73087 | Flat Creek 5 | Garfield | Hell Creek | Lancian | 1 |
| V73097 | Brownie Butte | Garfield | Hell Creek | Lancian | 1 |
| V74111 | Worm Coulee 1 | Garfield | Tullock | Pu1 | 3 |
| V74122 | Biscuit Springs | Garfield | Tullock | Pu3 | 1 |
| V74124 | Yellow Sand Hill 2 | Garfield | Tullock | Pu3 | 1 |
| V84162 | Sand Cave | Garfield | Hell Creek | Pu1 | 1 |
| V84193 | Z-Line Quarry | McCone | Hell Creek | Pu1 | 1 |
| V85092 | Kmark II | McCone | Hell Creek | Lancian | 1 |
| V87001 | O’Connor Site | Fallon | Hell Creek | Lancian | 1 |
| V88007 | Spigot Bottle | Carter | Hell Creek | Lancian | 1 |
| V91065 | Capping Channel | Garfield | Tullock | Pu1 | 1 |
| V93169 | Anne’s Beast | Garfield | Hell Creek | Lancian | 1 |
| V99438 | Garbani Sandy Channel | Garfield | Tullock | Pu3 | 3 |
APPENDIX 2.
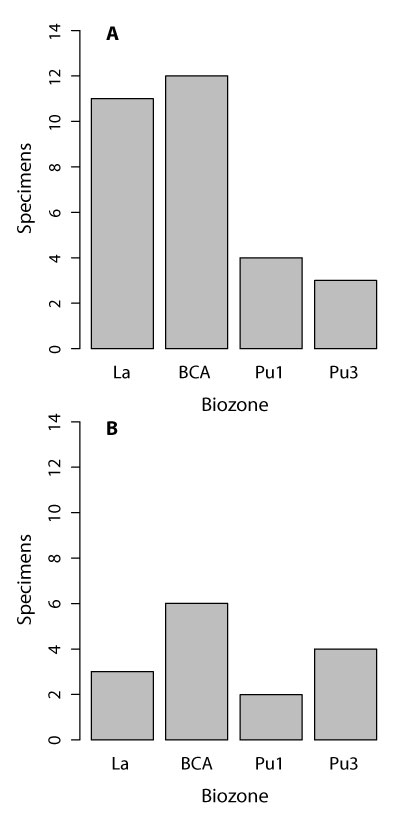
Histograms illustrating the number of multituberculate (1) and therian (2) specimens in each biozone. Abbreviations: BCA, Bug Creek Anthills mixed-age assemblage; La, Lancian; Pu1, early Puercan; Pu3; middle-late Puercan. See text for morphotype details.
APPENDIX 3.
Comparative multituberculate distal humeri used in this study. We follow the convention of Krause and Jenkins (1983) with regards to prefacing unassociated attributions with a query (e.g., for isolated material). Age data for Late Cretaceous and Paleogene North American taxa are given as NALMAs, respectively; ages of Asian taxa are given as geologic stages. Specimens from the Bug Creek Anthills localities (e.g., Deischl 1964; Krause and Jenkins 1983) are given a “Lancian-Pu1 mixed” age. All families are in the Infraorder Cimolodonta. See text for museum abbreviations.
| Specimen Number | Taxon NAme | Family | Age | Location | Reference |
| AMNH 77175 | ?Mesodma primaeva | Neoplagaiulacidae | Judithian | North America | Sahni, 1972 |
| AMNH 3011a | ?Meniscoessus conquistus | Cimolomyidae | Lancian | North America | Cope, 1884; Krause and Jenkins, 1983 |
| YPM 10612a | ?Meniscoessus robustus (formerly Dipriodon lunatus) | Cimolomyidae | Lancian | North America | Marsh, 1889; Krause and Jenkins, 1983 |
| MCZ 20786-20789 | ?Mesodma sp. | Neoplagaiulacidae | Lancian-Pu1 mixed | North America | Krause and Jenkins, 1983 |
| UMVP 1405 | ?Mesodma formosa | Neoplagaiulacidae | Lancian-Pu1 mixed | North America | Deischl,1964 |
| UMVP 1403, 1406 | ?Mesodma thompsoni | Neoplagaiulacidae | Lancian-Pu1 mixed | North America | Deischl,1964 |
| UMVP 1404 | ?Cimexomys minor | Neoplagaiulacidae | Lancian-Pu1 mixed | North America | Deischl,1964 |
| UMVP 1407 | ?Stygimys kuszmauli | Eucosmodontidae | Lancian-Pu1 mixed | North America | Deischl,1964; Krause and Jenkins, 1983 |
| UA 11994 | ?Stygimys kuszmauli | Eucosmodontidae | Lancian-Pu1 mixed | North America | Krause and Jenkins, 1983 |
| MCZ 19529 | ?Catopsalis | Taeniolabididae | Lancian-Pu1 mixed | North America | Jenkins, 1973 |
| AMNH 3036 | ?Taeniolabis taoensis | Taeniolabididae | Puercan | North America | Sloan, 1981 |
| Cope 1884: Figure 4b | Taeniolabis taoensis (formerly Polymastodon taoensis) | Taeniolabididae | Puercan | North America | Cope, 1884 |
| IVPP V8408, V9051 | ?Lambdopsalis bulla | Taeniolabididae | Late Paleocene | Asia | Kielan-Jaworowska and Qi, 1990 |
| USNM 9735 | ?Ptilodus montanus | Ptilodontidae | Torrejonian | North America | Krause and Jenkins, 1983 |
| USNM 6076 | Ptilodus montanus | Ptilodontidae | Torrejonian | North America | Gidley, 1909; Krause and Jenkins, 1983 |
| UA 9001 | Ptilodus kummae | Ptilodontidae | Tiffanian | North America | Krause and Jenkins, 1983 |
| UA 11300 | ?Ptilodus kummae | Ptilodontidae | Tiffanian | North America | Krause and Jenkins, 1983 |
| UALVP 42816 | Microcosmodon conus | Microcosmodontidae | Tiffanian | North America | Fox, 2005 |
| GISPS 8-2 PST | Tugrigbaatar saichanensis | Djadochtatheriidae | Campanian | Asia | Kielan-Jaworowska and Dashzeveg, 1978 |
| PSS-MAE 103 | Kryptobaatar dashzevegi | Djadochtatheriidae | Campanian | Asia | Sereno 2006 |
| PM 120/107 | Catopsbaatar catopsaloides | Djadochtatheriidae | Campanian | Asia | Hurum and Kielan-Jaworowska, 2008 |
| URBAC 03-076 | Multituberculata | Turonian | Asia | Chester et al., 2010 | |
| AMNH 118267 | Multituberculata | Lancian-Pu1 mixed | North America | Kielan-Jaworowska and Gambaryan, 1994 |
APPENDIX 4.
Comparative therian fossils specimens used in this study. List of fossil specimens used for comparative study. We follow the convention of Krause and Jenkins with regards to prefacing unassociated attributions with a query (e.g., for isolated material). Age data for Late Cretaceous and Paleogene North and South American taxa are given as NALMAs and SALMAs, respectively; ages of European taxa are given as geologic stages. Specimens from the Bug Creek Anthills localities (e.g., Szalay and Dagosto, 1980; Boyer et al., 2010) are given a “Lancian-Pu1 mixed” age. See text for museum abbreviations.
| Specimen Number | Taxon Name | Higher Taxon | Family | Age | Location | References |
| Marsh,1889: Plate V, figs. 5-6 | Didelphodon vorax | Didelphimorphia | Stagodontidae | Lancian | North America | Marsh,1889 |
| MHNC 1249 | Mayulestes ferox | Didelphimorphia | Mayulestidae | Tiupampan | South America | Muizon, 1998 |
| YPFB 6105, 6106, 6110, 6111 | Pucadelphys andinus | Didelphimorphia | Didelphidae | Tiupampan | South America | Marshall et al., 1995 |
| AMNH 118456 | ?Procerberus formicarum | Cimolestidae | Lancian-Pu1 mixed | North America | Boyer et al., 2010 | |
| UMVP 1837 | ?Procerberus formicarum | Cimolestidae | Lancian-Pu1 mixed | North America | Szalay and Dagosto, 1980 | |
| UM 88105 | ?Prodiacodon tauricinerei | Leptictida | Leptictidae | Wasatchian | North America | Rose, 1999 |
| AMNH 16614 | Protoselene opisthacus | archaic ungulate | Hyopsodontidae | Torrejonian | North America | Matthew, 1937 |
| NMMNH P-20949 | Tetraclaenodon puercensis | archaic ungulate | Phenacodontidae | Torrejonian | North America | Kondrashov and Lucas, 2012 |
| AMNH 119994 | ?Protungulatum donnae | archaic ungulate | Arctocyonidae | Lancian-Pu1 mixed | North America | Boyer et al., 2010 |
| UM 1836 | ?Protungulatum donnae | archaic ungulate | Arctocyonidae | Lancian-Pu1 mixed | North America | Szalay and Dagosto, 1980 |
| AMNH 16343 | Loxolophus hyattianus | archaic ungulate | Artocyonidae | Puercan | North America | Matthew, 1937 |
| AMNH 16543 | Arctocyon corrugatus (formerly Claenodon corrugatus) | archaic ungulate | Artocyonidae | Torrejonian | North America | Matthew, 1937 |
| AMNH 16591 | Chriacus sp. | archaic ungulate | Artocyonidae | Torrejonian | North America | Matthew, 1937 |
| MNHN.F.CR17, MNHN.F.CR16 | Arctocyon primaevus | archaic ungulate | Artocyonidae | Thanetian | Europe | Russell, 1964; Argot, 2013 |
| USGS 2353 | Chriacus sp. | archaic ungulate | Artocyonidae | Wasatchian | North America | Rose, 1987; O’Leary and Rose, 1995 |
| AMNH 16500 | Ectoconus ditrigonus (formerly E. majusculus) | archaic ungulate | Periptychidae | Puercan | North America | Matthew, 1937 |
| UNM-B029 | Mithrandir gillianus (formerly Gillisonchus gillianus) | archaic ungulate | Periptychidae | Puercan | North America | Rigby, 1981 |
| AMNH 3636 | ?Periptychus carinidens (formerly P. rhabdodon) | archaic ungulate | Periptychidae | Torrejonian | North America | Matthew, 1937 |
| AMNH 17075 | ?Periptychus carinidens (formerly P. rhabdodon) | archaic ungulate | Periptychidae | Torrejonian | North America | Matthew, 1937 |
| USGS 2352 | Diacodexis metsiacus | Artiodactyla | Diacodexeidae | Wasatchian | North America | Rose, 1982 |
| UALVP 49114 | Pronothodectes gaoi | “Plesiadapiformes” | Plesiadapidae | Tiffanian | North America | Boyer et al., 2010 |
| AMNH 17379 | ?NAnnodectes gidleyi (formerly Plesiadapis gidleyi) | “Plesiadapiformes” | Plesiadapidae | Tiffanian | North America | Simpson, 1935 |
| UM 64588 | Plesiadapis rex | “Plesiadapiformes” | Plesiadapidae | Tiffanian | North America | Boyer et al., 2010 |
| MNHN BR 3L and B4L | Plesiadapis tricuspidens | “Plesiadapiformes” | Plesiadapidae | Thanetian | Europe | Szalay et al., 1975 |
| UM 87990 | Plesiadapis cookei | “Plesiadapiformes” | Plesiadapidae | Clarkforkian | North America | Bloch et al., 2007 |
| UM 108210 and 82606 | Ignacius clarkforkensis | “Plesiadapiformes” | Paramomyidae | Clarkforkian | North America | Bloch et al., 2007 |
| UM 101963 | Carpolestes simpsoni | “Plesiadapiformes” | Carpolestidae | Clarkforkian | North America | Bloch and Boyer,2002 |
| AMNH 2549 | Pantolambda bathmodon | Pantodonta | Torrejonian | North America | Matthew, 1937 | |
| AMNH 16663 | Pantolambda bathmodon | Pantodonta | Torrejonian | North America | Matthew, 1937 | |
| AMNH 16410 | Onychodectes tisonensis | Taeniodonta | Conoryctidae | Puercan | North America | Schoch, 1986 |
| TMM 41364-1 | Psittacotheriummultifragum | Taeniodonta | Stylinodontidae | Torrejonian | North America | Schoch, 1986 |
| FMNH P 26090 | Ectoganusgliriformis | Taeniodonta | Stylinodontidae | Tiffanian-Clarkforkian | North America | Schoch, 1986 |
| FMNH P 26083 | Ectoganus lobdelli (formerly Lampadophorus expectatus) | Taeniodonta | Stylinodontidae | Tiffanian-Clarkforkian | North America | Schoch, 1986 |
| YPM 27201 | Ectoganus sp. | Taeniodonta | Stylinodontidae | Wasatchian | North America | Schoch, 1986 |
| YPM 11096 | Stylinodon mirus | Taeniodonta | Stylinodontidae | Bridgerian | North America | Schoch, 1986 |
| AMNH 16610 | Deltherium | Tillodontia | Deltatheriidae | Torrejonian | North America | Matthew, 1937 |
| PU 14389 | Theria indet. | Fort Union Formation | North America | Jenkins, 1973 | ||
| LSUMG V-802 | Theria indet. | Puercan | North America | Standhardt, 1986 |
APPENDIX 5.
Intraobserver error results. We performed five trials in which we plotted all six landmarks (LMs) on five specimens for each trial. Specimens were chosen to represent the overall variation in the study (i.e., at the maxima and minima of PC1 and PC2, see Appendix 32). We report the variances for each LM placement for each specimen across the five trials, as well as the mean variance across all LMs for a single specimen, and the mean variance across all specimens for a single LM. See Appendix 6 for F test comparison of differences in variance across all LMs. We report the genus and species, sex (in parentheses), and specimen number for each specimen used in this repeatability study. The specimen for Caluromys philander was taken from Argot (2001, figure 8) and lacks sex information; see Methods. Specimen ID Numbers used in this study are the same throughout; see Table 4 for additional specimen information.
| Specimen Number | ID Number | LM1 | LM2 | LM3 | LM4 | LM5 | LM6 | Mean of Variances Across LMs | |
| Cavia porcellus (F) | UWBM 72830 | 80 | 5.453E-04 | 1.599E-04 | 1.096E-05 | 6.610E-05 | 1.795E-04 | 4.135E-05 | 1.672E-04 |
| Caluromys philander (NA) | Argot, 2001, fig. 8 | 3 | 3.751E-05 | 4.613E-05 | 9.017E-05 | 2.406E-05 | 2.586E-05 | 6.837E-05 | 4.868E-05 |
| Dipodomys deserti (F) | UWBM 78740 | 95 | 7.200E-05 | 1.451E-05 | 3.171E-05 | 8.272E-05 | 1.913E-04 | 6.401E-06 | 6.643E-05 |
| Lepus americanus (F) | UWBM 21111 | 62 | 8.579E-06 | 4.393E-05 | 2.749E-04 | 1.938E-05 | 4.885E-05 | 5.885E-04 | 1.640E-04 |
| Mustela erminea (M) | UWBM 72863 | 51 | 9.250E-05 | 1.794E-04 | 3.547E-05 | 1.169E-05 | 7.590E-05 | 6.506E-05 | 7.668E-05 |
| Mean of Variances Across Specimens | 1.512E-04 | 8.878E-05 | 8.864E-05 | 4.079E-05 | 1.043E-04 | 1.539E-04 | |||
APPENDIX 6.
Results from F tests of variances pairwise across all landmarks. Specimens are those used in the repeatability study for measurement error (Appendix 5), variances were calculated across Euclidean distances from the centroid for each landmark (LM), and across all five trials for a single specimen. P-values are reported for each pairwise F test, with significance as follows: * for p < 0.05; ** for p < 0.01.
| LM1 | LM2 | LM3 | LM4 | LM5 | LM6 | ||
| Cavia porcellus | |||||||
| LM1 | - | 0.262 | ** | 0.065 | 0.307 | * | |
| LM2 | 0.262 | - | * | 0.413 | 0.913 | 0.219 | |
| LM3 | ** | * | - | 0.110 | * | 0.227 | |
| LM4 | 0.065 | 0.413 | 0.110 | - | 0.357 | 0.661 | |
| LM5 | 0.307 | 0.913 | * | 0.357 | - | 0.184 | |
| LM6 | * | 0.219 | 0.227 | 0.661 | 0.184 | - | |
| Caluromys philander | |||||||
| LM1 | - | 0.846 | 0.416 | 0.677 | 0.727 | 0.575 | |
| LM2 | 0.846 | - | 0.532 | 0.544 | 0.589 | 0.712 | |
| LM3 | 0.416 | 0.532 | - | 0.229 | 0.254 | 0.795 | |
| LM4 | 0.677 | 0.544 | 0.229 | - | 0.946 | 0.336 | |
| LM5 | 0.727 | 0.589 | 0.254 | 0.946 | - | 0.369 | |
| LM6 | 0.575 | 0.712 | 0.795 | 0.336 | 0.369 | - | |
| Dipodomys deserti | |||||||
| LM1 | - | 0.150 | 0.447 | 0.896 | 0.367 | * | |
| LM2 | 0.150 | - | 0.468 | 0.120 | * | 0.447 | |
| LM3 | 0.447 | 0.468 | - | 0.376 | 0.110 | 0.150 | |
| LM4 | 0.896 | 0.120 | 0.376 | - | 0.437 | * | |
| LM5 | 0.367 | * | 0.110 | 0.437 | - | ** | |
| LM6 | * | 0.447 | 0.150 | * | ** | - | |
| Lepus americanus | |||||||
| LM1 | - | 0.143 | ** | 0.449 | 0.121 | ** | |
| LM2 | 0.143 | - | 0.103 | 0.447 | 0.921 | * | |
| LM3 | ** | 0.103 | - | * | 0.123 | 0.479 | |
| LM4 | 0.449 | 0.447 | * | - | 0.392 | ** | |
| LM5 | 0.121 | 0.921 | 0.123 | 0.392 | - | * | |
| LM6 | ** | * | 0.479 | ** | * | - | |
| Mustela erminea | |||||||
| LM1 | - | 0.537 | 0.376 | 0.070 | 0.853 | 0.741 | |
| LM2 | 0.537 | - | 0.145 | * | 0.425 | 0.350 | |
| LM3 | 0.376 | 0.145 | - | 0.308 | 0.479 | 0.571 | |
| LM4 | 0.070 | * | 0.308 | - | 0.097 | 0.125 | |
| LM5 | 0.853 | 0.425 | 0.479 | 0.097 | - | 0.885 | |
| LM6 | 0.741 | 0.350 | 0.571 | 0.125 | 0.885 | - | |
APPENDIX 7.
Means, standard deviations, and percent preservation for multituberculate measurements by morphotype. We include all specimens except for the two specimens tentatively attributed to morphotype MuA (i.e., ?MuA), see text for more details. See Table 1 for measurement descriptions; see Table 2 for data (data excludes minimum values). NA indicates no specimens preserved the measurement (i.e., NA for means) or only one specimen preserved the measurement (i.e., NA for SD). Bold values indicate specimen percent preservation (i.e., the number of specimens that preserve that measurement divided by the total number of specimens in the morphotype) greater than or equal to 80%. We calculate the coefficient of variation (CV) for morphotypes containing more than two specimens. Abbreviations: CV, coefficient of variation; n, number of specimens; SD, standard deviation.
| TDW | AW | TLW | NCW | UCW | RCW | UCL | RCL | UCD | RCD | |
| Full Dataset (n= 28) | ||||||||||
| Mean | 6.86 | 3.55 | 4.09 | 2.05 | 1.68 | 2.27 | 2.65 | 2.48 | 2.92 | 2.80 |
| SD | 3.86 | 1.95 | 2.33 | 1.02 | 0.90 | 1.32 | 1.46 | 1.55 | 1.64 | 1.44 |
| % Preservation | 39.29 | 57.14 | 57.14 | 53.57 | 89.29 | 71.43 | 89.29 | 78.57 | 89.29 | 67.86 |
| MuA (n= 8) | ||||||||||
| Mean | 3.884 | 2.025 | 2.485 | 1.185 | 0.874 | 1.125 | 1.363 | 1.136 | 1.480 | 1.494 |
| SD | 0.187 | 0.093 | 0.140 | 0.135 | 0.096 | 0.083 | 0.085 | 0.081 | 0.121 | 0.069 |
| % Preservation | 62.50 | 75.00 | 87.50 | 62.50 | 100.00 | 75.00 | 100.00 | 87.50 | 100.00 | 62.50 |
| CV | 0.048 | 0.046 | 0.056 | 0.114 | 0.110 | 0.073 | 0.063 | 0.071 | 0.082 | 0.046 |
| MuB (n= 1) | ||||||||||
| Mean | NA | NA | NA | 1.240 | 1.080 | NA | 1.465 | NA | 1.670 | NA |
| SD | NA | NA | NA | NA | NA | NA | NA | NA | NA | NA |
| % Preservation | 0.00 | 0.00 | 0.00 | 100.00 | 100.00 | 0.00 | 100.00 | 0.00 | 100.00 | 0.00 |
| MuC (n= 7) | ||||||||||
| Mean | 5.875 | 2.933 | 3.726 | 1.640 | 1.386 | 1.634 | 2.200 | 1.803 | 2.409 | 2.226 |
| SD | 0.827 | 0.232 | 0.400 | 0.277 | 0.254 | 0.246 | 0.205 | 0.129 | 0.252 | 0.192 |
| % Preservation | 28.57 | 71.43 | 71.43 | 42.86 | 85.71 | 85.71 | 100.00 | 85.71 | 100.00 | 85.71 |
| CV | 0.141 | 0.079 | 0.107 | 0.169 | 0.183 | 0.151 | 0.093 | 0.072 | 0.105 | 0.086 |
| MuD (n= 1) | ||||||||||
| Mean | NA | NA | NA | NA | NA | 2.160 | NA | 2.135 | NA | 2.350 |
| SD | NA | NA | NA | NA | NA | NA | NA | NA | NA | NA |
| % Preservation | 0.00 | 0.00 | 0.00 | 0.00 | 0.00 | 100.00 | 0.00 | 100.00 | 0.00 | 100.00 |
| MuE (n= 5) | ||||||||||
| Mean | 8.275 | 4.213 | 5.155 | 2.475 | 1.933 | 2.488 | 3.076 | 2.375 | 3.416 | 3.053 |
| SD | 0.205 | 0.265 | 0.106 | 0.108 | 0.314 | 0.110 | 0.393 | 0.156 | 0.337 | 0.337 |
| % Preservation | 40.00 | 40.00 | 40.00 | 60.00 | 100.00 | 40.00 | 80.00 | 40.00 | 80.00 | 60.00 |
| CV | 0.025 | 0.063 | 0.021 | 0.044 | 0.162 | 0.044 | 0.128 | 0.066 | 0.099 | 0.110 |
| MuF (n= 6) | ||||||||||
| Mean | 13.865 | 7.192 | 9.548 | 3.740 | 3.174 | 4.334 | 5.221 | 4.826 | 5.777 | 5.220 |
| SD | 0.226 | 0.467 | 0.626 | 0.420 | 0.526 | 0.461 | 0.282 | 0.639 | 0.660 | 0.928 |
| % Preservation | 33.33 | 50.00 | 33.33 | 50.00 | 83.33 | 83.33 | 83.33 | 100.00 | 83.33 | 66.67 |
| CV | 0.016 | 0.065 | 0.066 | 0.112 | 0.166 | 0.106 | 0.054 | 0.133 | 0.114 | 0.178 |
APPENDIX 8.
Means, standard deviations, and percent preservation for therian measurements by morphotype. We include all specimens except for the specimen in morphotype MeA, which lacked any measureable features. See Table 1 for measurement descriptions; see Table 3 for data (data excludes minimum values). NA indicates no specimens preserved the measurement (i.e., NA for means) or only one specimen preserved the measurement (i.e., NA for SD). Bold values indicate specimen percent preservation (i.e., the number of specimens that preserve that measurement divided by the total number of specimens in the morphotype) greater than or equal to 80%. We calculate the coefficient of variation (CV) for morphotypes containing more than two specimens (i.e., only EuD). Abbreviations: CV, coefficient of variation; n, number of specimens; SD, standard deviation.
| TDW | AW | TLW | NCW | TW | CW | TL | CL | TD | CD | |
| Full Dataset (n = 14) | ||||||||||
| Mean | 9.560 | 7.189 | 7.414 | 4.713 | 2.438 | 4.836 | 3.084 | 3.026 | 2.708 | 4.416 |
| SD | 0.357 | 3.926 | 3.888 | 2.812 | 1.351 | 2.838 | 2.084 | 1.824 | 1.360 | 2.836 |
| % Preservation | 21.43 | 78.57 | 78.57 | 42.86 | 92.86 | 78.57 | 92.86 | 78.57 | 71.43 | 57.14 |
| EuA (n = 1) | ||||||||||
| Mean | NA | 3.850 | 3.850 | NA | 1.330 | 2.406 | 1.630 | 1.579 | 1.756 | 1.920 |
| SD | NA | NA | NA | NA | NA | NA | NA | NA | NA | NA |
| % Preservation | 0.00 | 100.00 | 100.00 | 0.00 | 100.00 | 100.00 | 100.00 | 100.00 | 100.00 | 100.00 |
| EuB (n = 1) | ||||||||||
| Mean | NA | 4.765 | 5.120 | NA | 1.705 | 2.895 | 1.960 | 1.945 | 2.355 | NA |
| SD | NA | NA | NA | NA | NA | NA | NA | NA | NA | NA |
| % Preservation | 0.00 | 100.00 | 100.00 | 0.00 | 100.00 | 100.00 | 100.00 | 100.00 | 100.00 | 0.00 |
| EuC (n = 2) | ||||||||||
| Mean | 9.520 | 5.635 | 5.735 | 3.918 | 1.670 | 3.945 | 2.680 | 2.515 | 3.095 | 3.310 |
| SD | NA | NA | NA | 0.138 | NA | NA | NA | NA | 0.092 | NA |
| % Preservation | 50.00 | 50.00 | 50.00 | 100.00 | 50.00 | 50.00 | 50.00 | 50.00 | 100.00 | 50.00 |
| EuD (n = 5) | ||||||||||
| Mean | 9.580 | 5.463 | 5.780 | 3.880 | 1.923 | 3.510 | 1.840 | 2.056 | 2.279 | 2.528 |
| SD | 0.502 | 0.223 | 0.310 | 0.467 | 0.168 | 0.245 | 0.221 | 0.221 | 0.129 | 0.168 |
| % Preservation | 40.00 | 100.00 | 100.00 | 40.00 | 100.00 | 100.00 | 100.00 | 100.00 | 80.00 | 60.00 |
| CV | 0.052 | 0.041 | 0.054 | 0.120 | 0.087 | 0.070 | 0.120 | 0.108 | 0.057 | 0.066 |
| EuE (n = 2) | ||||||||||
| Mean | NA | 10.118 | 10.275 | NA | 2.795 | 7.290 | 4.453 | 4.845 | 6.280 | 6.423 |
| SD | NA | 0.803 | 0.813 | NA | 0.219 | 0.467 | 0.173 | 0.375 | NA | 1.559 |
| % Preservation | 0.00 | 100.00 | 100.00 | 0.00 | 100.00 | 100.00 | 100.00 | 100.00 | 50.00 | 100.00 |
| EuF (n = 1) | ||||||||||
| Mean | NA | 17.280 | 17.395 | NA | 5.480 | 11.820 | 6.945 | 7.280 | NA | 9.670 |
| SD | NA | NA | NA | NA | NA | NA | NA | NA | NA | NA |
| % Preservation | 0.00 | 100.00 | 100.00 | 0.00 | 100.00 | 100.00 | 100.00 | 100.00 | 0.00 | 100.00 |
| EuG (n = 1) | ||||||||||
| Mean | NA | NA | NA | 10.300 | 5.095 | NA | 7.435 | NA | NA | NA |
| SD | NA | NA | NA | NA | NA | NA | NA | NA | NA | NA |
| % Preservation | 0.00 | 0.00 | 0.00 | 100.00 | 100.00 | 0.00 | 100.00 | 0.00 | 0.00 | 0.00 |
| ThA (n = 1) | ||||||||||
| Mean | NA | NA | NA | 2.380 | 1.210 | NA | 1.340 | NA | 1.380 | NA |
| SD | NA | NA | NA | NA | NA | NA | NA | NA | NA | NA |
| % Preservation | 0.00 | 0.00 | 0.00 | 100.00 | 100.00 | 0.00 | 100.00 | 0.00 | 100.00 | 0.00 |
APPENDIX 9.
The results of One-Way ANOVAs of difference for all multituberculate measurements across all morphotypes. Asterisks (****) indicate significant p-values (< 0.0001). Both biozone (b) and residuals (r) values are given for Sum of Squares, df, and Mean Squares. See Table 1 for measurement details; see Table 3 for data.
| TDW | AW | TLW | NCW | UCW | RCW | UCL | RCL | UCD | RCD | |||||||||||
| b | r | b | r | b | r | b | r | b | r | b | r | b | r | b | r | b | r | b | r | |
| Sum of Squares | 148.368 | 0.918 | 56.520 | 0.764 | 80.532 | 1.160 | 14.012 | 0.603 | 17.551 | 1.889 | 31.699 | 1.198 | 49.847 | 1.083 | 48.562 | 2.192 | 61.774 | 2.568 | 34.327 | 3.012 |
| df | 3 | 7 | 3 | 12 | 3 | 12 | 4 | 10 | 4 | 20 | 4 | 15 | 4 | 20 | 4 | 17 | 4 | 20 | 4 | 14 |
| Mean Squares | 49.456 | 0.131 | 18.840 | 0.064 | 26.844 | 0.097 | 3.503 | 0.060 | 4.388 | 0.094 | 7.925 | 0.080 | 12.462 | 0.054 | 12.141 | 0.129 | 15.444 | 0.128 | 8.582 | 0.215 |
| F | 377.07 | 295.97 | 277.59 | 58.10 | 46.45 | 99.19 | 230.16 | 94.17 | 120.27 | 39.89 | ||||||||||
| p-value | **** | **** | **** | **** | **** | **** | **** | **** | **** | **** | ||||||||||
APPENDIX 10.
Probabilities from Tukey honest significant difference (HSD) post hoc test of multituberculate measurements by morphotype. All measurements had significant ANOVA results, and therefore all measurements were subjected to the Tukey HSD test and have results below. Significance indicated by the following: * for p < 0.05; ** for p < 0.01; *** for p < 0.001; **** for p < 0.0001. NA indicates the morphotype did not include that particular measurement and therefore could not be subjected to ANOVA or Tukey tests.
| Measurement | MuA | MuB | MuC | MuD | MuE | MuF | |
| TDW | MuA | - | NA | ** | NA | **** | **** |
| MuB | NA | - | NA | NA | NA | NA | |
| MuC | ** | NA | - | NA | ** | **** | |
| MuD | NA | NA | NA | - | NA | NA | |
| MuE | **** | NA | ** | NA | - | **** | |
| MuF | **** | NA | **** | NA | **** | - | |
| AW | MuA | - | NA | *** | NA | **** | **** |
| MuB | NA | - | NA | NA | NA | NA | |
| MuC | *** | NA | - | NA | *** | **** | |
| MuD | NA | NA | NA | - | NA | NA | |
| MuE | **** | NA | *** | NA | - | **** | |
| MuF | **** | NA | **** | NA | **** | - | |
| TLW | MuA | - | NA | *** | NA | **** | **** |
| MuB | NA | - | NA | NA | NA | NA | |
| MuC | *** | NA | - | NA | *** | **** | |
| MuD | NA | NA | NA | - | NA | NA | |
| MuE | **** | NA | *** | NA | - | **** | |
| MuF | **** | NA | **** | NA | **** | - | |
| NCW | MuA | - | 1.000 | 0.158 | NA | *** | **** |
| MuB | 1.000 | - | 0.635 | NA | ** | **** | |
| MuC | 0.158 | 0.635 | - | NA | * | **** | |
| MuD | NA | NA | NA | - | NA | NA | |
| MuE | *** | ** | * | NA | - | *** | |
| MuF | **** | **** | **** | NA | *** | - | |
| UCW | MuA | - | 0.968 | * | NA | *** | **** |
| MuB | 0.968 | - | 0.885 | NA | 0.123 | **** | |
| MuC | * | 0.885 | - | NA | 0.056 | **** | |
| MuD | NA | NA | NA | - | NA | NA | |
| MuE | *** | 0.123 | 0.056 | NA | - | **** | |
| MuF | **** | **** | **** | NA | **** | - | |
| RCW | MuA | - | NA | * | * | *** | **** |
| MuB | NA | - | NA | NA | NA | NA | |
| MuC | * | NA | - | 0.451 | * | **** | |
| MuD | * | NA | 0.451 | - | 0.874 | **** | |
| MuE | *** | NA | * | 0.874 | - | **** | |
| MuF | **** | NA | **** | **** | **** | - | |
| UCL | MuA | - | 0.993 | **** | NA | **** | **** |
| MuB | 0.993 | - | 0.054 | NA | **** | **** | |
| MuC | **** | 0.054 | - | NA | *** | **** | |
| MuD | NA | NA | NA | - | NA | NA | |
| MuE | **** | **** | *** | NA | - | **** | |
| MuF | **** | **** | **** | NA | **** | - | |
| RCL | MuA | - | NA | * | 0.114 | ** | **** |
| MuB | NA | - | NA | NA | NA | NA | |
| MuC | * | NA | - | 0.908 | 0.329 | **** | |
| MuD | 0.114 | NA | 0.908 | - | 0.981 | **** | |
| MuE | ** | NA | 0.329 | 0.981 | - | **** | |
| MuF | **** | NA | **** | **** | **** | - | |
| UCD | MuA | - | 0.986 | *** | NA | **** | **** |
| MuB | 0.986 | - | 0.335 | NA | ** | **** | |
| MuC | *** | 0.335 | - | NA | ** | **** | |
| MuD | NA | NA | NA | - | NA | NA | |
| MuE | **** | ** | ** | NA | - | **** | |
| MuF | **** | **** | **** | NA | **** | - | |
| RCD | MuA | - | NA | 0.123 | 0.473 | ** | **** |
| MuB | NA | - | NA | NA | NA | NA | |
| MuC | 0.123 | NA | - | 0.999 | 0.141 | **** | |
| MuD | 0.473 | NA | 0.999 | - | 0.688 | *** | |
| MuE | ** | NA | 0.141 | 0.688 | - | *** | |
| MuF | **** | NA | **** | *** | *** | - |
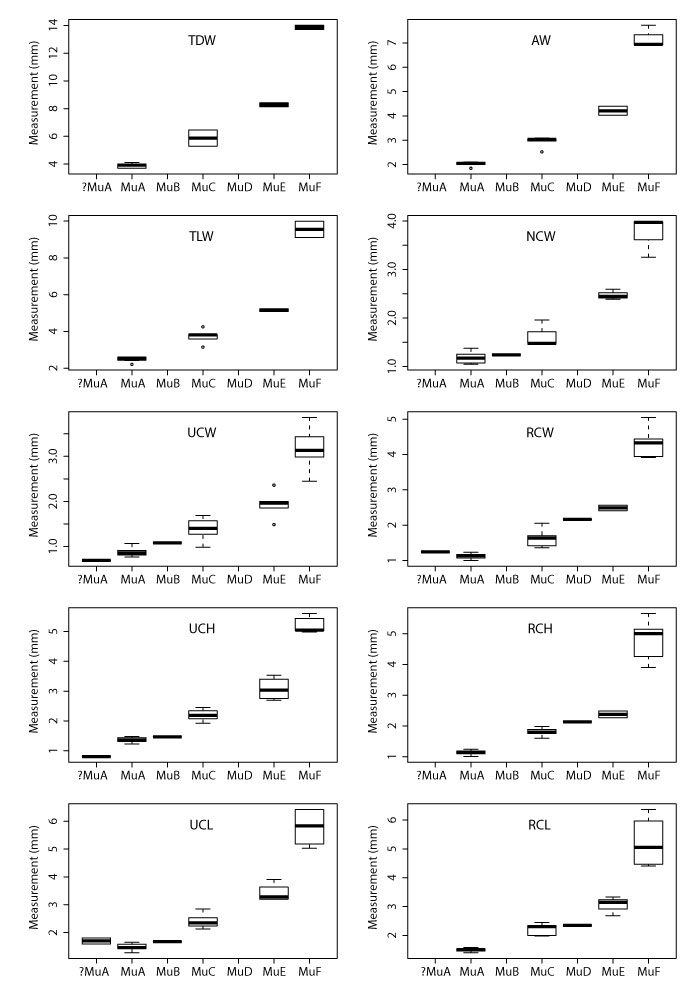
APPENDIX 11.
Boxplots for all multituberculate measurement with significant ANOVA results according to morphotype. Boxplots include minimum, quartiles, median, and maximum values. See Table 1 for measurements, Table 2 for data, and Appendix 9-Appendix 10 for ANOVA and Tukey HSD results, respectively. Specimens tentatively attributed to morphotype MuA (i.e., ?MuA), were not included in ANOVA and Tukey tests.
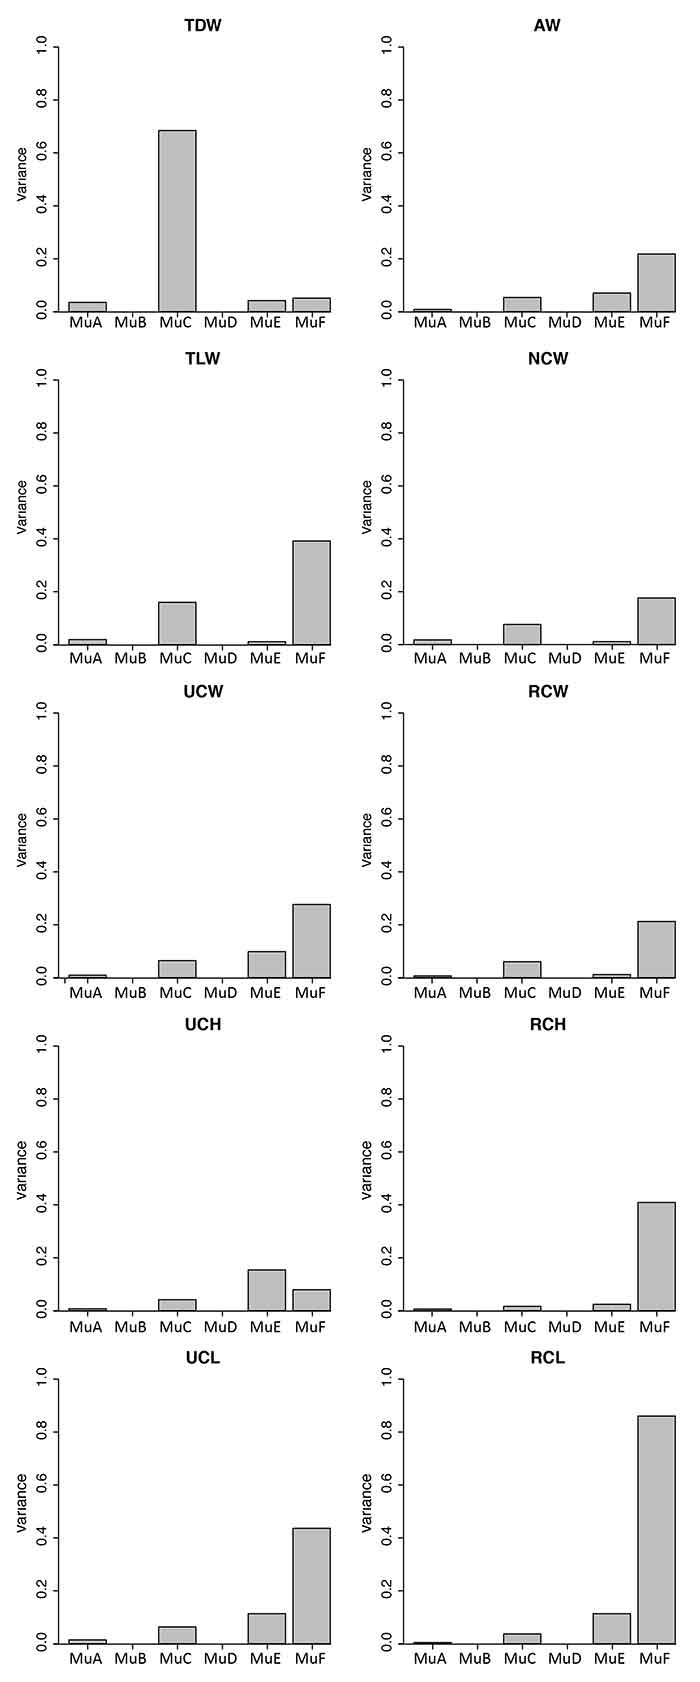
APPENDIX 12.
Variances for all multituberculate measurement with significant ANOVA results according to morphotype. See Appendix 2 for means, maxima, minima, and quartiles. See Table 1 for measurements, Table 2 for data, and Appendix 9-Appendix 10 for ANOVA and Tukey HSD results, respectively.
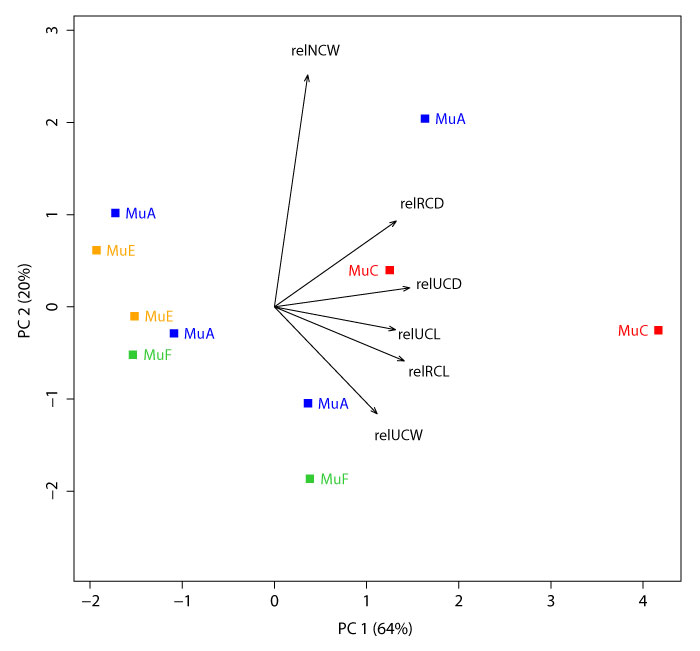
APPENDIX 13.
Principal Components 1 and 2 on the full set of variables (i.e., measurements; excluding TDW, AW, and TLW; n = 10 specimens). All measurements are standardized to (i.e., “relative to”) RCW. The first and second principal components explain 64% and 20% of the variation, respectively. See Appendix 14 for all principal component loadings and variances. Plotted multituberculate morphotypes include: MuA (blue), MuC (red), MuE (orange), and MuF (green). See Table 1 for measurements and Table 2 for data.
APPENDIX 14.
Measurement loading and variance results of Principal Components Analysis on linear measurements of multituberculate specimens from our assemblage (n = 10). Measurements include NCW, RCL, RCD, UCL, UCD, and UCW, all standardized to RCW (Table 1; Appendix 13). Loadings in bold represent dominant loadings for each principal component (i.e., values greater than (1/(number of columns)2).
| PC1 | PC2 | PC3 | PC4 | PC5 | PC6 | |
| Loadings | ||||||
| relUCD | 0.490 | 0.069 | 0.120 | 0.354 | -0.130 | 0.774 |
| relRCL | 0.470 | -0.196 | -0.096 | -0.236 | 0.822 | -0.019 |
| relRCD | 0.441 | 0.311 | -0.206 | 0.597 | -0.044 | -0.556 |
| relUCL | 0.438 | -0.083 | -0.537 | -0.527 | -0.485 | -0.027 |
| relNCW | 0.121 | 0.839 | 0.329 | -0.413 | 0.050 | -0.004 |
| relUCW | 0.372 | -0.387 | 0.733 | -0.122 | -0.261 | -0.303 |
| Variance | ||||||
| Percent Variance | 0.637 | 0.199 | 0.085 | 0.048 | 0.022 | 0.009 |
| Cumulative Variance | 0.637 | 0.836 | 0.921 | 0.969 | 0.991 | 1.000 |
APPENDIX 15.
Principal Components 1 and 2 on measurements NCW, RCL, UCL, and UCW, and standardized to (i.e., “relative to”) RCW. The first and second principal components explain 61% and 23% of the variation, respectively. See Appendix 16 for all principal component loadings and variances. Plotted multituberculate morphotypes include: MuA (blue), MuC (red), MuE (orange), and MuF (green). This dataset is similar to that of Appendix 13, but excludes measurement RCD and includes one additional specimen (n = 11). See Table 1 for measurements and Table 2 for data.
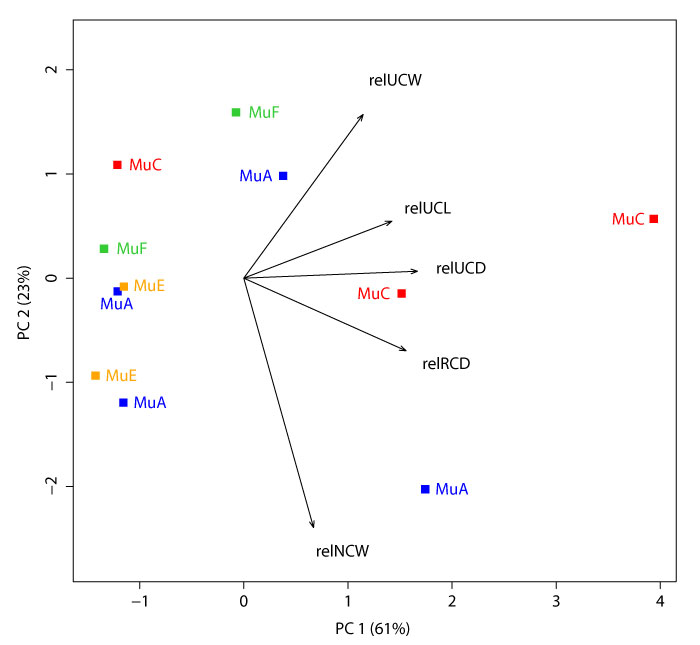
APPENDIX 16.
Measurement loading and variance results of Principal Components Analysis on linear measurements of multituberculate specimens from our assemblage (n = 11). Measurements include NCW, RCD, UCL, UCD, and UCW, all standardized to RCW (Table 1; Appendix 15). Loadings in bold represent dominant loadings for each principal component.
| PC1 | PC2 | PC3 | PC4 | PC5 | |
| Loadings | |||||
| relUCD | 0.556 | 0.022 | 0.092 | -0.309 | -0.766 |
| relRCD | 0.519 | -0.232 | -0.201 | -0.557 | 0.571 |
| relUCL | 0.474 | 0.183 | -0.602 | 0.615 | 0.030 |
| relNCW | 0.223 | -0.798 | 0.366 | 0.423 | 0.012 |
| relUCW | 0.382 | 0.524 | 0.674 | 0.196 | 0.294 |
| Variance | |||||
| Percent Variance | 0.608 | 0.231 | 0.099 | 0.052 | 0.010 |
| Cumulative Variance | 0.608 | 0.839 | 0.938 | 0.990 | 1.000 |
APPENDIX 17.
Principal Components 1 and 2 on measurements NCW, RCL, UCL, and UCW, and standardized to (“relative to”) RCW, see Table 1 for measurements. The first and second principal components explain 44% and 24% of the variation, respectively. See Appendix 18 for all principal component loadings and variances. Plotted multituberculate morphotypes include: MuA (blue), MuC (red), MuE (orange), and MuF (green; Table 2); published specimens include: ?Cimexomys minor, UMVP 1404 (Deischl 1964); Microcosmodon conus, UALVP 42816 (Fox 2005); Mesodma formosa, UMVP 1405 (Deischl 1964); M. thompsoni (A), UMVP 1406 (Deischl 1964); M. thompsoni (B), UMVP 1403 (Deischl 1964); Multituberculata, AMNH 118267 (Kielan-Jaworowska and Gambaryan 1994); Stygimys kuszmauli (C), UA 11994 (Krause and Jenkins 1983); and S. kuszmauli (D), UMVP 1407 (Deischl 1964; Krause and Jenkins 1983); see Appendix 3 for additional details on published material.
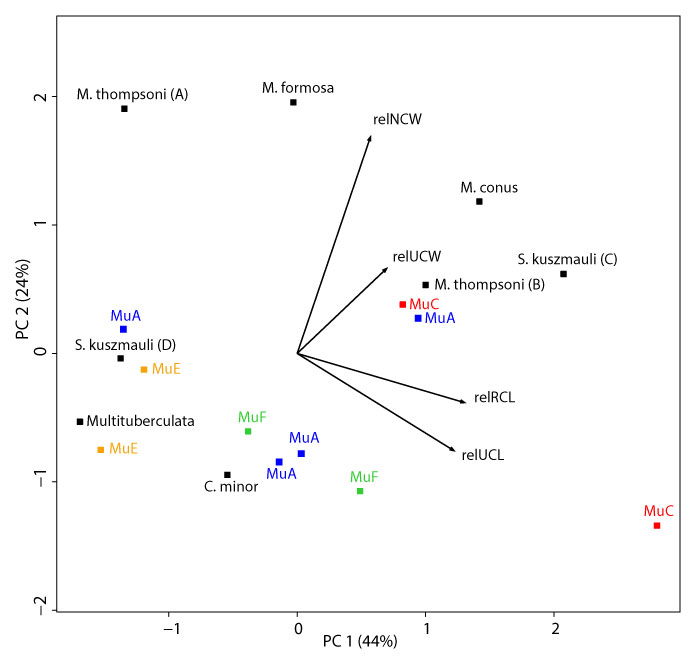
APPENDIX 18.
Measurement loading and variance results of Principal Components Analysis on linear measurements of multituberculate specimens. Measurements include NCW, RCL, UCL, and UCW, all standardized to RCW (Table 1; Appendix 17). Specimens include nine specimens from our assemblage and seven specimens from the published literature (see Appendix 17 for more details). Loadings in bold represent dominant loadings for each principal component.
| PC1 | PC2 | PC3 | PC4 | |
| Loadings | ||||
| relRCL | 0.652 | -0.191 | -0.100 | -0.727 |
| relUCL | 0.610 | -0.379 | -0.182 | 0.672 |
| relNCW | 0.285 | 0.843 | -0.446 | 0.095 |
| relUCW | 0.348 | 0.331 | 0.871 | 0.106 |
| Variance | ||||
| Percent Variance | 0.435 | 0.238 | 0.224 | 0.103 |
| Cumulative Variance | 0.435 | 0.673 | 0.897 | 1.000 |
APPENDIX 19.
The results of One-Way ANOVAs of difference for all therians measurements across all morphotypes. Significance indicated by the following: * for p < 0.05; ** for p < 0.01; *** for p < 0.001; **** for p < 0.0001. Both biozone (b) and residuals (r) values are given for Sum of Squares, df, and Mean Squares. See Table 1 for measurement details; see Table 3 for data.
| TDW | AW | TLW | NCW | UCW | RCW | UCL | RCL | UCD | RCD | |||||||||||
| b | r | b | r | b | r | b | r | b | r | b | r | b | r | b | r | b | r | b | r | |
| Sum of Squares | 0.002 | 0.252 | 153.315 | 0.844 | 150.124 | 1.047 | 39.311 | 0.237 | 21.757 | 0.161 | 80.078 | 0.459 | 51.904 | 0.225 | 32.942 | 0.336 | 16.590 | 0.059 | 53.800 | 2.487 |
| df | 1 | 1 | 5 | 5 | 5 | 5 | 3 | 2 | 7 | 5 | 5 | 5 | 7 | 5 | 5 | 5 | 5 | 4 | 4 | 3 |
| Mean Squares | 0.002 | 0.252 | 30.663 | 0.169 | 30.025 | 0.209 | 13.104 | 0.118 | 3.108 | 0.032 | 16.016 | 0.092 | 7.415 | 0.045 | 6.588 | 0.067 | 3.318 | 0.015 | 13.450 | 0.829 |
| F | 0.010 | 181.730 | 143.440 | 110.667 | 96.810 | 174.614 | 164.692 | 98.036 | 226.415 | 16.223 | ||||||||||
| p-value | 0.938 | **** | **** | ** | **** | **** | **** | **** | **** | * | ||||||||||
APPENDIX 20.
Probabilities from Tukey honest significant difference (HSD) post hoc test of therian measurements by morphotype. Measurements subjected to the Tukey HSD test are those with significant ANOVA results (i.e., all measurements except TDW); see Table 1 for measurements and Table 3 for data. Significance indicated by the following: * for p < 0.05; ** for p < 0.01; *** for p < 0.001; **** for p < 0.0001. NA indicates the morphotype did not include that particular measurement and therefore could not be subjected to ANOVA or Tukey tests.
| EuA | EuB | EuC | EuD | EuE | EuF | EuG | ThA | ||
| AW | EuA | - | 0.643 | 0.155 | 0.094 | *** | **** | NA | NA |
| EuB | 0.643 | - | 0.681 | 0.655 | *** | **** | NA | NA | |
| EuC | 0.155 | 0.681 | - | 0.998 | ** | **** | NA | NA | |
| EuD | 0.094 | 0.655 | 0.998 | - | *** | **** | NA | NA | |
| EuE | *** | *** | ** | *** | - | *** | NA | NA | |
| EuF | **** | **** | **** | **** | *** | - | NA | NA | |
| EuG | NA | NA | NA | NA | NA | NA | - | NA | |
| ThA | NA | NA | NA | NA | NA | NA | NA | - | |
| TLW | EuA | - | 0.463 | 0.182 | 0.073 | *** | **** | NA | NA |
| EuB | 0.463 | - | 0.916 | 0.769 | ** | **** | NA | NA | |
| EuC | 0.182 | 0.916 | - | 1.000 | ** | *** | NA | NA | |
| EuD | 0.073 | 0.769 | 1.000 | - | *** | **** | NA | NA | |
| EuE | *** | ** | ** | *** | - | *** | NA | NA | |
| EuF | **** | **** | *** | **** | *** | - | NA | NA | |
| EuG | NA | NA | NA | NA | NA | NA | - | NA | |
| ThA | NA | NA | NA | NA | NA | NA | NA | - | |
| NCW | EuA | - | NA | NA | NA | NA | NA | NA | NA |
| EuB | NA | - | NA | NA | NA | NA | NA | NA | |
| EuC | NA | NA | - | 0.999 | NA | NA | * | 0.162 | |
| EuD | NA | NA | 0.999 | - | NA | NA | * | 0.169 | |
| EuE | NA | NA | NA | NA | - | NA | NA | NA | |
| EuF | NA | NA | NA | NA | NA | - | NA | NA | |
| EuG | NA | NA | * | * | NA | NA | - | ** | |
| ThA | NA | NA | 0.162 | 0.169 | NA | NA | ** | - | |
| TW | EuA | - | 0.794 | 0.852 | 0.219 | * | *** | *** | 0.999 |
| EuB | 0.794 | - | 1.000 | 0.929 | * | *** | *** | 0.574 | |
| EuC | 0.852 | 1.000 | - | 0.872 | * | *** | *** | 0.638 | |
| EuD | 0.219 | 0.929 | 0.872 | - | * | *** | *** | 0.126 | |
| EuE | * | * | * | * | - | *** | ** | ** | |
| EuF | *** | *** | *** | *** | *** | - | 0.776 | *** | |
| EuG | *** | *** | *** | *** | ** | 0.776 | - | *** | |
| ThA | 0.999 | 0.574 | 0.638 | 0.123 | ** | *** | *** | - | |
| CW | EuA | - | 0.847 | 0.093 | 0.121 | *** | **** | NA | NA |
| EuB | 0.847 | - | 0.289 | 0.511 | *** | **** | NA | NA | |
| EuC | 0.093 | 0.289 | - | 0.771 | ** | *** | NA | NA | |
| EuD | 0.121 | 0.511 | 0.771 | - | *** | **** | NA | NA | |
| EuE | *** | *** | ** | *** | - | *** | NA | NA | |
| EuF | **** | **** | *** | **** | *** | - | NA | NA | |
| EuG | NA | NA | NA | NA | NA | NA | - | NA | |
| ThA | NA | NA | NA | NA | NA | NA | NA | - | |
| TL | EuA | - | 0.932 | 0.139 | 0.972 | ** | *** | *** | 0.962 |
| EuB | 0.932 | - | 0.391 | 0.999 | ** | *** | *** | 0.524 | |
| EuC | 0.139 | 0.391 | - | 0.125 | * | *** | *** | 0.059 | |
| EuD | 0.972 | 0.999 | 0.125 | - | *** | **** | **** | 0.487 | |
| EuE | ** | ** | * | *** | - | ** | *** | *** | |
| EuF | *** | *** | *** | **** | ** | - | 0.724 | *** | |
| EuG | *** | *** | *** | **** | *** | 0.724 | - | **** | |
| ThA | 0.962 | 0.524 | 0.059 | 0.487 | *** | *** | **** | - | |
| CL | EuA | - | 0.901 | 0.261 | 0.592 | ** | *** | NA | NA |
| EuB | 0.901 | - | 0.653 | 0.998 | ** | *** | NA | NA | |
| EuC | 0.261 | 0.653 | - | 0.623 | ** | *** | NA | NA | |
| EuD | 0.592 | 0.998 | 0.623 | - | *** | *** | NA | NA | |
| EuE | ** | ** | ** | *** | - | ** | NA | NA | |
| EuF | *** | *** | *** | *** | ** | - | NA | NA | |
| EuG | NA | NA | NA | NA | NA | NA | - | NA | |
| ThA | NA | NA | NA | NA | NA | NA | NA | - | |
| TD | EuA | - | 0.128 | ** | 0.096 | *** | NA | NA | 0.393 |
| EuB | 0.128 | - | * | 0.989 | *** | NA | NA | * | |
| EuC | ** | * | - | ** | *** | NA | NA | ** | |
| EuD | 0.096 | 0.989 | ** | - | *** | NA | NA | * | |
| EuE | *** | *** | *** | *** | - | NA | NA | *** | |
| EuF | NA | NA | NA | NA | NA | - | NA | NA | |
| EuG | NA | NA | NA | NA | NA | NA | - | NA | |
| ThA | 0.393 | * | ** | * | *** | NA | NA | - | |
| CD | EuA | - | NA | 0.810 | 0.970 | 0.101 | * | NA | NA |
| EuB | NA | - | NA | NA | NA | NA | NA | NA | |
| EuC | 0.810 | NA | - | 0.932 | 0.235 | 0.060 | NA | NA | |
| EuD | 0.970 | NA | 0.932 | - | 0.069 | * | NA | NA | |
| EuE | 0.101 | NA | 0.235 | 0.069 | - | 0.215 | NA | NA | |
| EuF | * | NA | 0.060 | * | 0.215 | - | NA | NA | |
| EuG | NA | NA | NA | NA | NA | NA | - | NA |
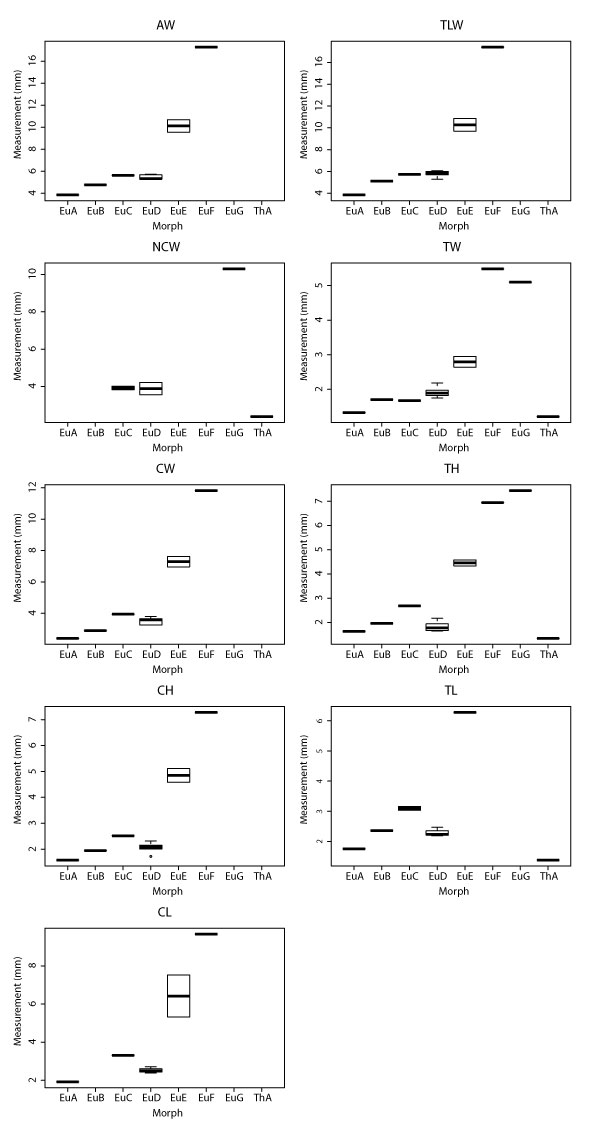
APPENDIX 21.
Boxplots for all therian measurement with significant ANOVA results according to morphotype (i.e., all measurement except TDW). Boxplots include minimum, quartiles, median, and maximum values. See Table 1 for measurements, Table 3 for data, and Appendix 19-Appendix 20 for ANOVA and Tukey HSD results, respectively. The specimen attributed to morphotype MeA was not included in ANOVA and Tukey tests because it lacked any morphologies preserving our measurements.
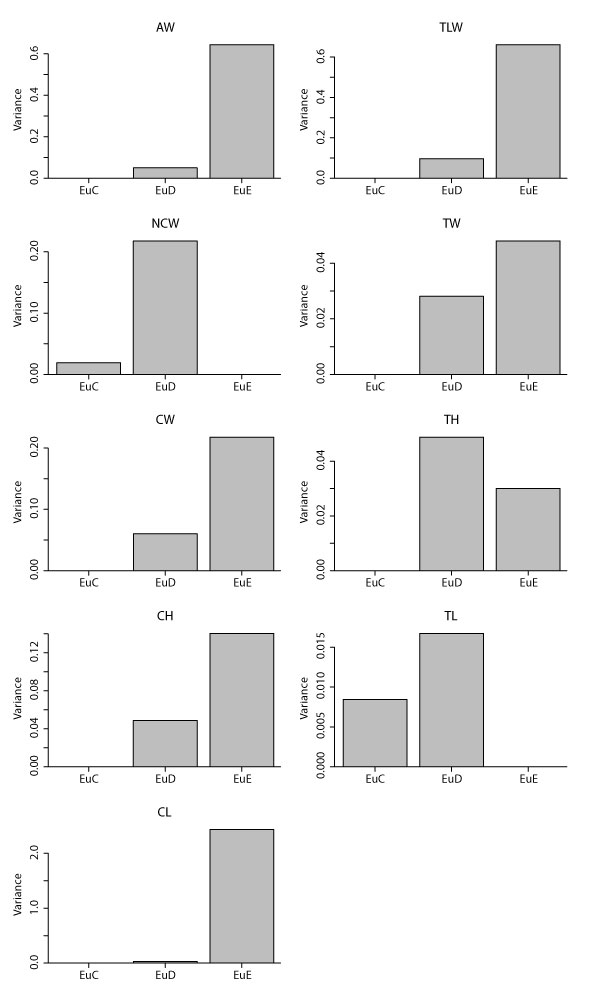
APPENDIX 22.
Variances for therian measurements with significant ANOVA results according to morphotype (i.e., all measurements except TDW) and preserving at least two specimens (i.e., only EuC, EuD, and EuE; see Appendix 8). See Appendix 21 for means, maxima, minima, and quartiles. See Table 1 for measurements, Table 3 for data, and Appendix 19-Appendix 20 for ANOVA and Tukey HSD results, respectively.
APPENDIX 23.
Means and standard deviations for multituberculate measurements for entire dataset and by biozone. For measurement descriptions see Table 1; for data see Table 2. NA indicates no specimens preserved the measurement (i.e., NA for mean) or only one specimen preserved the measurement (i.e., NA for SD). Bold values indicate specimen percent preservation (i.e., the number of specimens that preserve that measurement divided by the total number of specimens) greater than or equal to 80%. Abbreviations: BCA, Bug Creek Anthills specimens of mixed age (see text for details); n, number of specimens; Pu1, early Puercan 1 biozone; Pu3, late Puercan biozone; SD, standard deviation.
| TDW | AW | TLW | NCW | UCW | RCW | UCL | RCL | UCD | RCD | |
| Full Dataset (n = 30) | ||||||||||
| Mean | 6.859 | 3.551 | 4.089 | 2.049 | 1.639 | 2.219 | 2.576 | 2.482 | 2.826 | 2.801 |
| SD | 3.864 | 1.954 | 2.334 | 1.022 | 0.903 | 1.302 | 1.472 | 1.555 | 1.607 | 1.440 |
| % Preservation | 36.67 | 53.33 | 53.33 | 50.00 | 86.67 | 70.00 | 86.67 | 73.33 | 90.00 | 63.33 |
| Lancian (n = 11) | ||||||||||
| Mean | 10.475 | 5.232 | 6.199 | 3.066 | 2.243 | 3.151 | 3.627 | 3.587 | 4.145 | 3.650 |
| SD | 5.874 | 2.709 | 3.891 | 1.390 | 1.194 | 1.474 | 1.950 | 1.687 | 2.018 | 1.806 |
| % Preservation | 27.27 | 45.45 | 36.36 | 36.36 | 81.82 | 81.82 | 81.82 | 90.91 | 81.82 | 72.73 |
| BCA (n = 12) | ||||||||||
| Mean | 5.366 | 2.686 | 3.194 | 1.723 | 1.220 | 1.530 | 1.844 | 1.438 | 2.009 | 2.135 |
| SD | 2.054 | 1.006 | 1.177 | 0.637 | 0.485 | 0.621 | 0.732 | 0.586 | 0.828 | 0.800 |
| % Preservation | 58.33 | 66.67 | 75.00 | 66.67 | 100.00 | 66.67 | 91.67 | 66.67 | 91.67 | 66.67 |
| Pu1 (n = 4) | ||||||||||
| Mean | 6.460 | 3.090 | 4.250 | 1.960 | 1.965 | 1.470 | 2.653 | 1.858 | 2.595 | 2.335 |
| SD | NA | NA | NA | NA | 0.559 | 0.325 | 0.764 | 0.039 | 0.970 | NA |
| % Preservation | 25.00 | 25.00 | 25.00 | 25.00 | 50.00 | 50.00 | 75.00 | 50.00 | 100.00 | 25.00 |
| Pu3 (n = 3) | ||||||||||
| Mean | NA | 3.038 | 3.818 | 1.360 | 1.285 | 1.530 | 2.033 | 1.760 | 2.177 | 2.300 |
| SD | NA | 0.004 | 0.004 | 0.170 | 0.213 | 0.156 | 0.511 | 0.007 | 0.447 | 0.007 |
| % Preservation | 0.00 | 66.67 | 66.67 | 66.67 | 100.00 | 66.67 | 100.00 | 66.67 | 100.00 | 66.67 |
APPENDIX 24.
Means and standard deviations for therian measurements by biozone. We include all specimens except for the specimen in morphotype MeA, which lacked any measureable features. For measurement descriptions see Table 1; for data see Table 3 (data excludes minimum values). NA indicates no specimens preserved the measurement (i.e., NA for means) or only one specimen preserved the measurement (i.e., NA for SD). Bold values indicate specimen percent preservation (i.e., the number of specimens that preserve that measurement divided by the total number of specimens) greater than or equal to 80%. Abbreviations: BCA, Bug Creek Anthills specimens of mixed age (see text for details); n, number of specimens; Pu1, early Puercan 1 biozone; Pu3, late Puercan biozone; SD, standard deviation.
| TDW | AW | TLW | NCW | TW | CW | TL | CL | TD | CD | |
| Full Dataset (n = 14) | ||||||||||
| Mean | 9.560 | 7.189 | 7.414 | 4.713 | 2.438 | 4.836 | 3.084 | 3.026 | 2.708 | 4.416 |
| SD | 0.357 | 3.926 | 3.888 | 2.812 | 1.351 | 2.838 | 2.084 | 1.824 | 1.360 | 2.836 |
| % Preservation | 21.43 | 78.57 | 78.57 | 42.86 | 92.86 | 78.57 | 92.86 | 78.57 | 71.43 | 57.14 |
| Lancian (n = 2) | ||||||||||
| Mean | NA | 4.765 | 5.120 | 2.380 | 1.458 | 2.895 | 1.650 | 1.945 | 1.868 | NA |
| SD | NA | NA | NA | NA | 0.350 | NA | 0.438 | NA | 0.689 | NA |
| % Preservation | 0.00 | 50.00 | 50.00 | 50.00 | 100.00 | 50.00 | 100.00 | 50.00 | 100.00 | 0.00 |
| BCA (n = 6) | ||||||||||
| Mean | 9.560 | 5.492 | 5.773 | 3.860 | 1.881 | 3.583 | 1.980 | 2.133 | 2.429 | 2.724 |
| SD | 0.357 | 0.212 | 0.278 | 0.332 | 0.182 | 0.282 | 0.396 | 0.272 | 0.354 | 0.414 |
| % Preservation | 50.00 | 100.00 | 100.00 | 50.00 | 100.00 | 100.00 | 100.00 | 100.00 | 83.33 | 66.67 |
| Pu1 (n = 2) | ||||||||||
| Mean | NA | 10.685 | 10.850 | 4.015 | 2.950 | 7.620 | 4.575 | 5.110 | 4.720 | 7.525 |
| SD | NA | NA | NA | NA | NA | NA | NA | NA | 2.206 | NA |
| % Preservation | 0.00 | 50.00 | 50.00 | 50.00 | 50.00 | 50.00 | 50.00 | 50.00 | 100.00 | 50.00 |
| Pu3 (n = 4) | ||||||||||
| Mean | NA | 10.227 | 10.315 | 10.300 | 3.636 | 7.062 | 5.085 | 4.480 | 1.756 | 5.637 |
| SD | NA | 6.741 | 6.793 | NA | 1.987 | 4.708 | 2.676 | 2.852 | NA | 3.885 |
| % Preservation | 0.00 | 75.00 | 75.00 | 25.00 | 100.00 | 75.00 | 100.00 | 75.00 | 25.00 | 75.00 |
APPENDIX 25.
The results of One-Way ANOVAs of difference for all multituberculate measurements across all biozones. Asterisk indicates significant p-values (< 0.05). Both biozone (b) and residuals (r) values are given for Sum of Squares, df, and Mean Squares. See Table 1 for measurement details; see Table 2 for data and Appendix 26 for Tukey HSD results.
| TDW | AW | TLW | NCW | UCW | RCW | UCL | RCL | UCD | RCD | |||||||||||
| b | r | b | r | b | r | b | r | b | r | b | r | b | r | b | r | b | r | b | r | |
| Sum of Squares | 54.980 | 94.306 | 20.851 | 36.433 | 25.180 | 56.513 | 5.946 | 8.669 | 5.972 | 14.405 | 13.689 | 20.215 | 16.729 | 37.464 | 22.739 | 28.015 | 24.477 | 42.655 | 10.034 | 27.305 |
| df | 2 | 8 | 3 | 12 | 3 | 12 | 3 | 11 | 3 | 22 | 3 | 17 | 3 | 22 | 3 | 18 | 3 | 23 | 3 | 15 |
| Mean Squares | 27.490 | 11.788 | 6.950 | 3.036 | 8.393 | 4.709 | 1.982 | 0.788 | 1.991 | 0.655 | 4.563 | 1.189 | 5.576 | 1.703 | 7.580 | 1.556 | 8.159 | 1.855 | 3.345 | 1.820 |
| F | 2.332 | 2.289 | 1.782 | 2.515 | 3.040 | 3.837 | 3.275 | 4.870 | 4.399 | 1.837 | ||||||||||
| p-value | 0.159 | 0.130 | 0.130 | 0.112 | 0.050 | * | * | * | * | 0.184 | ||||||||||
APPENDIX 26.
Probabilities from Tukey honest significant difference (HSD) post hoc test of multituberculate measurements by biozones. Measurements subjected to the Tukey HSD test are those with significant ANOVA results: radial condyle width (RCW), ulnar condyle length (UCL), radial condyle length (RCL), and ulnar condyle depth (UCD). Significance indicated by the following: * for p < 0.05; ** for p < 0.01.
| Measurement | Lancian | BCA | Pu1 | Pu3 | |
| RCW | Lancian | - | * | 0.237 | 0.264 |
| BCA | * | - | 1.000 | 1.000 | |
| Pu1 | 0.237 | 1.000 | - | 1.000 | |
| Pu3 | 0.264 | 1.000 | 1.000 | - | |
| UCL | Lancian | - | * | 0.682 | 0.286 |
| BCA | * | - | 0.777 | 0.996 | |
| Pu1 | 0.682 | 0.777 | - | 0.936 | |
| Pu3 | 0.286 | 0.996 | 0.936 | - | |
| RCL | Lancian | - | ** | 0.310 | 0.267 |
| BCA | ** | - | 0.973 | 0.988 | |
| Pu1 | 0.310 | 0.973 | - | 1.000 | |
| Pu3 | 0.267 | 0.988 | 1.000 | - | |
| UCD | Lancian | - | * | 0.258 | 0.162 |
| BCA | * | - | 0.881 | 0.998 | |
| Pu1 | 0.258 | 0.881 | - | 0.977 | |
| Pu3 | 0.162 | 0.998 | 0.977 | - | |
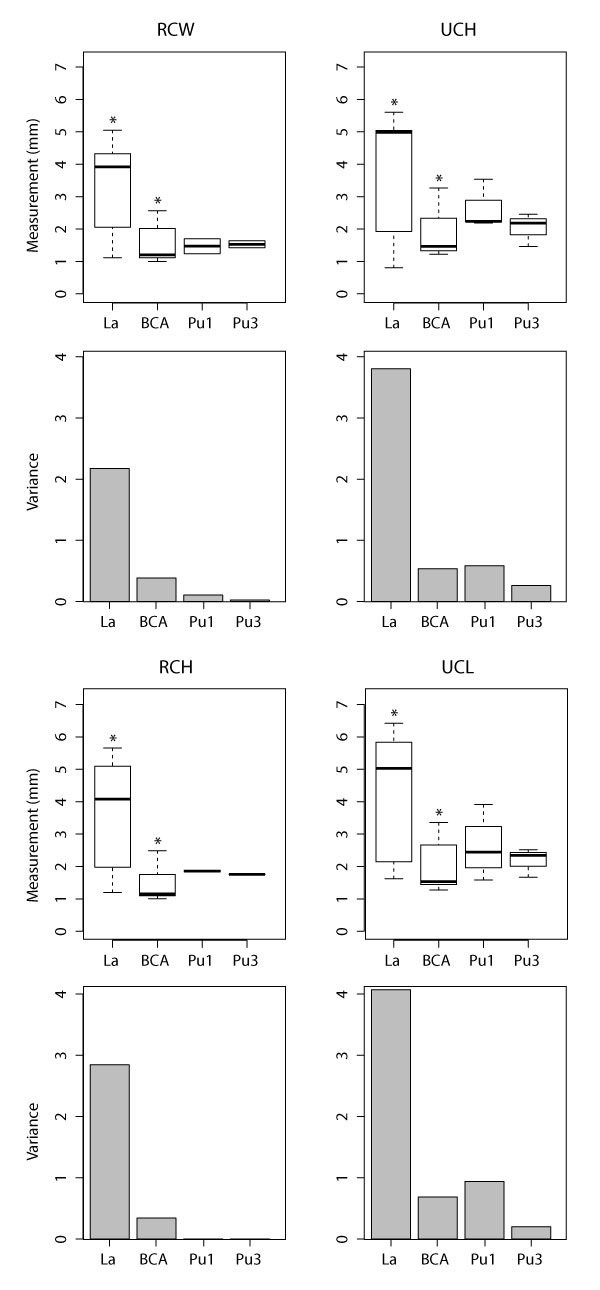
APPENDIX 27.
Boxplots (above) and variances (below) for each multituberculate measurement with significant ANOVA results according to biozone. Boxplots include minimum, quartiles, median, and maximum values. See Table 1 for measurements, Table 2 for data, Appendix 7 for means, and Appendix 25-Appendix 26 for ANOVA and Tukey HSD results, respectively. Asterisks indicate pairs of significantly different values in Tukey tests (i.e., Lancian specimens are significantly larger than BCA specimens for all measurements).
APPENDIX 28.
The results of One-Way ANOVAs of difference for all therians measurements across all biozones (for all measurements with specimens in at least three biozones, i.e., excluding TDW). Significance is as follows: * for p < 0.05; ** for p < 0.01. Both biozone (b) and residuals (r) values are given for Sum of Squares, df, and Mean Squares. See Table 1 for measurement details and Table 3 for data.
| AW | TLW | NCW | TW | CW | TL | CL | TD | CD | ||||||||||
| b | r | b | r | b | r | b | r | b | r | b | r | b | r | b | r | b | r | |
| Sum of Squares | 63.066 | 91.093 | 58.483 | 92.688 | 39.327 | 0.220 | 9.791 | 12.127 | 35.811 | 44.726 | 29.665 | 22.464 | 16.641 | 16.637 | 10.805 | 5.844 | 25.591 | 30.696 |
| df | 3 | 7 | 3 | 7 | 3 | 2 | 3 | 9 | 3 | 7 | 3 | 9 | 3 | 7 | 3 | 6 | 2 | 5 |
| Mean Squares |
21.022 | 13.013 | 19.494 | 13.241 | 13.109 | 0.110 | 3.264 | 1.347 | 11.937 | 6.389 | 9.888 | 2.496 | 5.547 | 2.377 | 3.602 | 0.974 | 12.795 | 6.139 |
| F | 1.615 | 1.472 | 119.066 | 2.422 | 1.868 | 3.962 | 2.334 | 3.698 | 2.084 | |||||||||
| p-value | 0.270 | 0.302 | ** | 0.133 | 0.223 | * | 0.160 | 0.081 | 0.220 | |||||||||
APPENDIX 29.
Probabilities from Tukey honest significant difference (HSD) post hoc test of therian measurements by biozones. Measurements subjected to the Tukey HSD test are those with significant ANOVA results, only entepicondyle condyle width (NCW) and trochlea depth (TL). Significance is as follows: * for p < 0.05; ** for p < 0.01.
| Measurement | Lancian | BCA | Pu1 | Pu3 | |
| NCW | Lancian | - | 0.147 | 0.176 | ** |
| BCA | 0.147 | - | 0.973 | ** | |
| Pu1 | 0.176 | 0.973 | - | * | |
| Pu3 | ** | ** | * | - | |
| TL | Lancian | - | 0.994 | 0.470 | 0.125 |
| BCA | 0.994 | - | 0.465 | 0.056 | |
| Pu1 | 0.470 | 0.465 | - | 0.991 | |
| Pu3 | 0.125 | 0.056 | 0.991 | - | |
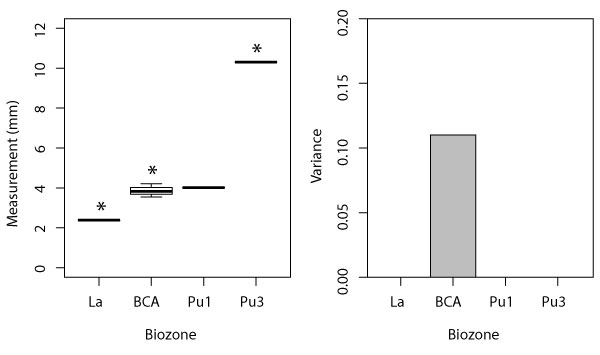
APPENDIX 30.
Boxplot (left) and variance (right) for eutherian NCW measurement, which had significant ANOVA results according to biozone. Boxplot includes minimum, quartiles, median, and maximum values; variance shown for biozones with n > 1. See Table 1 for measurements, Table 3 for data, Appendix 8 for means, and Appendix 28-Appendix 29 for ANOVA and Tukey HSD results, respectively. Asterisks indicate pairs of significantly different values in Tukey tests (i.e., Pu3 specimens are significantly larger than Lancian and BCA specimens).
APPENDIX 31.
Eigenvalues, proportion of variance, and cumulative variance explained from PCAs. We conducted PCAs on two separate datasets: one “full dataset” that included all modern taxa (Table 4), and one “reduced dataset” of eutherians that excluded carnivorans and lagomorphs (see text for more details). Of the 40 total principal components in each PCA, we report only PCs that explained at least 1% of the variance.
| Eigenvalues | Proportion of Variance |
Cumulative Variance |
||
| Full Dataset | ||||
| PC1 | 0.0067938 | 46% | 46% | |
| PC2 | 0.0018609 | 13% | 59% | |
| PC3 | 0.0016220 | 11% | 70% | |
| PC4 | 0.0011623 | 8% | 78% | |
| PC5 | 0.0007075 | 5% | 83% | |
| PC6 | 0.0004502 | 3% | 86% | |
| PC7 | 0.0003615 | 2% | 88% | |
| PC8 | 0.0003264 | 2% | 91% | |
| PC9 | 0.0003162 | 2% | 93% | |
| PC10 | 0.0002115 | 1% | 94% | |
| PC11 | 0.0001540 | 1% | 95% | |
| Reduced Dataset | ||||
| PC1 | 0.0042641 | 37% | 37% | |
| PC2 | 0.0021872 | 19% | 56% | |
| PC3 | 0.0015529 | 13% | 69% | |
| PC4 | 0.0007259 | 6% | 75% | |
| PC5 | 0.0007226 | 6% | 82% | |
| PC6 | 0.0004394 | 4% | 85% | |
| PC7 | 0.0003591 | 3% | 89% | |
| PC8 | 0.0003120 | 3% | 91% | |
| PC9 | 0.0002451 | 2% | 93% | |
| PC10 | 0.0001782 | 2% | 95% | |
| PC11 | 0.0001404 | 1% | 96% | |
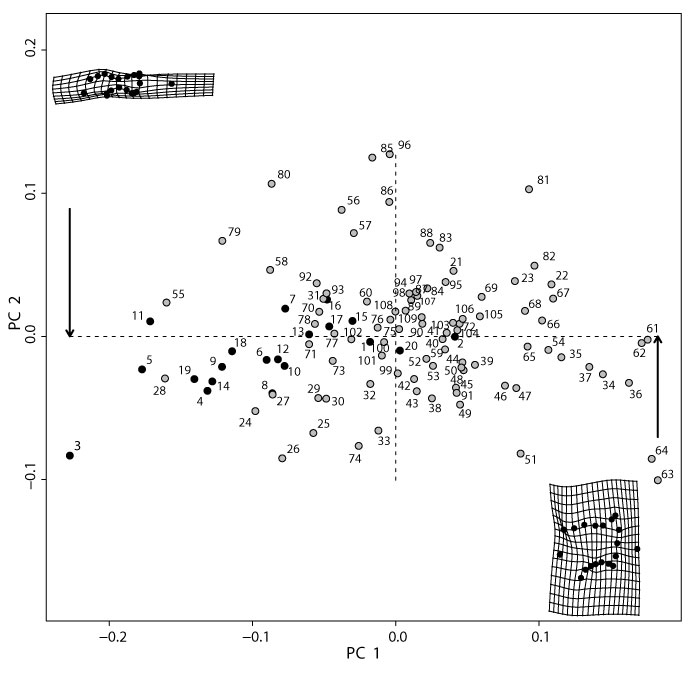
APPENDIX 32.
Principal Component Analysis (PCA) of all modern taxa with specimens labeled. PC1 and PC2 explain 46% and 13% of the total variance, respectively (Appendix 31). Partial warp shapes indicate the minimum and maximum of PC1 on a right humerus in distal view. Black circles are metatherians, gray circles are eutherians. See Table 4 for specimen information. We note the orientation of the maximum and minimum of PC1 is reversed here compared to Figure 3, Figure 20-Figure 21); this is a function of the arbitrary assignment of maximum and minimum in PC space, and it does not affect the shape interpretation.
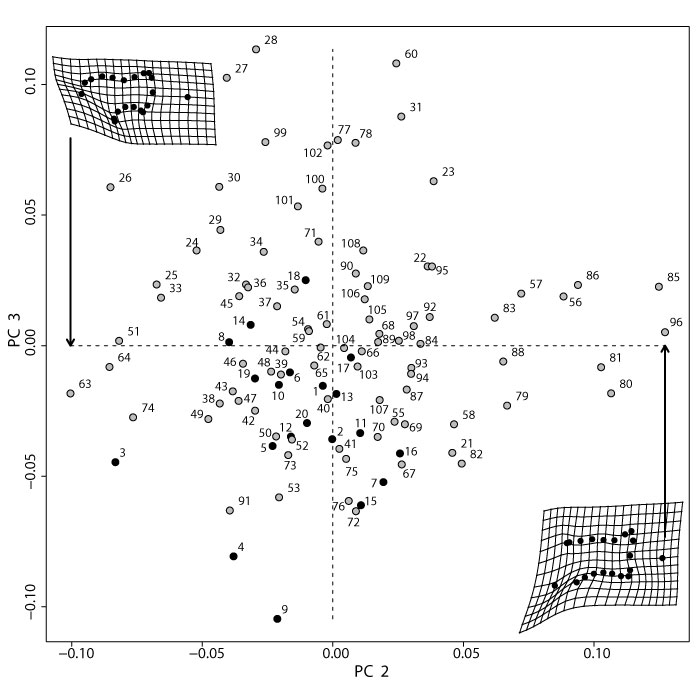
APPENDIX 33.
Principal Component Analysis (PCA) of all modern taxa with specimens labeled. PC2 and PC3 explain 13% and 11% of the total variance, respectively (Appendix 31). Partial warp shapes indicate the minimum and maximum of PC2. Black circles are metatherians, gray circles are eutherians. See Table 4 for specimen information.
APPENDIX 34.
LDA results for the reduced dataset of extant mammals with known locomotion. LDA analyses used all significant principal components (i.e., those which represented at least 1% of the variation).
| Locomotor Group Means | ||||||||
| A | F | G | S | Sa | Sc | Sf | T | |
| PC1 | 0.01276 | -0.00884 | 0.06054 | 0.05556 | -0.01318 | -0.03556 | -0.01427 | 0.02452 |
| PC2 | 0.02255 | -0.02874 | 0.03102 | -0.01765 | -0.07145 | 0.05872 | 0.00177 | 0.01686 |
| PC3 | 0.01071 | -0.00397 | -0.00655 | -0.00441 | 0.00296 | 0.04311 | -0.01621 | 0.00011 |
| PC4 | -0.00049 | -0.01497 | 0.00582 | 0.00888 | 0.01229 | 0.00693 | 0.00257 | 0.02051 |
| PC5 | 0.00474 | -0.00238 | -0.03417 | 0.00849 | -0.00719 | -0.00493 | 0.00250 | 0.00677 |
| PC6 | 0.01928 | -0.00531 | 0.00733 | -0.02232 | -0.00779 | -0.01032 | -0.00525 | -0.01245 |
| PC7 | -0.00652 | -0.00415 | 0.01422 | -0.00893 | 0.01796 | 0.02135 | -0.01010 | 0.01034 |
| PC8 | -0.00155 | 0.00139 | 0.01861 | 0.00473 | 0.00458 | -0.00357 | 0.00581 | -0.00768 |
| PC9 | 0.00265 | 0.00418 | 0.00749 | -0.00980 | 0.00657 | -0.01905 | -0.00713 | 0.00275 |
| PC10 | 0.00117 | -0.00358 | -0.00796 | 0.00495 | 0.00051 | -0.00717 | 0.00358 | -0.00140 |
| PC11 | 0.00427 | 0.00338 | 0.00415 | 0.00051 | -0.00679 | 0.00198 | -0.00687 | -0.00108 |
| Coefficients of Linear Discriminants | ||||||
| LD1 | LD2 | LD3 | LD4 | LD5 | LD6 | |
| PC1 | 2.94717 | 2.27578 | 2.17796 | 9.41316 | -6.31096 | -4.86250 |
| PC2 | 26.91399 | 13.17848 | -4.77661 | 4.56211 | 2.92216 | 0.42556 |
| PC3 | 7.31164 | 6.68984 | 1.18431 | -11.66506 | 2.81487 | -1.24342 |
| PC4 | -5.70621 | 22.80368 | -3.22197 | 4.88143 | -18.81627 | 11.10793 |
| PC5 | 2.06893 | -3.58513 | -21.96368 | -10.27321 | -13.82449 | -4.63802 |
| PC6 | 48.82373 | -21.34994 | 19.54012 | -11.13995 | -10.35859 | 23.00979 |
| PC7 | -20.15756 | 43.27913 | 29.14487 | -15.39684 | 0.14397 | 3.82854 |
| PC8 | -6.88752 | -9.20087 | 17.93410 | 29.18532 | 19.67257 | 17.61627 |
| PC9 | -3.79714 | -16.85835 | 37.88225 | -4.34904 | -33.12376 | -12.11852 |
| PC10 | -4.01667 | -13.76100 | -24.49836 | 5.73548 | -20.80180 | 21.90751 |
| PC11 | 44.60443 | -8.70142 | 17.22111 | -4.55220 | 6.04990 | -51.18676 |
| Proportions of Trace |
50.42% | 21.25% | 13.29% | 5.64% | 4.95% | 3.18% |
APPENDIX 35.
LDA predictions for locomotor mode for modern specimens in this study. LDA correctly predicts locomotor mode of modern specimens with an accuracy of 74.19%. Published locomotor mode (LM) is indicated, as well as predicted locomotor mode; asterisks indicate specimens whose locomotor mode was incorrectly predicted. See Table 4 for additional specimen information.
| Specimen | Genus | species | Family | Order | Code | LM | LM Prediction | |
| S2008 | Potamogale | velox | Potamogalidae | Afrosoricida | 21 | Sa | T* | |
| 39039 | Dendrohyrax | arboreus | Procaviidae | Afrosoricida | 22 | A | A | |
| 39038 | Dendrohyrax | arboreus | Procaviidae | Afrosoricida | 23 | A | Sf* | |
| S2008 | Limnogale | mergulus | Tenrecidae | Afrosoricida | 24 | Sa | F* | |
| 34168 | Echinops | telfairi | Tenrecidae | Afrosoricida | 25 | Sc | Sc | |
| S2008 | Echinops | telfairi | Tenrecidae | Afrosoricida | 26 | Sc | T* | |
| S2008 | Hemicentetes | semispinosus | Tenrecidae | Afrosoricida | 27 | Sf | T* | |
| S2008 | Oryzorictes | sp. | Tenrecidae | Afrosoricida | 28 | Sf | Sf | |
| S2008 | Setifer | setosus | Tenrecidae | Afrosoricida | 29 | T | T | |
| S2008 | Tenrec | ecaudatus | Tenrecidae | Afrosoricida | 30 | T | T | |
| S2008 | Microgale | cowani | Tenrecidae | Afrosoricida | 31 | T | T | |
| S2008 | Microgale | dobsoni | Tenrecidae | Afrosoricida | 32 | T | T | |
| S2008 | Microgale | talazaci | Tenrecidae | Afrosoricida | 33 | T | Sc* | |
| 34167 | Cabassous | centralis | Dasypodidae | Cingulata | 55 | F | Sa* | |
| 20735 | Dasypus | novemcinctus | Dasypodidae | Cingulata | 56 | F | F | |
| 22458 | Dasypus | novemcinctus | Dasypodidae | Cingulata | 57 | F | F | |
| 35468 | Euphractus | sexcinctus | Dasypodidae | Cingulata | 58 | F | F | |
| S2008 | Echinosorex | gymnurus | Erinaceidae | Erinaceomorpha | 59 | T | T | |
| S2008 | Solenodon | paradoxus | Solenodontidae | Soricomorpha | 60 | Sf | Sf | |
| S2008 | Petrodromus | tetradactylus | Macroscelididae | Macroscelidea | 67 | S | T* | |
| 35475 | Elephantulus | rufescens | Macroscelididae | Macroscelidea | 68 | T | T | |
| 34189 | Elephantulus | rufescens | Macroscelididae | Macroscelidea | 69 | T | T | |
| 39003 | Callithrix | pygmaea | Cebidae | Primates | 70 | A | A | |
| 39005 | Callithrix | pygmaea | Cebidae | Primates | 71 | A | A | |
| 75541 | Leontopithecus | chrysomela | Cebidae | Primates | 72 | A | A | |
| 35406 | Saguinus | oedipus | Cebidae | Primates | 73 | A | A | |
| 35405 | Saguinus | oedipus | Cebidae | Primates | 74 | A | A | |
| 82302 | Saimiri | sciureus | Cebidae | Primates | 75 | A | A | |
| 39014 | Saimiri | sciureus | Cebidae | Primates | 76 | A | A | |
| 34071 | Aplodontia | rufa | Aplodontiidae | Rodentia | 77 | F | Sf* | |
| 34058 | Aplodontia | rufa | Aplodontiidae | Rodentia | 78 | F | Sf* | |
| 34116 | Castor | canadensis | Castoridae | Rodentia | 79 | Sa | Sa | |
| 34588 | Castor | canadensis | Castoridae | Rodentia | 80 | Sa | Sa | |
| 72830 | Cavia | porcellus | Caviidae | Rodentia | 81 | T | T | |
| 72831 | Cavia | porcellus | Caviidae | Rodentia | 82 | T | T | |
| 76622 | Microtus | pennsylvanicus | Cricetidae | Rodentia | 83 | F | F | |
| 34326 | Microtus | pennsylvanicus | Cricetidae | Rodentia | 84 | F | F | |
| 34324 | Ondatra | zibethicus | Cricetidae | Rodentia | 85 | Sa | Sa | |
| 72879 | Ondatra | zibethicus | Cricetidae | Rodentia | 86 | Sa | Sa | |
| 66559 | Synaptomys | borealis | Cricetidae | Rodentia | 87 | Sf | F* | |
| 66561 | Synaptomys | borealis | Cricetidae | Rodentia | 88 | Sf | Sf | |
| 76721 | Zapus | princeps | Dipodidae | Rodentia | 89 | S | Sf* | |
| 75136 | Zapus | princeps | Dipodidae | Rodentia | 90 | S | S | |
| 34176 | Coendou | prehensilis | Erethizontidae | Rodentia | 91 | Sc | Sc | |
| 44624 | Thomomys | bottae | Geomyidae | Rodentia | 92 | F | F | |
| 38261 | Thomomys | bottae | Geomyidae | Rodentia | 93 | F | F | |
| 47378 | Chaetodipus | fallax | Heteromyidae | Rodentia | 94 | F | S* | |
| 47379 | Chaetodipus | fallax | Heteromyidae | Rodentia | 95 | F | A* | |
| 78740 | Dipodomys | deserti | Heteromyidae | Rodentia | 96 | S | F* | |
| 48984 | Octodon | degus | Octodontidae | Rodentia | 97 | Sf | A* | |
| 39501 | Octodon | degus | Octodontidae | Rodentia | 98 | Sf | Sf | |
| 35278 | Sciurus | aberti | Sciuridae | Rodentia | 99 | A | A | |
| 82349 | Sciurus | aberti | Sciuridae | Rodentia | 100 | A | A | |
| 20646 | Sciurus | carolinensis | Sciuridae | Rodentia | 101 | A | A | |
| 30010 | Sciurus | carolinensis | Sciuridae | Rodentia | 102 | A | A | |
| 36334 | Glaucomys | sabrinus | Sciuridae | Rodentia | 103 | G | G | |
| 35129 | Glaucomys | sabrinus | Sciuridae | Rodentia | 104 | G | G | |
| 43897 | Glaucomys | volans | Sciuridae | Rodentia | 105 | G | G | |
| 32254 | Glaucomys | volans | Sciuridae | Rodentia | 106 | G | G | |
| 75774 | Cynomys | ludovicianus | Sciuridae | Rodentia | 107 | Sf | Sf | |
| 34227 | Tupaia | glis | Tupaiidae | Scandentia | 108 | A | A | |
| 34225 | Tupaia | glis | Tupaiidae | Scandentia | 109 | A | A | |
APPENDIX 36.
LDA results and predicted locomotor mode for fossil specimens in this study. Prediction probabilities that are in bold are the top ranked locomotor mode (i.e., rank of 1); all ranks are shown for predictions probabilities, but percentages are shown only for > 0.00%. Abbreviations: Spec. Number, specimen number; Loc. locality; M. morphotype; Bioz., biozone.
| Spec. Number |
Prediction Probabilities | Rank | |||||||||||||||||
| Loc. | M. | Bioz. | A | F | G | S | Sa | Sc | Sf | T | 1 | 2 | 3 | 4 | 5 | 6 | 7 | 8 | |
| 97114 | C1115 | EuB | La | 99.39% | 0.17% | 0.44% | A | Sf | F | T | Sc | S | G | Sa | |||||
| 151991 | V71203 | EuC | BCA | 27.10% | 9.44% | 0.02% | 0.17% | 0.16% | 61.01% | 2.10% | Sf | A | F | T | S | Sc | G | Sa | |
| 151964 | V65127 | EuD | BCA | 0.82% | 93.29% | 0.04% | 5.85% | F | Sf | A | S | Sa | T | G | Sc | ||||
| 153036 | V65127 | EuD | BCA | 25.36% | 23.94% | 0.07% | 50.54% | 0.09% | Sf | F | A | T | S | Sc | Sa | G | |||
