FIGURE 1. Early Cretaceous Cedar Mountain Formation surface exposure, elevation, and fossil localities.
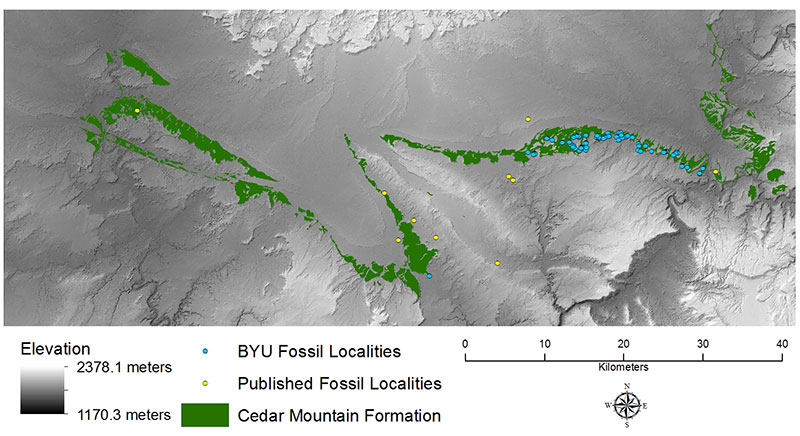
FIGURE 2. Landsat 8 natural color composite image centered on the Cedar Mountain Formation.
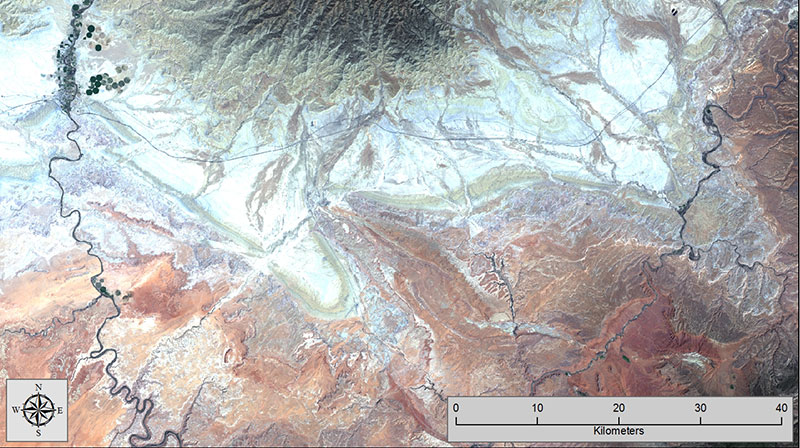
FIGURE 3. Slope and Aspect data for the Cedar Mountain Formation.
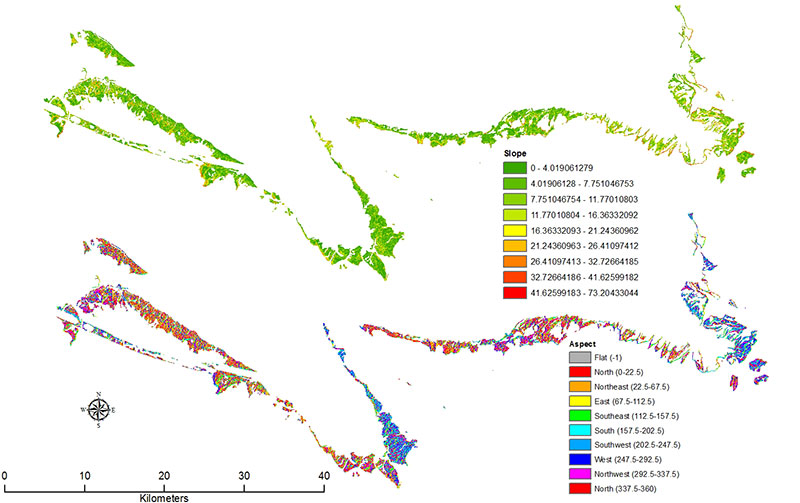
FIGURE 4. Simplified flowchart showing methodology.
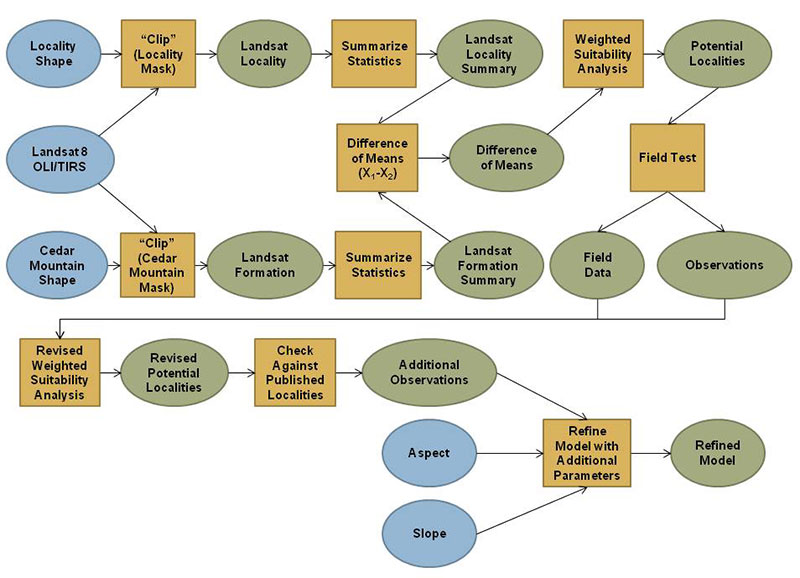
FIGURE 5. Differences of means between fossil localities and Cedar Mountain Formation (X1-X2).
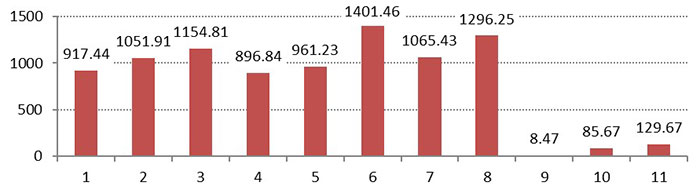
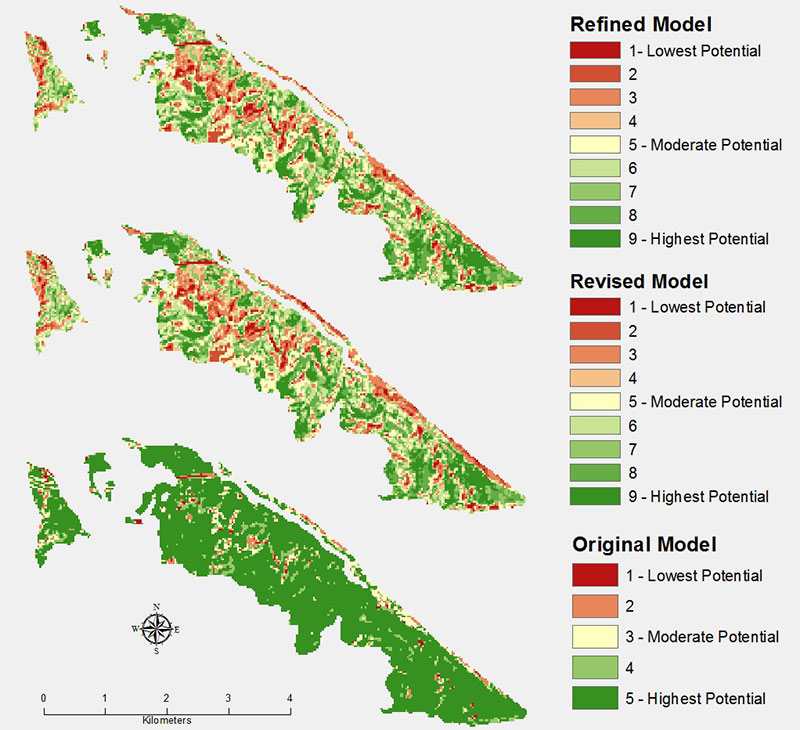
FIGURE 6. Weighted suitability analysis results.
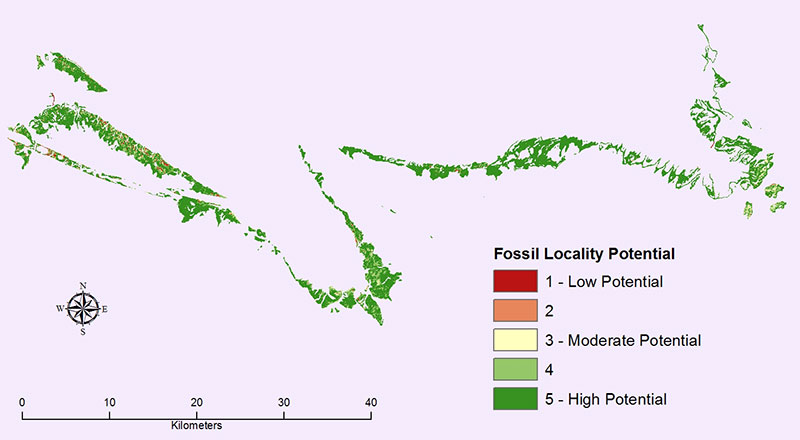
FIGURE 7. Photos of the 10 test sites. Numbers correspond to those in Table 5.
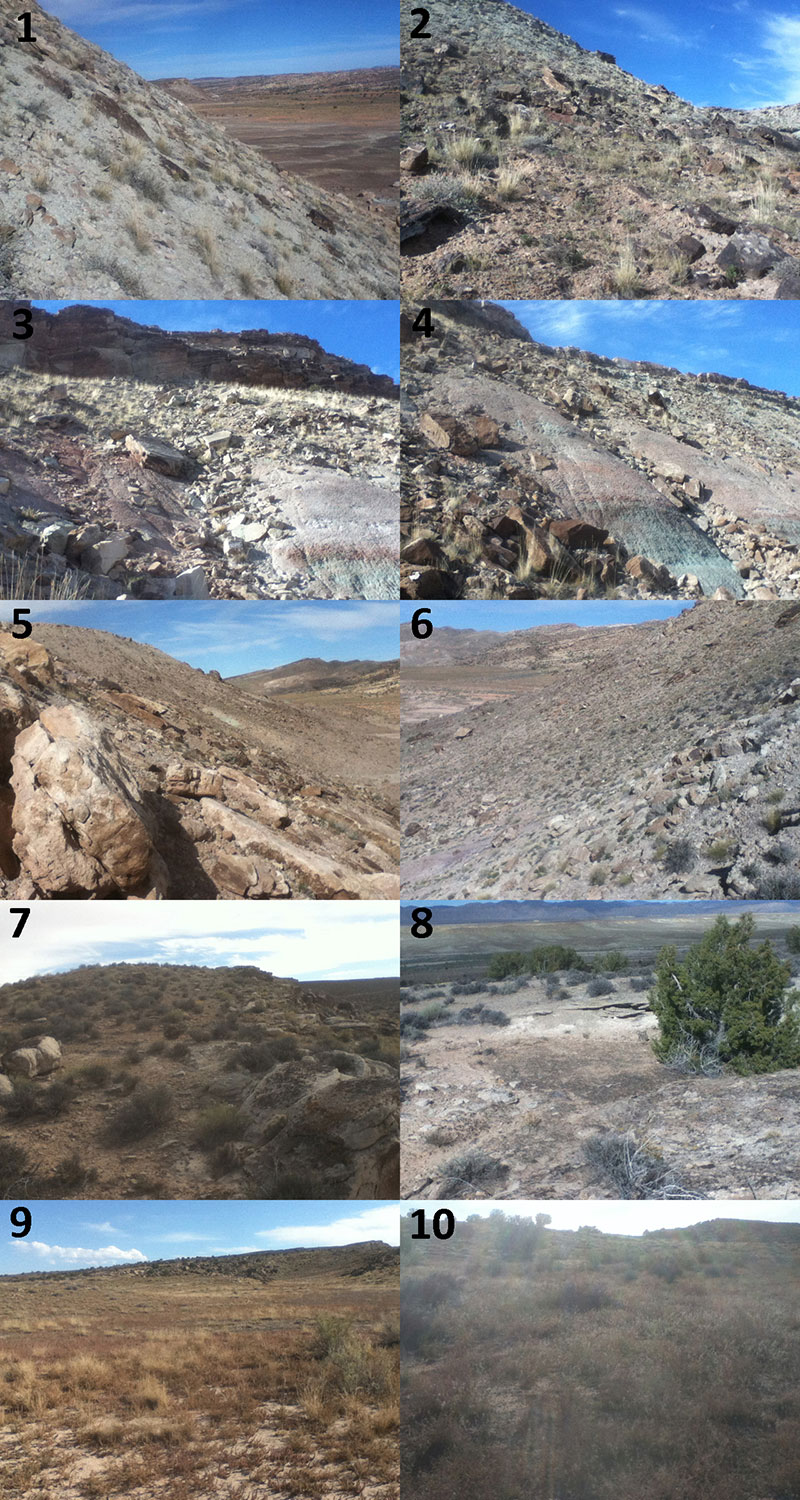
FIGURE 8. Number of cells assigned to each fossil potential value for the model.
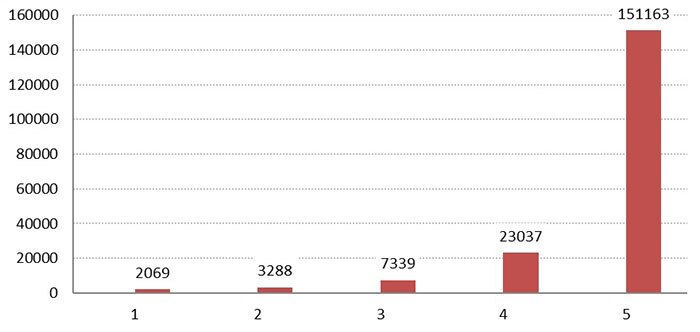
FIGURE 9. Revised weighted suitability analysis results.
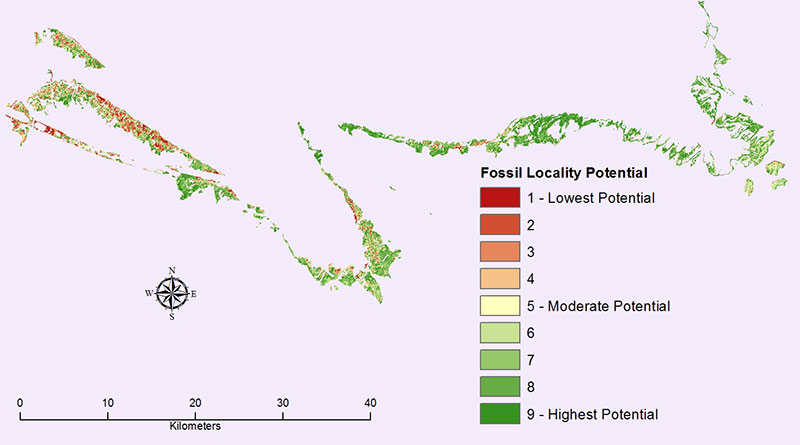
FIGURE 10. Number of cells assigned to each fossil potential value for the revised model.
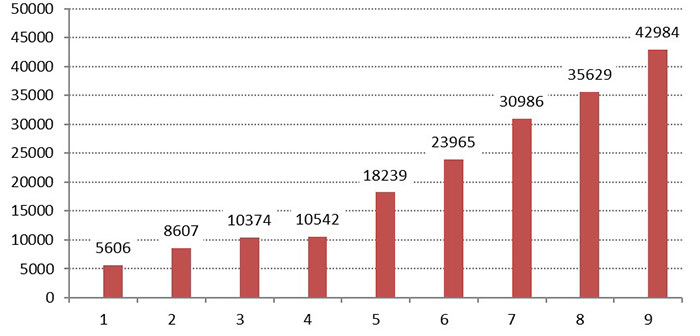
FIGURE 11. Comparison of aspects between the entire Cedar Mountain Formation and BYU fossil localities.
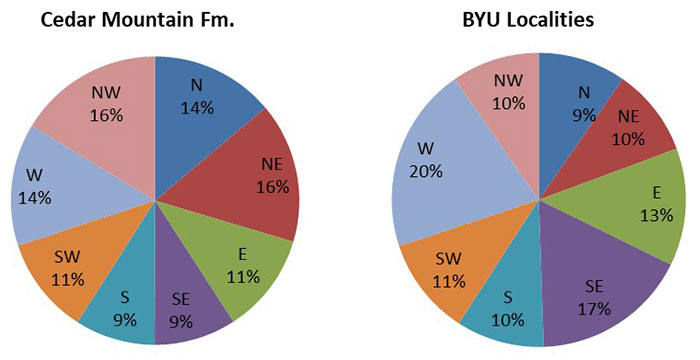
FIGURE 12. Comparison of slopes between the entire Cedar Mountain Formation and BYU fossil localities.
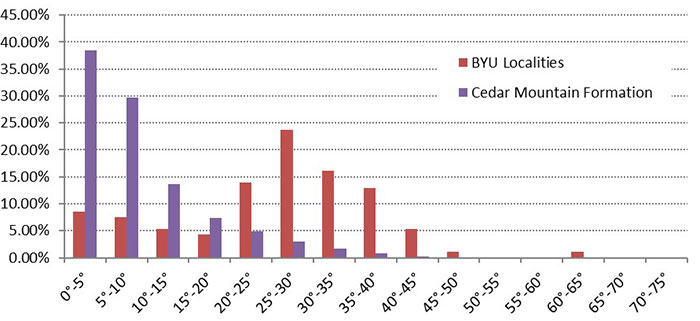
FIGURE 13. Refined model results.
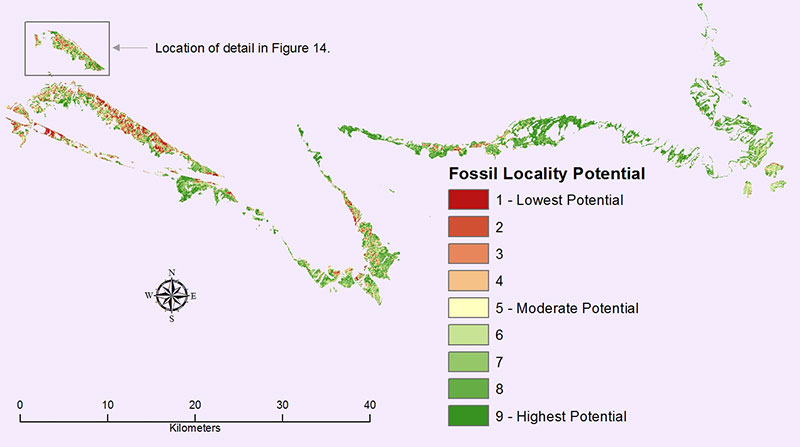
FIGURE 14. Detailed comparison of model versions.