

FIGURE 4. Specimen GS 26-1. 4.2. Sectional view of 3D OCT data. (Click on image for OCT scan animation).
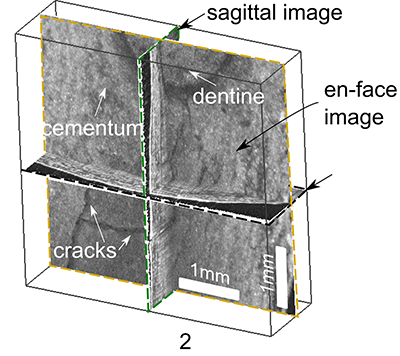
4.4. µ-CT en-face scan. (click on animation for animated µ-CT scan).
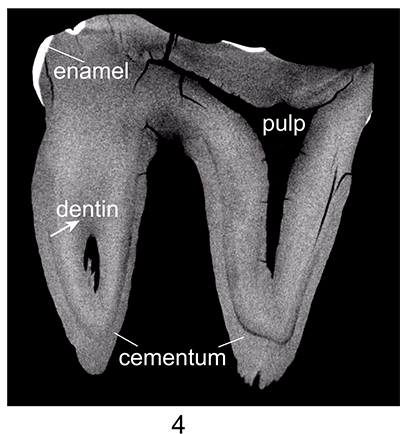
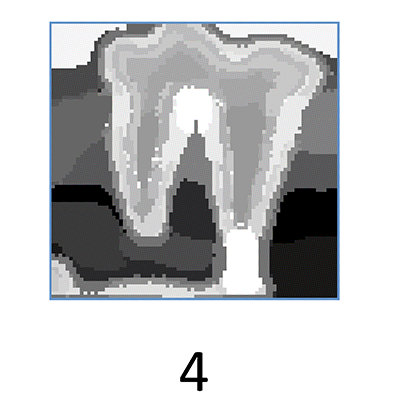
FIGURE 8. Image processing and hyper spectral data analysis: 8.4. Result of automatic classification by applying the two step partitional clustering method (k=20) based on the reduced feature set. For comparison: click on image for animation of the result applying a Preclustering-based agglomerative hierarchical clustering method (40 clusters and 100 preclusters).
 Poster Winners 2024
 The Princeton Field Guide to Mesozoic Sea Reptiles