


FIGURE 1. Comparison between the diversity count of Jurassic-Paleogene marine crocodylomorphs (excluding metriorhynchoids) of Martin et al. (2014) (excluding Pelagosaurus typus), with the data obtained in the present work after several corrections. All the data is phylogenetically corrected. The data used in the present work includes four new species, corrections for the number of Machimosaurus species, and taxonomical corrections (see text).
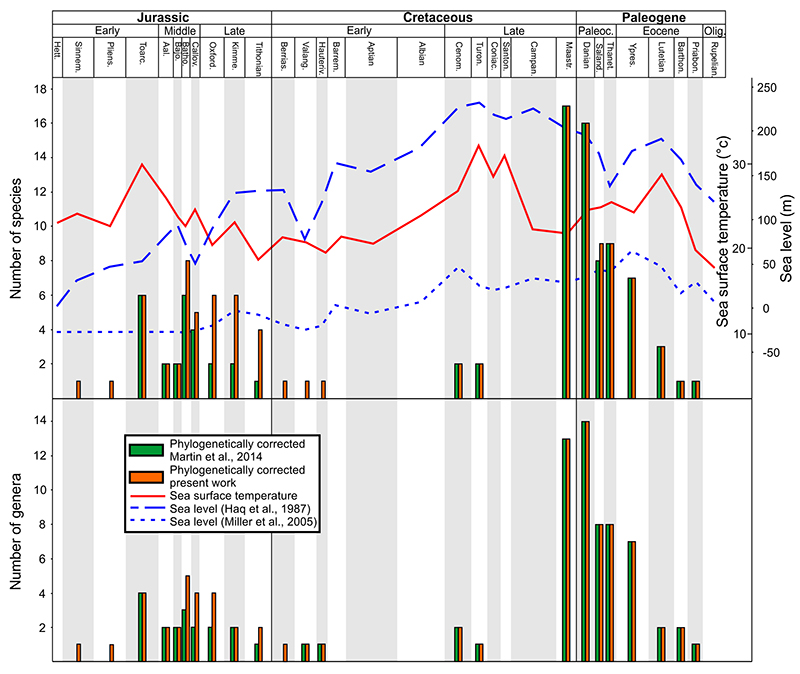
FIGURE 2. Comparison of the crocodylomorph species diversity used in various studies. 1, comparison of the number of species used for each marine crocodylomorph group; 2, comparison of the per cent of each group and of the genus Steneosaurus in the marine crocodylomorph diversity used (with and without metriorhynchoids).
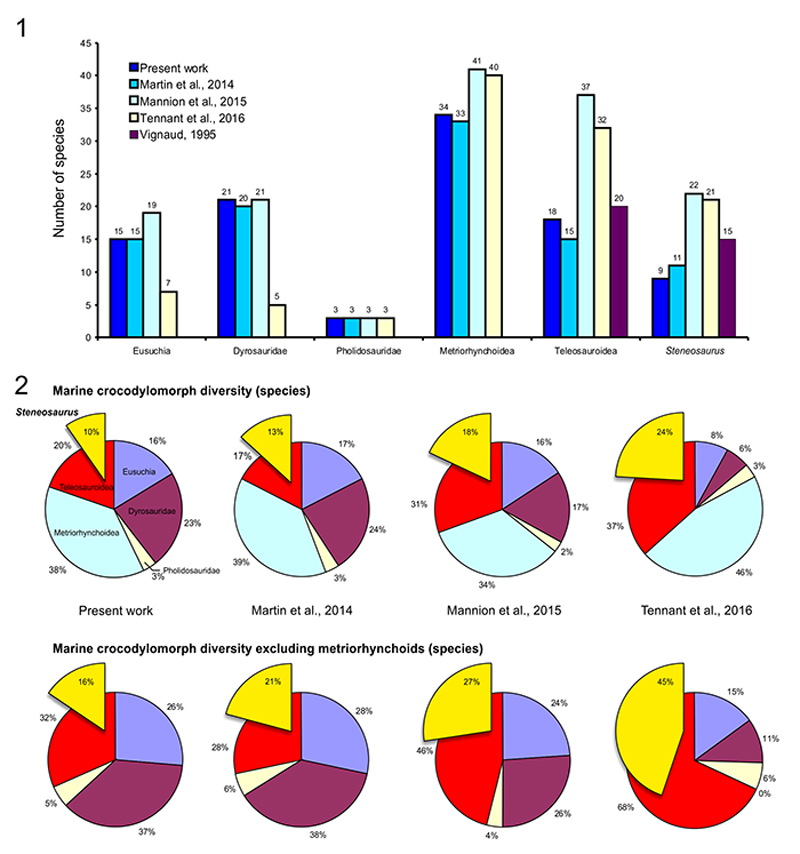
FIGURE 3. Comparison of the crocodylomorph genus diversity used in various studies. 1, comparison of the number of genera used for each marine crocodylomorph group; 2, comparison of the percent of each group used in the marine crocodylomorph diversity (with and without metriorhynchoids).
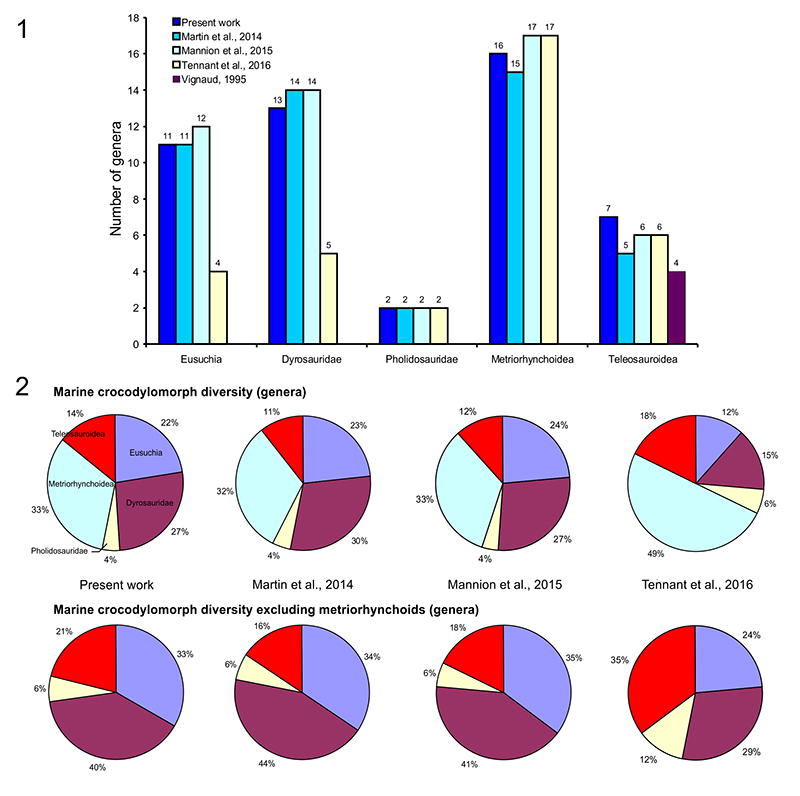
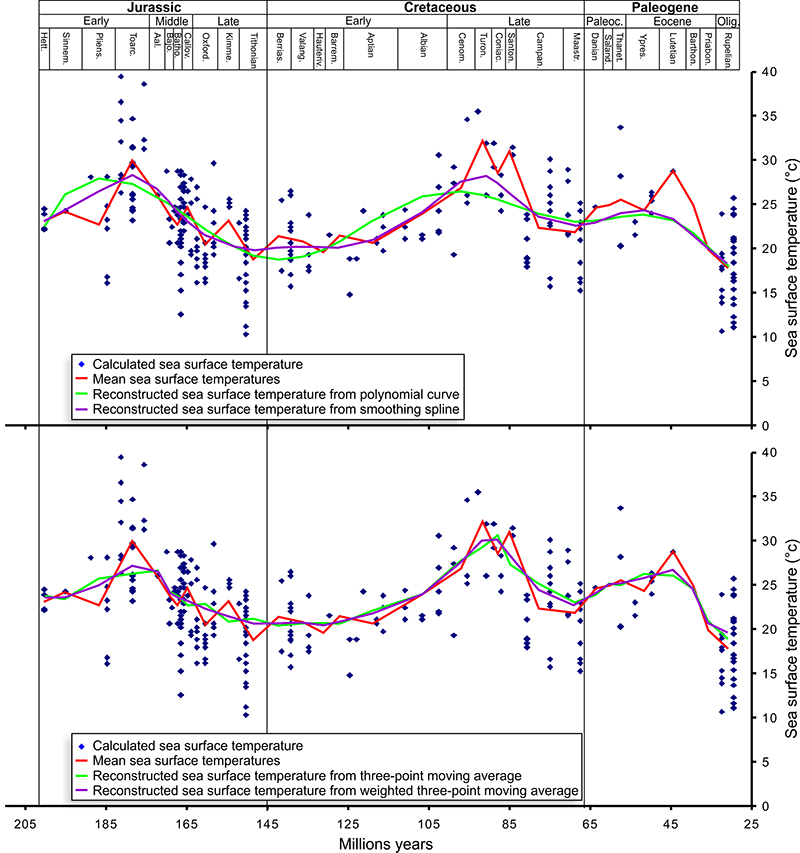
FIGURE 4. Evolution of the sea surface temperature. Comparison of the raw data (Martin et al., 2014) with the curve obtained with the mean for each time interval and the curve obtained with the theoretical data calculated from the polynomial curve, smoothing spline, and two curves with three-point moving average and with weighted three-point moving average approaches.

 A Review of Handbook of Paleoichthyology Volume 8a: Actinopterygii I, Palaeoniscimorpha, Stem Neopterygii, Chondrostei
 Palaeontologia Electronica among the most influential palaeontological journals