

Article Search
Volume 27.1
January–April 2024
Full table of contents
ISSN: 1094-8074, web version;
1935-3952, print version
Recent Research Articles
See all articles in 27.1 January-April 2024
See all articles in 26.3 September-December 2023
See all articles in 26.2 May-August 2023
See all articles in 26.1 January-April 2023
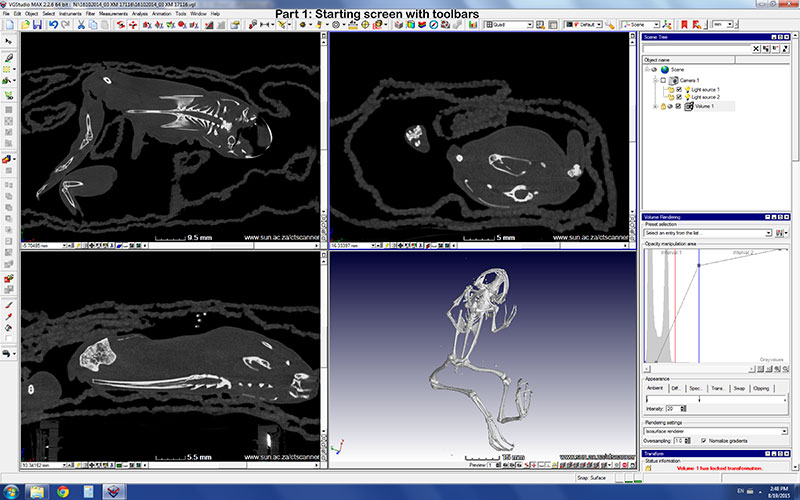
Part 1. Starting Screen with Toolbars
Part 2. Region growing
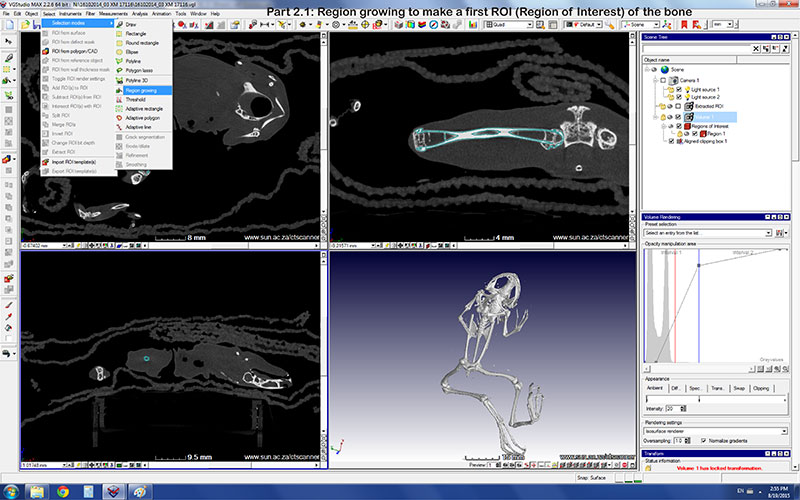
2.1. Region growing to make a first ROI (Region of Interest) of the bone.
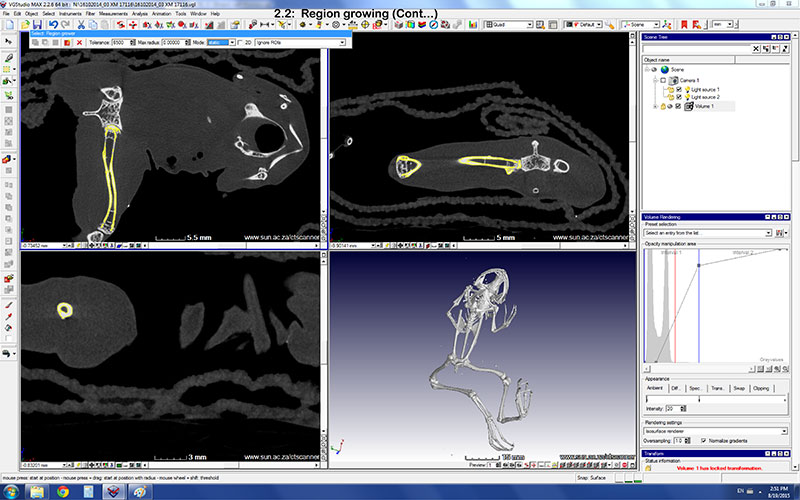
2.2. Region growing (continued).
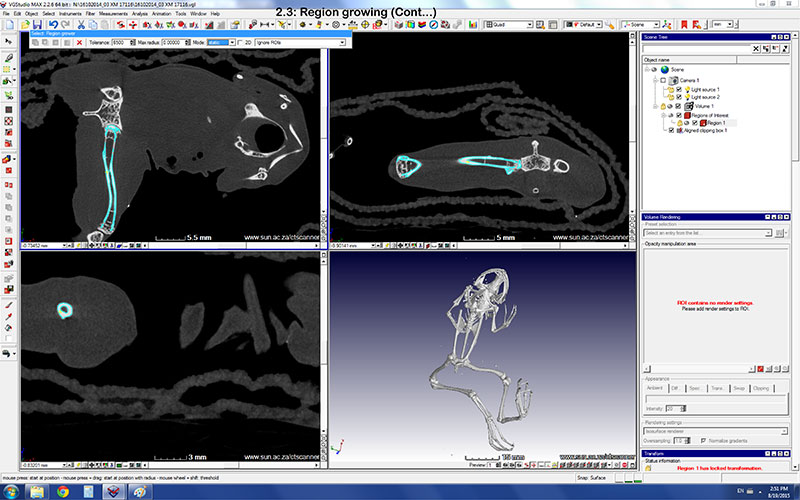
2.3. Region growing (continued).
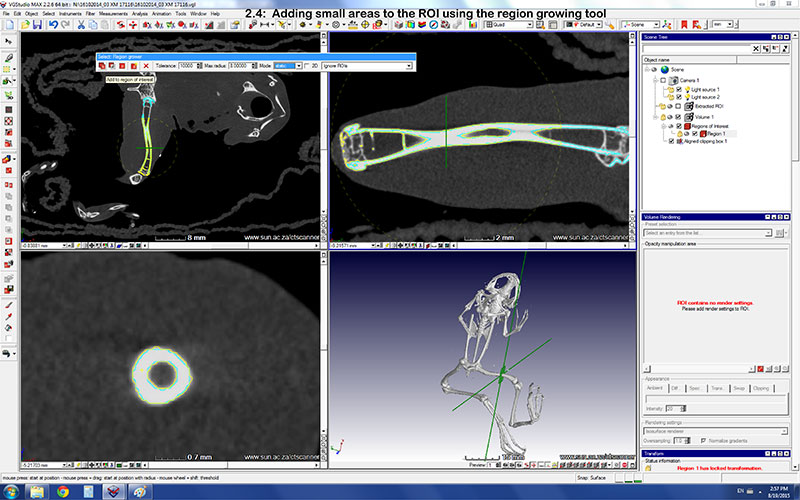
2.4. Adding small areas to the ROI using the region growing tool.
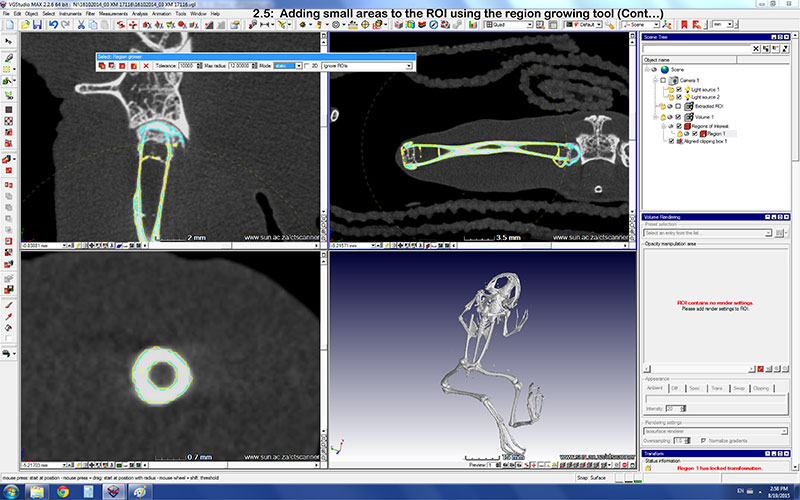
2.5. Adding small areas to the ROI using the region growing tool (continued).
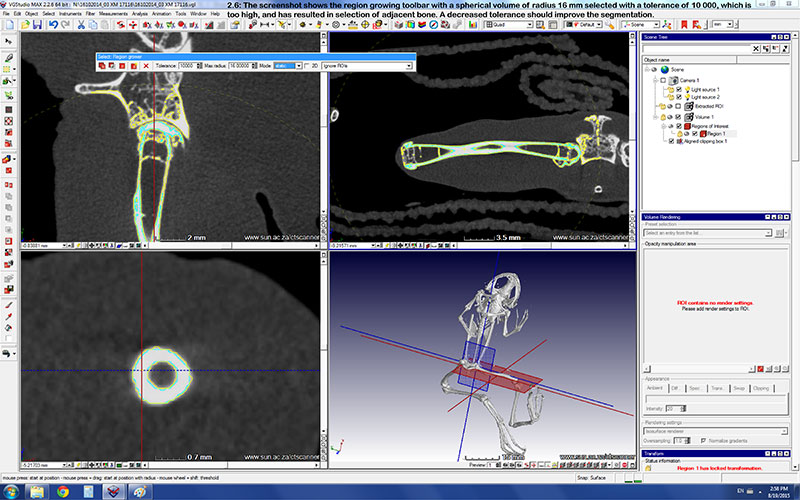
2.6. The screenshot shows the region growing toolbar with a spherical volume of radius 16mm selected with a tolerance of 10 000, which is too high, and has resulted in selection of adjacent bone. A decreased tolerance should improve the segmentation.
Part 3. Segmenting
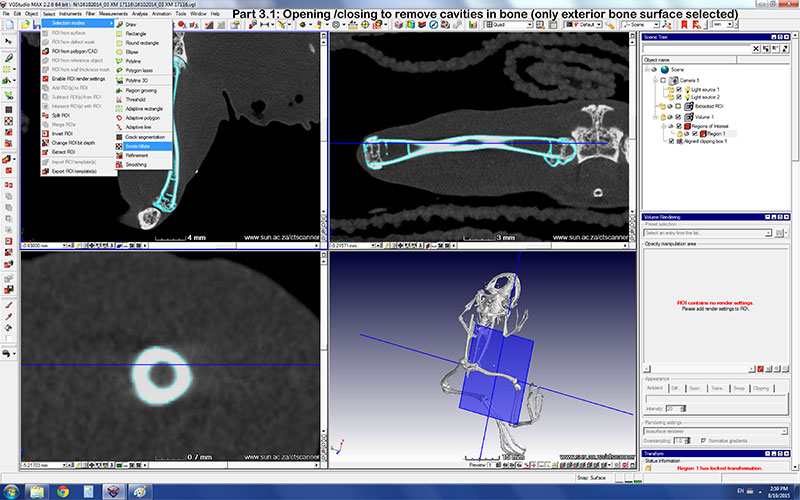
3.1. Opening/closing to remove cavities in bone (only exterior bone surface selected).
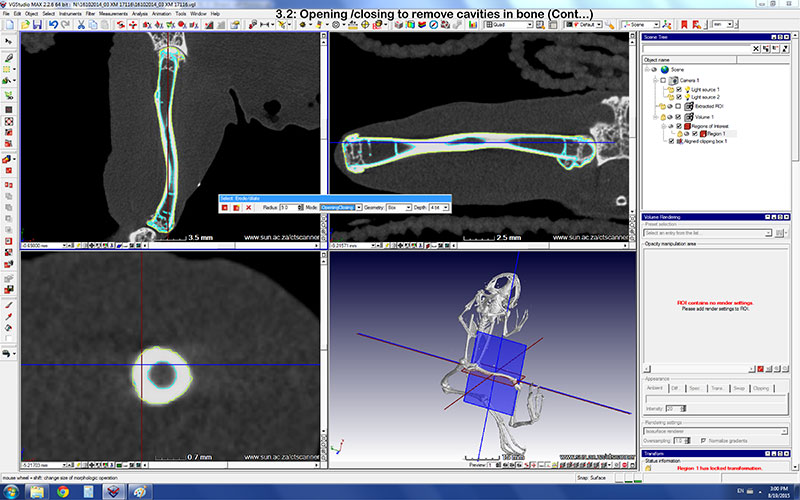
3.2. Opening/closing to remove cavities in bone (continued).
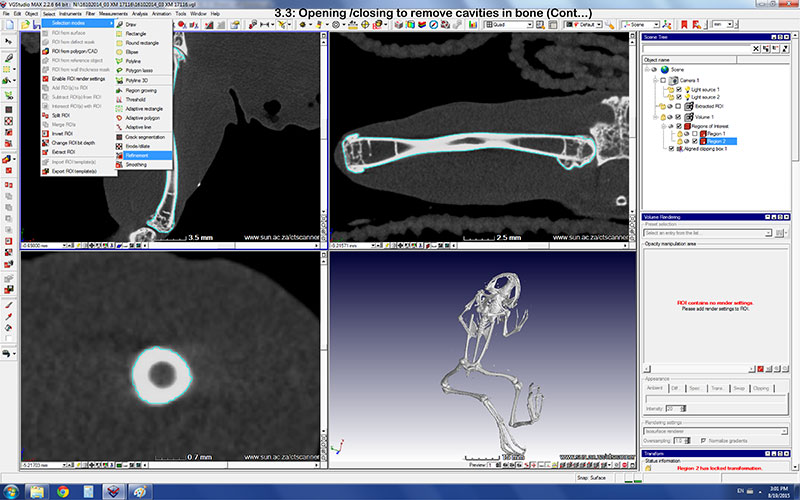
3.3. Opening/closing to remove cavities in bone (continued).
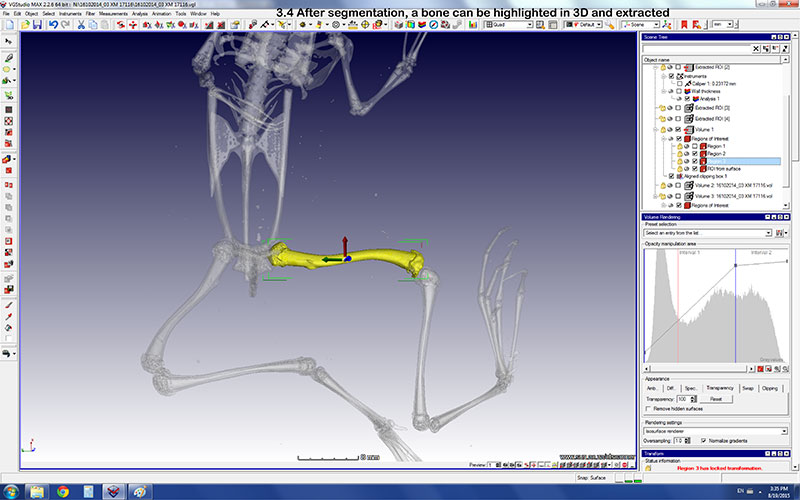
3.4. After segmentation, a bone can be highlighted in 3D and extracted.
Part 4. Setting threshold values
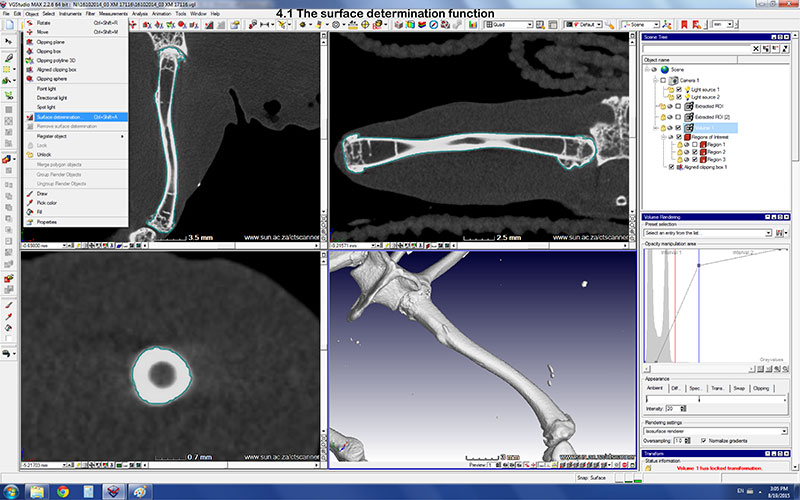
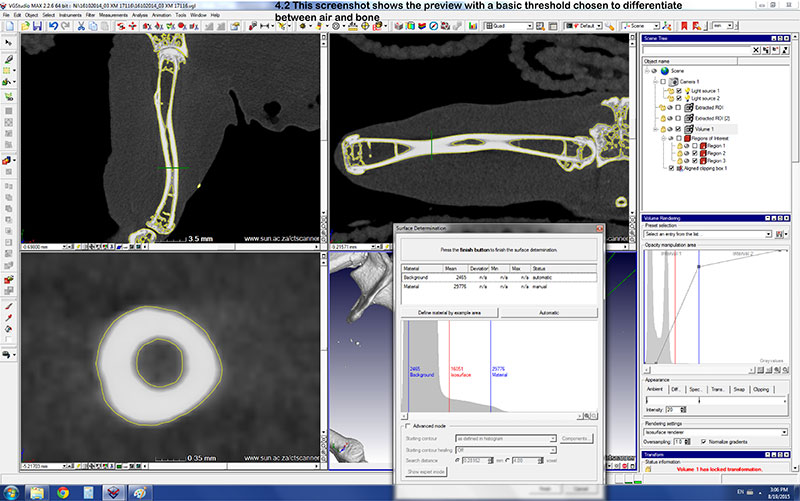
4.1. The surface determination function.
4.2. This screenshot shows the surface determination preview with a basic threshold chosen to differentiate between air and bone.
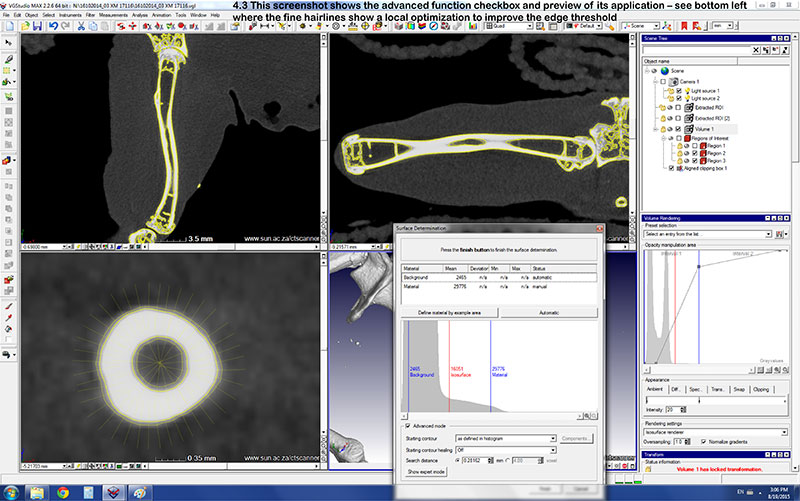
4.3. This screenshot shows the advanced function checkbox and preview of its application - see bottom left where the fine hairlines show a local optimization to improve the edge threshold.
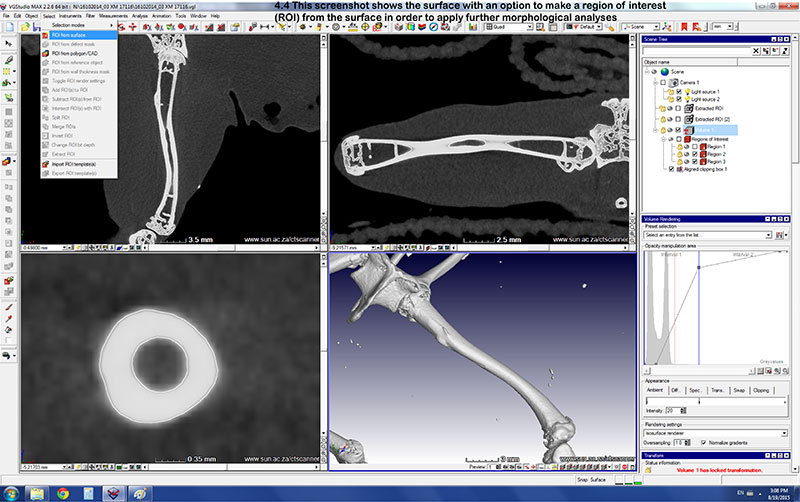
4.4. This screenshot shows the surface with an option to make a ROI from the surface in order to apply further morphological analyses.
Part 5. Wall thickness
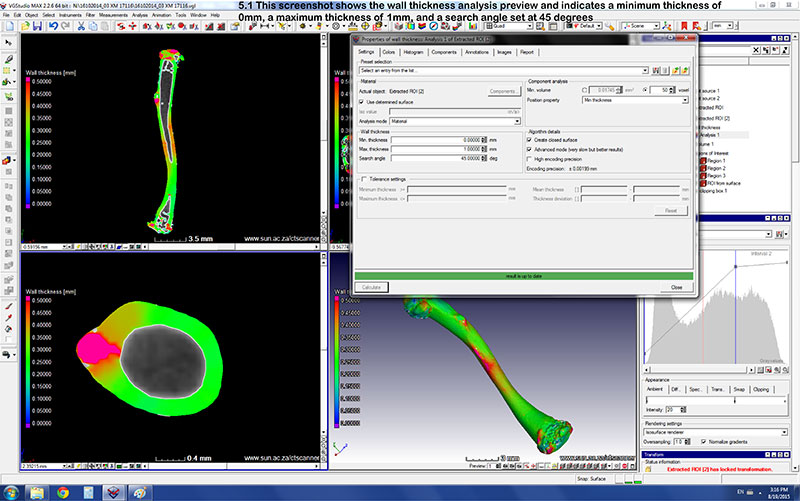
5.1. This screenshot shows the wall thickness analysis preview and indicates a minimum thickness of 0 mm, a maximum thickness of 1 mm, and a search angle set at 45 degrees.
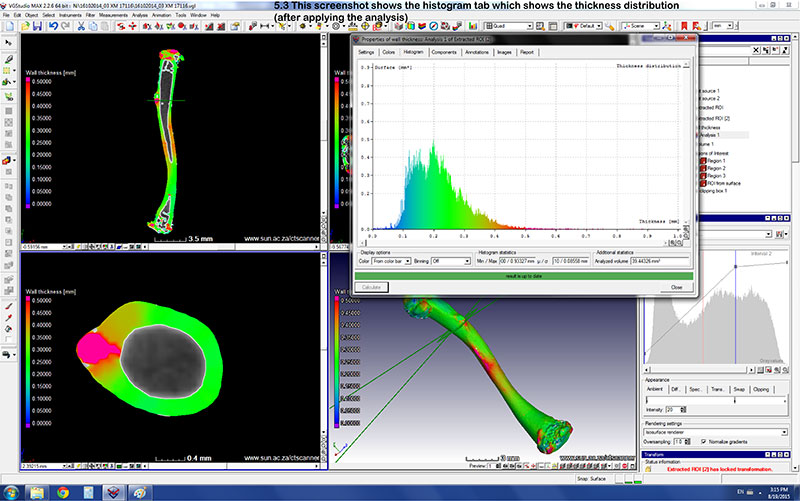
5.2. This screenshot shows the histogram tab which shows the thickness distribution (after applying the analysis).
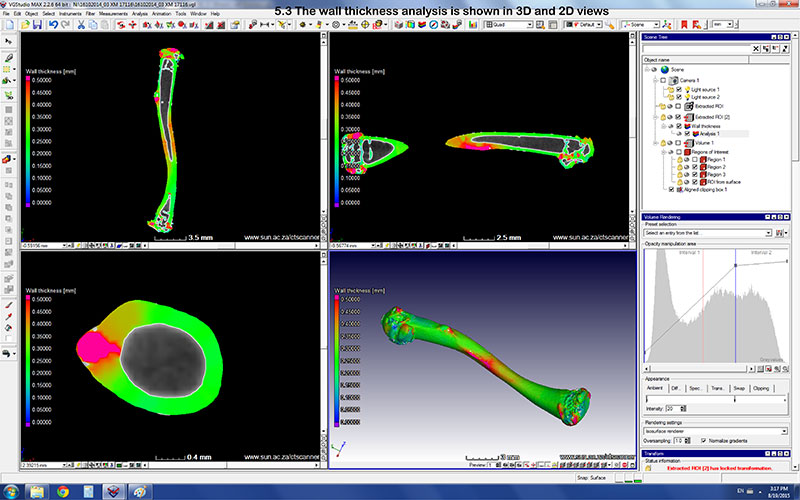
5.3. The wall thickness analysis is shown in 3D and 2D views.
Part 6. Using the virtual calipers
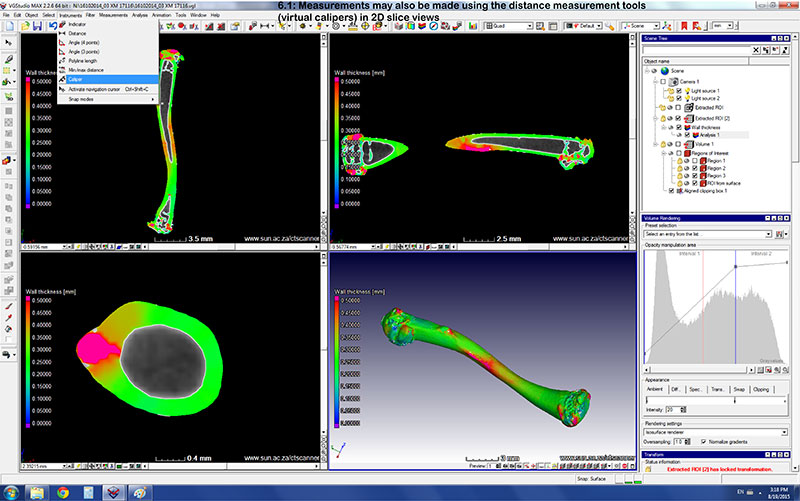
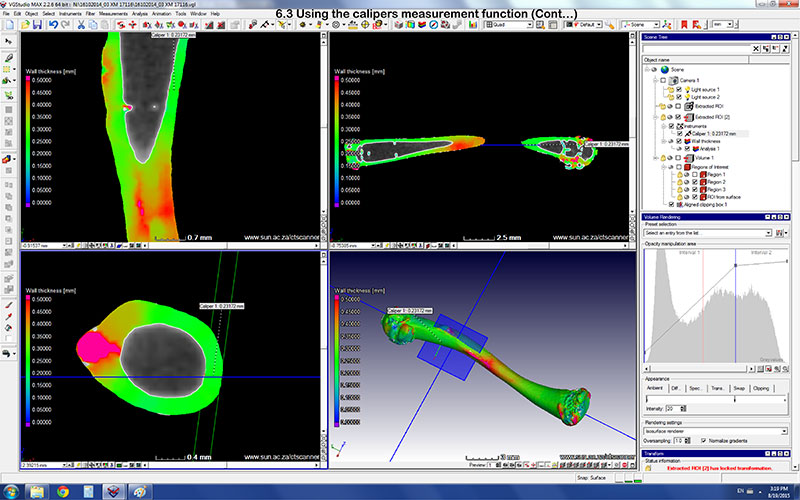
6.1. Measurements may also be made using the distance measurement tools (virtual calipers) in 2D slice views.
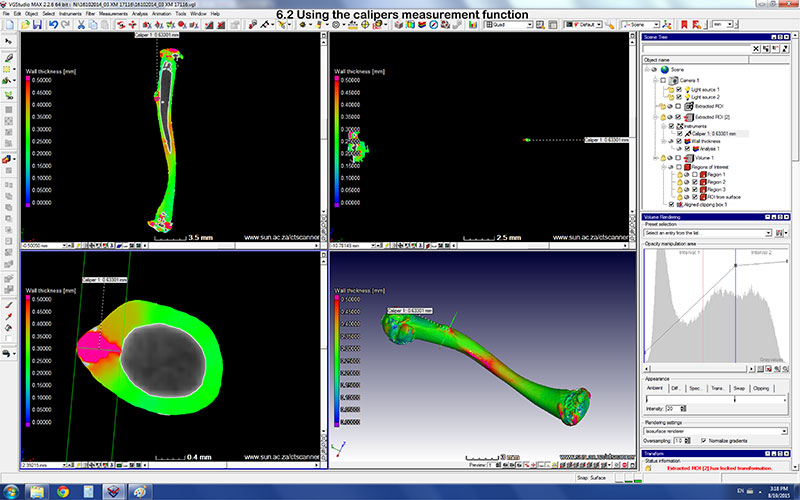
6.2. Using the calipers measurement function.
6.3. Using the calipers measurement function (continued).
Part 7. Mirror axis option
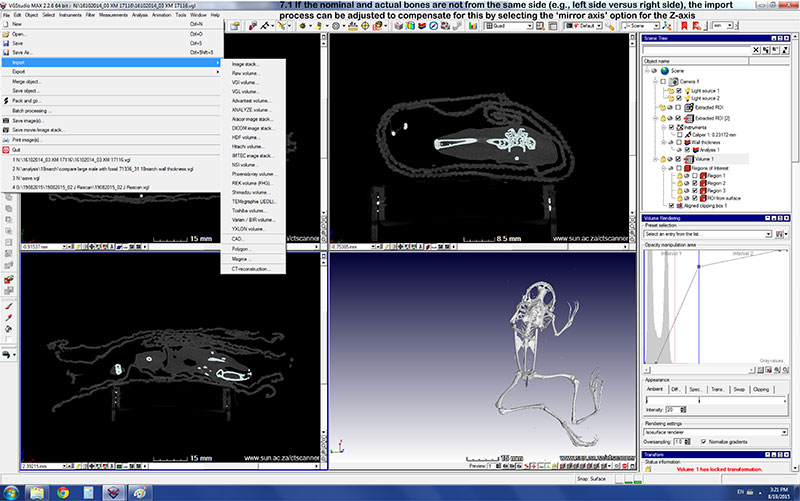
7.1. If the nominal and actual bones are not from the same side (e.g., left side versus right side), the import process can be adjusted to compensate for this by selecting the ‘mirror axis’ option for the Z-axis.
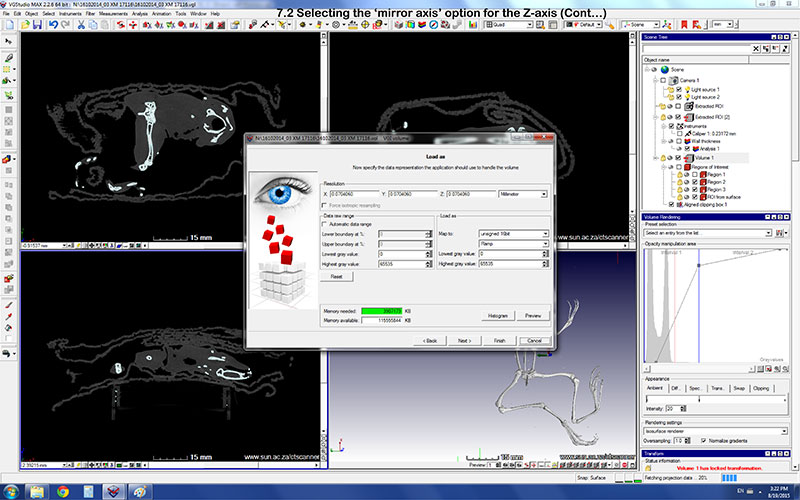
7.2. Selecting the ‘mirror axis’ option for the Z-axis (continued).
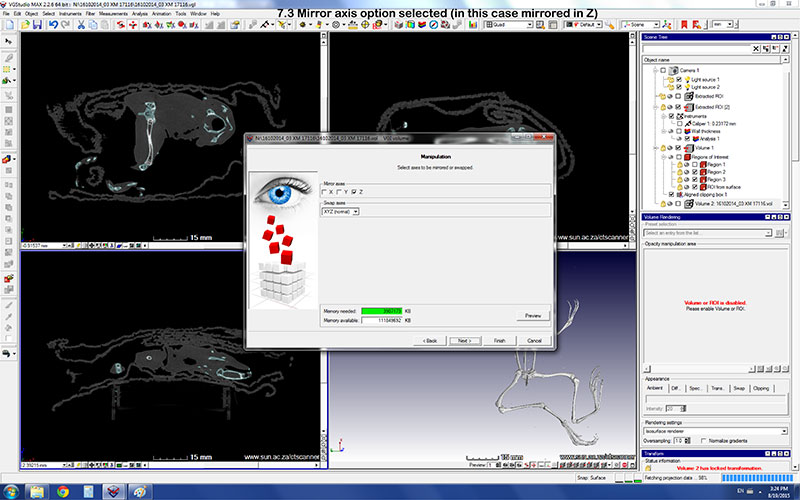
7.3. Mirror axis option selected (in this case mirrored in Z).
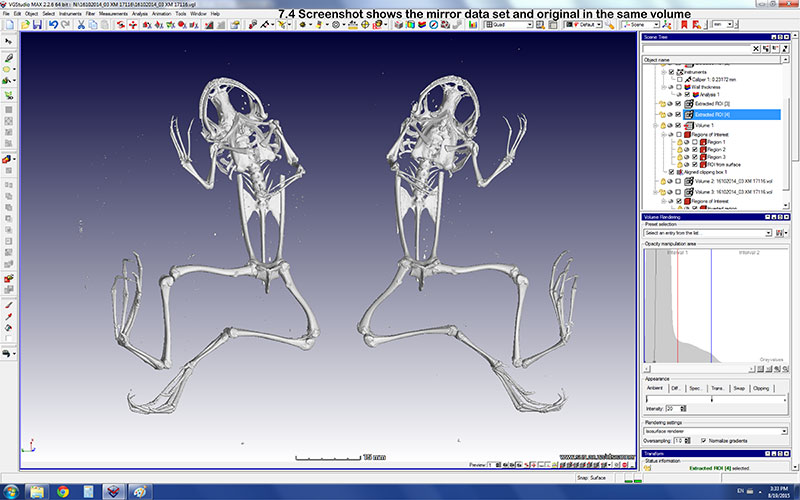
7.4. Screenshot shows the mirror data set and original in the same volume.
Part 8. Surface determination
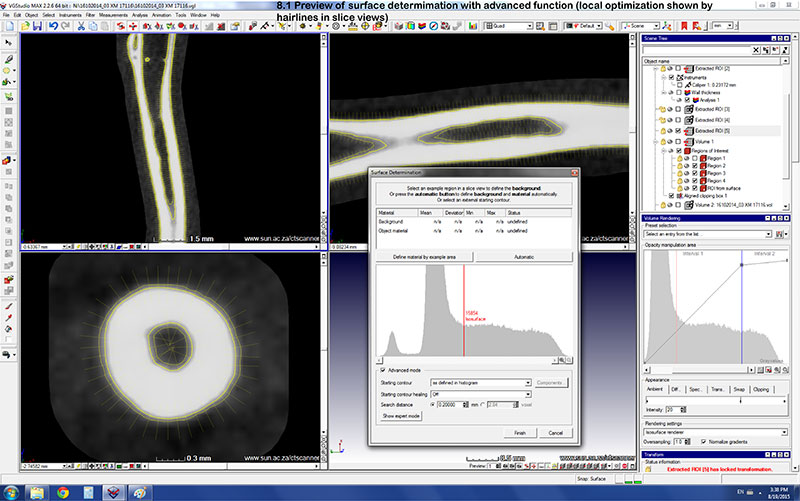
8.1. Preview of surface determimation with advanced function (local optimization shown by hairlines in slice views).
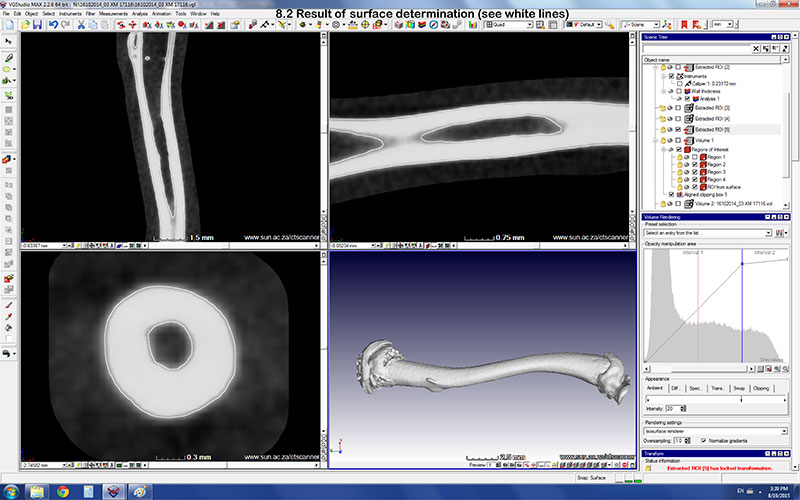
8.2. Result of surface determination (see white lines).
8.3. Surface determination illustrated using a lower threshold.
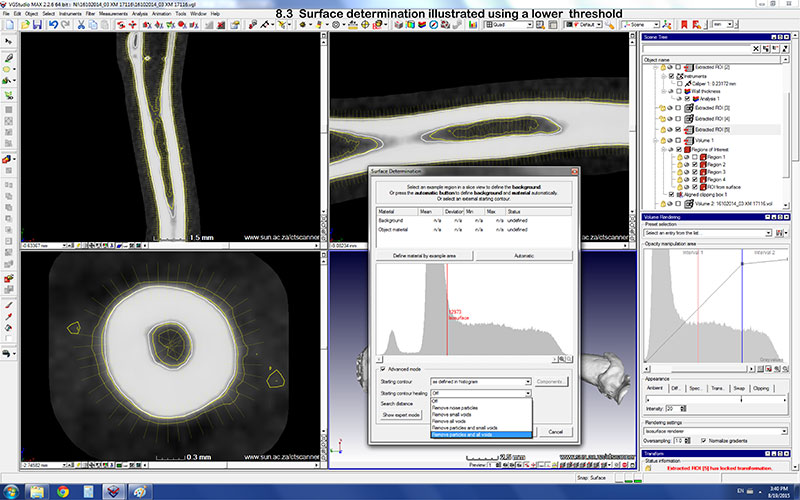
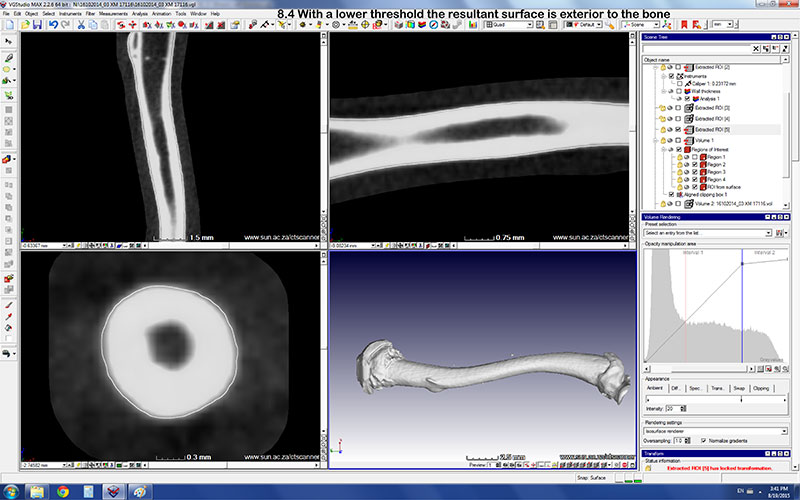
8.4. With a lower threshold the resultant surface is exterior to the bone.
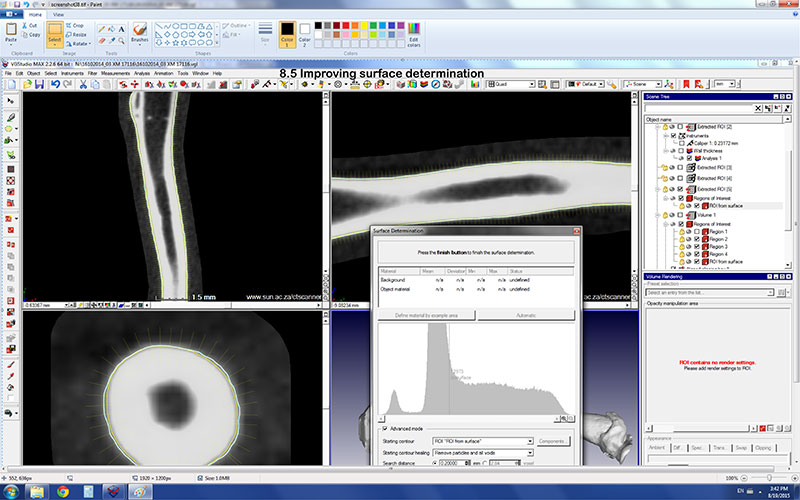
8.5. Improving surface determination.
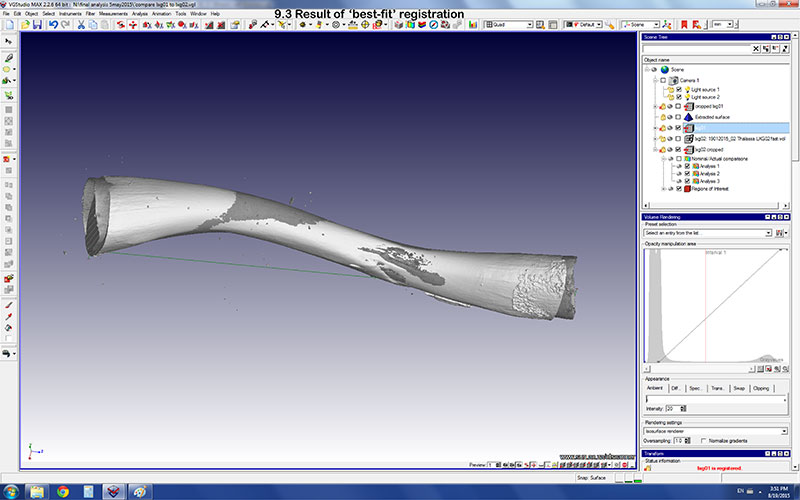
Part 9. ‘Best-fit’ registration
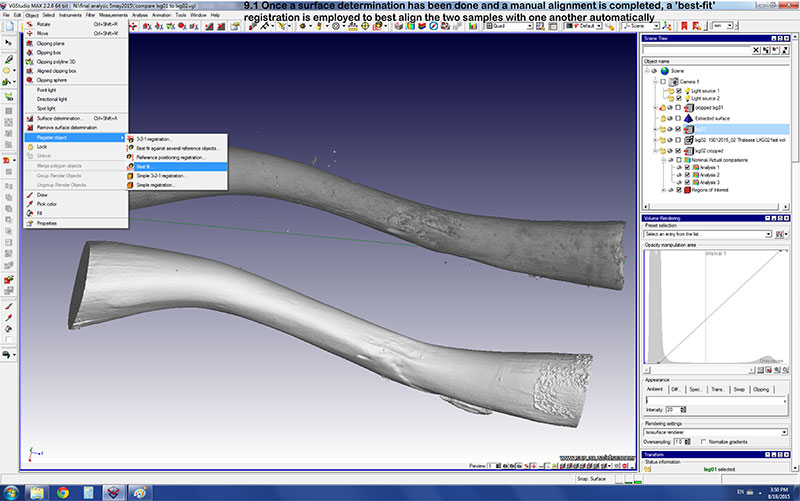
9.1. Once a surface determination has been done and a manual alignment is completed, a ’best-fit’ registration is employed to best align the two samples with one another automatically.
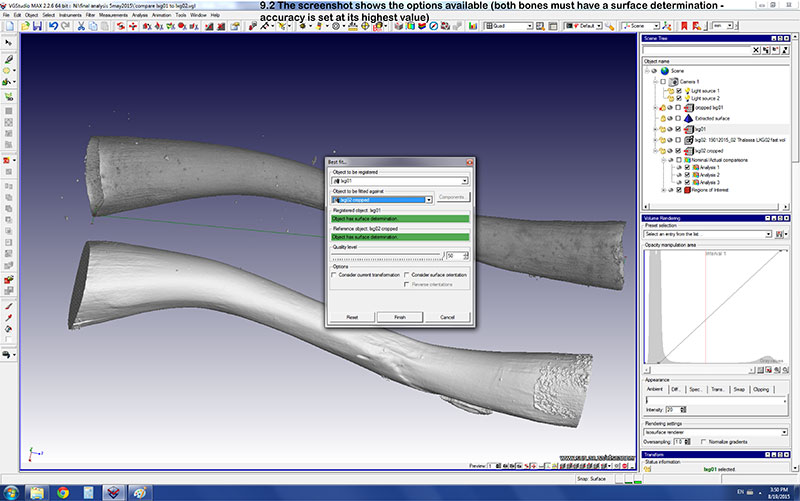
9.2. The screenshot shows the options available (both bones must have a surface determination -- accuracy is set at its highest value).
9.3. Result of a ‘best-fit’ registration.
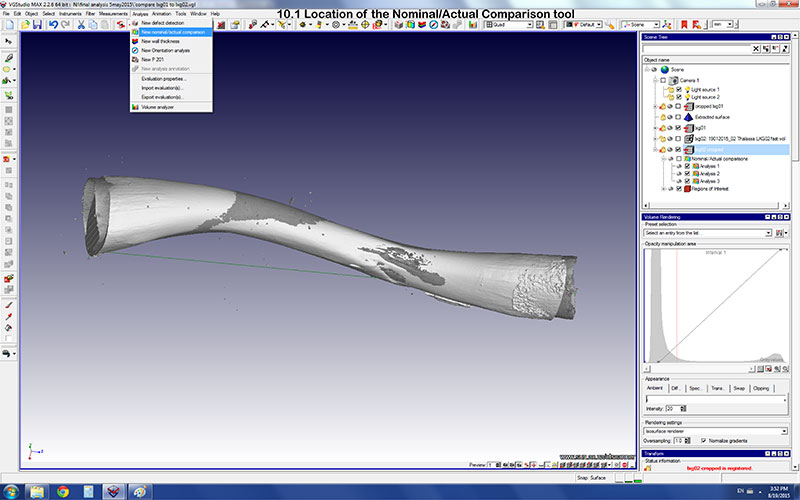
Part 10. Nominal/Actual Comparison
10.1. Location of the Nominal/Actual Comparison tool.
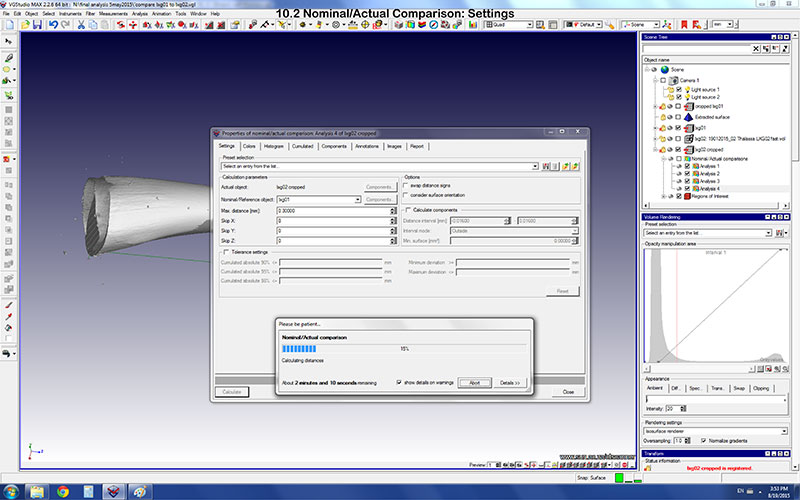
10.2. Nominal/Actual Comparison: Settings.
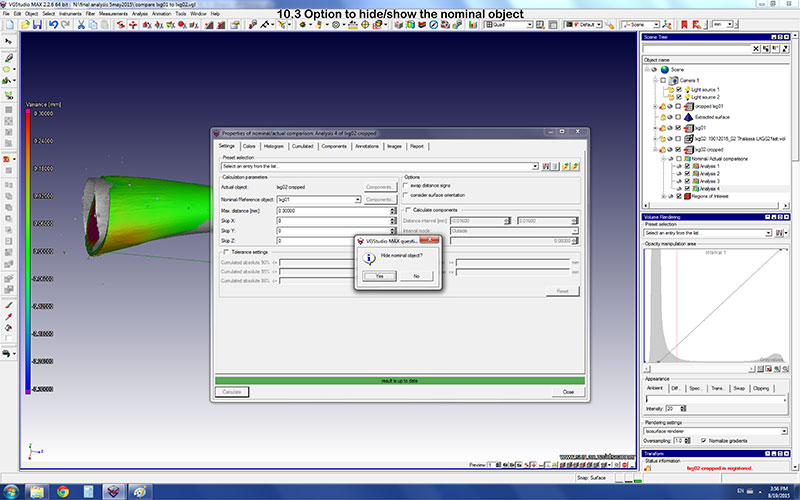
10.3. Option to hide/show the nominal object.
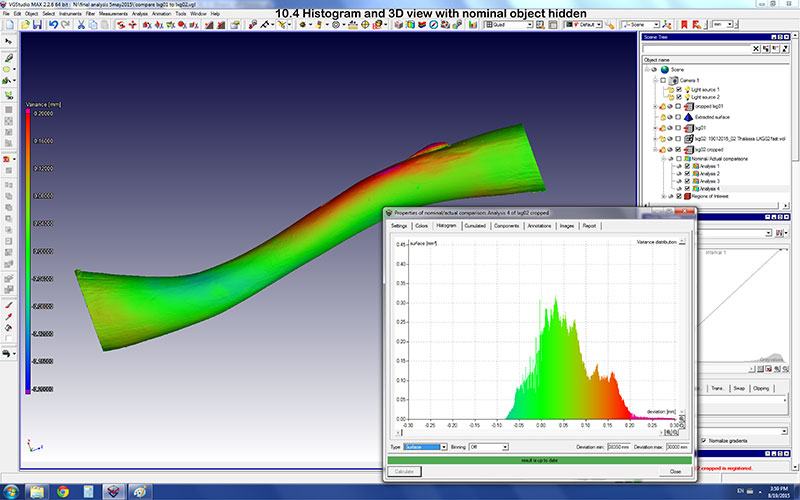
10.4. Histogram and 3D view with nominal object hidden.
 Thalassa Matthews. Iziko South African Museum, 25 Queen Victoria Street, Cape Town 8000, South Africa
and DST-NRF Centre of Excellence in Palaeosciences, Evolutionary Studies Institute, University of the Witwatersrand Private Bag 3, Wits, 2050, South Africa. tmatthews.matthews@gmail.com
Dr Thalassa Matthews studies fossil micromammal (mice, rats, shrews etc.) and frog remains from archaeological and palaeontological sites. Her research includes sites dating from the Pliocene and Quaternary from the west, south and east coasts of South Africa, as well as the Cradle of Humankind (Gauteng Province), and focuses on using the microfauna from fossil sites to provide a palaeoenvironmental context for research into climate change and the development of 'modern' human behavior.

 Anton du Plessis. CT Scanner Facility, Central Analytical Facilities, Paul Sauer Building, Bosman Street, University of Stellenbosch, Stellenbosch, 7602, South Africa/Physics Department, University of Stellenbosch, Stellenbosch, 7602, South Africa. anton2@sun.ac.za
Anton du Plessis is staff scientist and manager of the Stellenbosch University CT (computed tomography) facility. As an open access facility, he makes available industrial X-ray tomography technology to researchers and companies with low rates and fast turnaround times. As a physicist he is involved in method developments and new applications of technologies. For more information on research interests see: http://blogs.sun.ac.za/ctscanner/research/
FIGURE 1. A complete Breviceps montanus (Catalogue number ZR-050053) CT scan with segmentation of humerus and femur demonstrated.
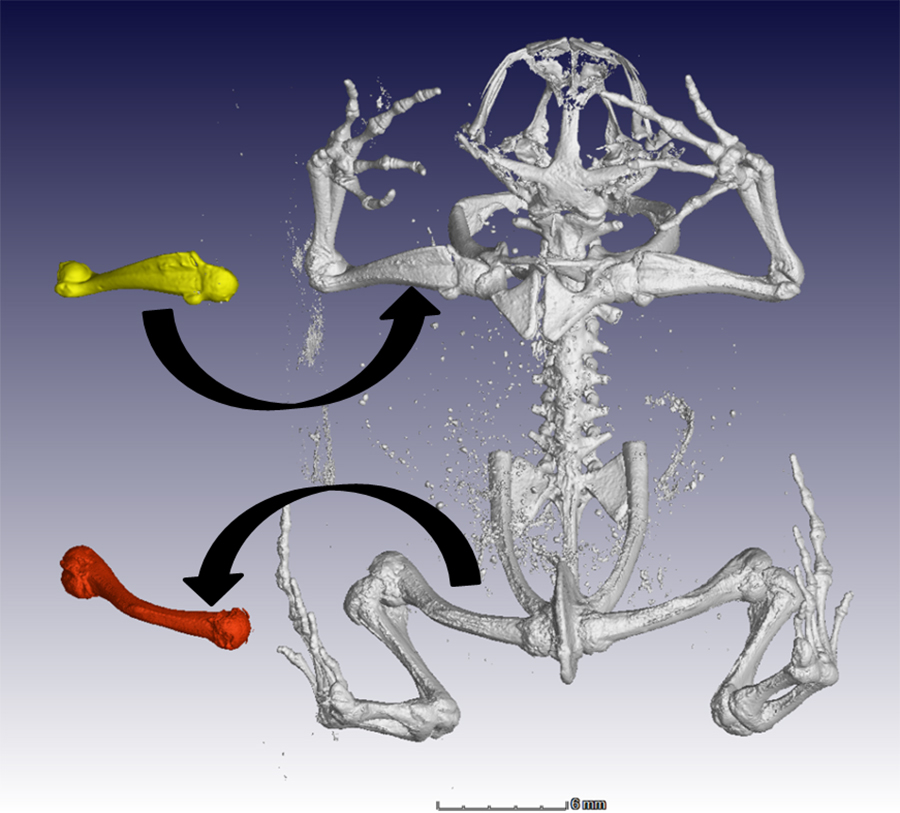
FIGURE 2. Bone cortex thickness analysis on a male Xenopus laevis (CP001) (A) and a fossil Xenopus sp. (ZM 71336) (B) depicted side by side in slice view from top view (1) and side view (3) and in a 3D colour-coded analysis (2 and 3).
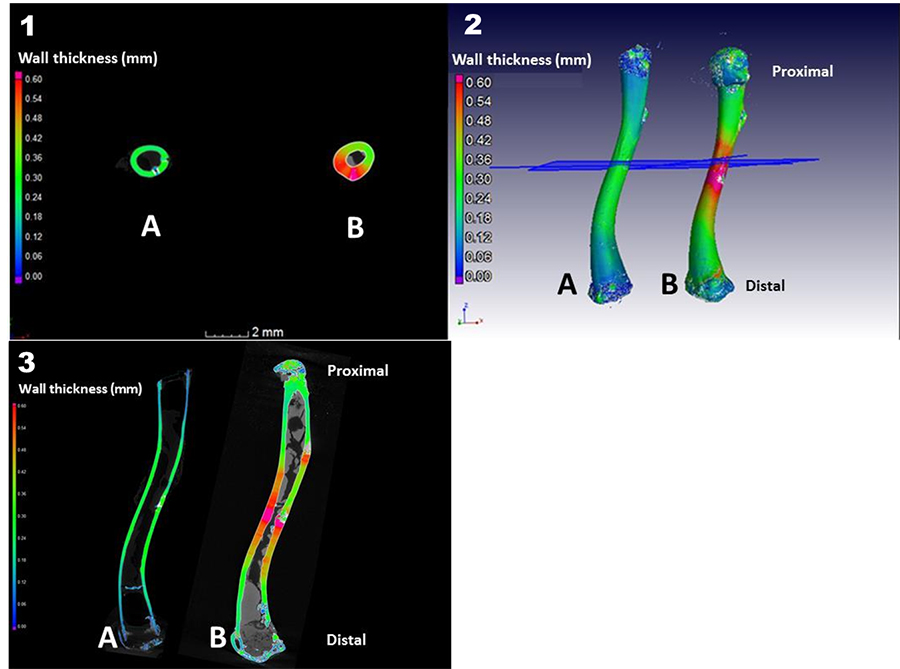
FIGURE 3. Morphological bone-to-bone comparison between the ‘nominal’ male (CP001) and ‘actual’ female (CP002) Xenopus laevis. The differences are colour-coded and show female (CP002) variance relative to the nominal bone of the male (CP001) which is depicted in the figure.
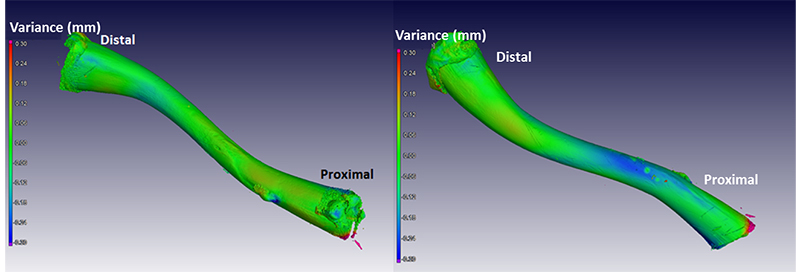
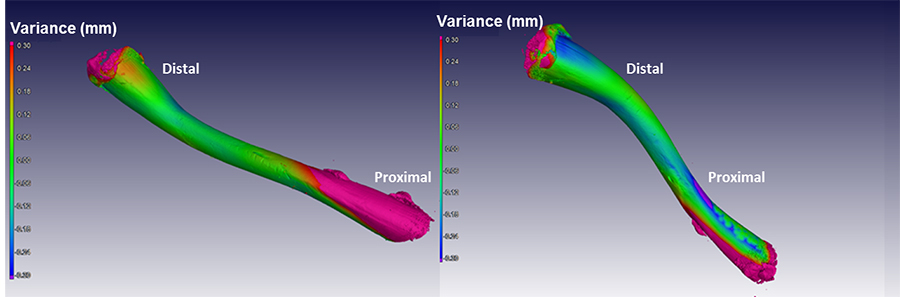
FIGURE 4. Morphological bone-to-bone comparison between the ‘nominal’ Xenopus laevis (CP001) with the ‘actual’ fossil Xenopus sp. (ZM 71336)
Using X-ray computed tomography analysis tools to compare the skeletal element morphology of fossil and modern frog (Anura) species
Plain Language Abstract
Computed tomography (CT) analysis software has predominantly been developed for medical and industrial use. Thus far there have not been detailed reports in the palaeontological literature of CT analysis tools being used for visual 3D comparisons between different taxa/species in order to assess and quantify micro-anatomical differences (for example, cortical wall thickness, growth rings and micro-structures). This paper presents the methodology for the general morphological comparison and analysis of fossil and modern microfaunal bones, using modern and fossil frog femora (frog upper-leg bones) as an example. Industrial X-ray computed tomography analysis functions are applied to the analysis, and specifically, the comparison, of bone morphologies and bone cortex-thickness of differentially sized frog taxa. This methodology (using industrial analysis functions) is shown to be useful for viewing qualitative as well as quantitative differences. Single bones as well as complete frog specimens were scanned and, in the case of the latter, femora were virtually extracted (segmented) for the purposes of comparison with other specimens. The techniques described in this paper may be used for the effective identification and quantification of morphological differences between fossil and extant taxa.
Resumen en Español
El uso de herramientas de análisis de tomografía computarizada de rayos X para comparar la morfología de los elementos esqueléticos de especies fósiles y actuales de rana (Anura)
El software de análisis de tomografía computarizada (TC) se ha desarrollado principalmente para uso médico e industrial. Hasta el momento no ha habido informes detallados en la literatura paleontológica sobre herramientas de análisis de TC que utilicen funciones de análisis automático para las comparaciones visuales 3D entre diferentes taxones/especies, con el fin de evaluar y cuantificar las diferencias. En este trabajo se presenta la metodología para la comparación morfológica general y el análisis de huesos fósiles y actuales; en el presente caso se han utilizado como objetos de estudio los fémures de rana. Se aplican al análisis las funciones de análisis de tomografía computarizada de rayos X industriales, y, específicamente, la comparación de las morfologías de hueso y de diferencias micro-anatómicas (por ejemplo, el espesor de la pared cortical) de taxones de rana que difieren en el tamaño. En contraste con el análisis histórico tradicional, este método hace uso de un mayor detalle de los datos de toda la superficie en forma de un sistema CAD (Diseño Asistido por Ordenador) de salida conjunto de datos de la exploración microCT. Se demuestra que la aplicación de estas funciones de análisis industriales es útil para la visualización de diferencias cualitativas, así como cuantitativas. Las diferencias se resaltan mediante comparaciones reales/nominales 3D, y el espesor de la pared cortical se compara mediante la función de análisis de espesor de la pared aplicada a ambas muestras lado a lado. Se exploraron huesos individuales de rana y ranas completas y, en este último caso, los fémures fueron extraídos virtualmente (segmentados) con el propósito de compararlos con otros especímenes. Estas técnicas se pueden usar para la identificación y cuantificación efectiva de las diferencias morfológicas entre fósiles y taxones actuales.
Palabras clave: tomografía de rayos X; morfología ósea; anatomía; tomografía computarizada; Anura; rana
Traducción: Enrique Peñalver (Sociedad Española de Paleontología)
Résumé en Français
Comparaison de la morphologie des éléments squelettiques d'espèces de grenouilles (Anura) actuelles et fossiles par tomodensitométrie
Les logiciels d'analyse par tomodensitométrie (TDM) ont été principalement développés pour des utilisations médicales et industrielles. Jusqu'à présent, la littérature paléontologique était dépourvue de rapport détaillé sur les outils d'analyse TDM utilisant des fonctions d'analyses automatiques pour effectuer des comparaisons visuelles 3D entre taxons, et ainsi estimer et quantifier leurs différences. Cet article présente la méthodologie pour effectuer des comparaisons morphologiques générales et des analyses des os actuels et fossiles. Le cas présenté ici illustre des fémurs de grenouilles. Les fonctions d'analyse par tomodensitométrie industrielle sont appliquées à l'analyse, et plus précisément, à la comparaison des morphologies osseuses et des différences de micro-anatomie (e.g., l'épaisseur de la paroi corticale) de taxons de grenouilles de tailles variées. Contrairement aux analyses traditionnelles de points-repères (« landmarks »), cette méthode tire avantage de la plus haute précision de la totalité des données de surface sous la forme d'un jeu de données DAO (Dessin Assisté par Ordinateur) obtenu à l'aide du scan microTDM. La mise en pratique de ces fonctions d'analyses industrielles s'est prouvée utile pour visualiser les différences qualitatives ainsi que les différences quantitatives. Les différences sont soulignées en utilisant des comparaisons 3D réelles/nominales, et l'épaisseur de la paroi est comparée en utilisant la fonction d'analyse d'épaisseur de paroi appliquée aux deux échantillons côte à côte. Des os isolés de grenouilles, ainsi que des spécimens complets, ont été scannés et, pour ces derniers, les fémurs ont été extraits (segmentés) virtuellement dans le but de les comparer avec d'autres spécimens. Ces techniques peuvent être utilisées pour identifier et quantifier de manière efficace les différences morphologiques entre taxons actuels et fossiles.
Mots-clés : tomodensitométrie ; morphologie osseuse ; anatomie ; scan TDM ; Anura ; grenouilles
Translator: Antoine Souron
Deutsche Zusammenfassung
Anwendung von Röntgen-Computertomographie-Analysewerkzeugen zum Vergleich der Skelettmorphologie von fossilen und modernen Froscharten (Anura)
Computertomographie (CT)-Analysesoftware wurde in erster Linie für den medizinischen und industriellen Gebrauch entwickelt. Bis jetzt gibt es in der paläontologischen Literatur noch keine detaillierten Berichte über CT-Analysewerkzeuge, die automatische Analysefunktionen für visuellen 3D-Vergleich zwischen verschiedenen Taxa/Arten benutzen um Unterschiede zu bewerten und zu quantifizieren. Diese Arbeit präsentiert die Methode für einen generellen morphologischen Vergleich und eine Analyse von fossilen und modernen Knochen – in diesem Fall befinden sich die Frosch-Femora in Schaukästen. Bei der Analyse wurden industrielle Röntgencomputertomographie-Analysefunktionen angewendet und speziell der Vergleich von Knochenmorphologien und mikroanatomischen Unterschieden (z.B. Stärke des kortikalen Walls) der unterschiedlich großen Froschtaxa. Im Gegensatz zur traditionellen Landmark-Analyse nutzt diese Methode die detailgenaueren Vollflächendaten eines CAD-Datensets aus dem Mikro-CT Scan. Es hat sich gezeigt, dass die Anwendung dieser industriellen Analysefunktionen zur Einsicht von qualitativen als auch quantitativen Unterschieden nützlich ist. Unterschiede werden mit 3D nominalen/tatsächlichen Vergleichen hervorgehoben und die Wallstärke wird mit der Wallstärken-Analysefunktion verglichen, die nebeneinander für beide Proben angewendet wird. Es wurden einzelne Knochen als auch komplette Frösche eingescannt, bei letzteren wurden die Femora virtuell entnommen (segmentiert), um sie mit anderen Stücken zu vergleichen. Diese Techniken können bei der effektiven Identifikation und Quantifizierung von morphologischen Unterschieden zwischen fossilen und heutigen Taxa angewendet werden.
Schlüsselwörter: Röntgentomographie; Knochenmorphologie; Anatomie; CT-Scan; Anura; Frosch
Translator: Eva Gebauer
Arabic
Translator: Ashraf M.T. Elewa
-
-
-
Review: The Princeton Field Guide to Mesozoic Sea Reptiles
 The Princeton Field Guide to Mesozoic Sea Reptiles
Article number: 26.1.1R
April 2023
 Poster Winners 2024