

Article Search
Volume 27.1
January–April 2024
Full table of contents
ISSN: 1094-8074, web version;
1935-3952, print version
Recent Research Articles
See all articles in 27.1 January-April 2024
See all articles in 26.3 September-December 2023
See all articles in 26.2 May-August 2023
See all articles in 26.1 January-April 2023
 Jordi Marcé-Nogué. Universitat Politècnica de Catalunya - BarcelonaTech, 08222, Terrassa, Spain. jordi.marce.nogue@gmail.com
Jordi Marcé-Nogué (Igualada, 1979) has Bachelor degree of Industrial Engineering issued from Universitat Politècnica de Catalunya (Spain) in 2003 and PhD degree Resistència de Materials i Computational Biomechanics from Universitat Politècnica de Catalunya in 2009.
He started as a research fellow in the Departament de Estructures a l'Enginyeria and from 2006 he has being a assistant teacher in Escola Tècnica Superior d'Enginyeria i Aeronàutica de Terrassa (UPC) and a researcher at Laboratory for the Innovation of Structures and Materials (LITEM)
orcid.org/0000-0001-9852-7027

 Soledad de Esteban-Trivigno. Transmitting Science, Gardenia 2, Piera, 08784, Spain; and Institut Català de Paleontologia Miquel Crusafont, Edifici ICP, Campus de la UAB s/n, 08193, Cerdanyola del Vallès, Spain. soledad.esteban@transmittingscience.org
Soledad De Esteban-Trivigno (Balcarce, 1975) obtained her PhD degree in Biology at the University of Valencia in 2008. From 2008 to 2010 she was Postdoc at the Paleobiology department in The Institut Català de Paleontologia. Nowadays she is scientific Director at Transmitting Science and Researcher at the Institut Català de Paleontologia. Her main research interests are in the area of skull shape variability, and the analysis of the different factors modelling skull evolution in different groups of vertebrates.
 Christian Escrig. Universitat Politècnica de Catalunya - BarcelonaTech, 08222, Terrassa, Spain. christian.escrig@upc.edu
Christian Escrig (Barcelona, 1981) has a Master's Degree of Industrial Engineering issued from Universitat Politècnica de Catalunya (Spain) in 2007 and a PhD in Structural Analysis from Universitat Politècnica de Catalunya (Spain) in 2015. He started as a assistant teacher at Universitat Politècnica de Catalunya from 2009 and is a researcher at Laboratory for the Innovation of Structures and Materials (LITEM) from 2010.
Orcid ID: orcid.org/0000-0002-2412-007X
Researcher ID: K-5798-2013
Scopus Author ID: 55650663300
 Lluís Gil. Universitat Politècnica de Catalunya - BarcelonaTech, 08222, Terrassa, Spain. lluis.gil@upc.edu
Lluís Gil (Barcelona, 1966) achieved a civil engineering degree in 1992 and a PhD from Universitat Politecnica de Catalunya UPC in 1997. He currently is associate professor at UPC in the field of aerospace structures. Director of research Laboratory for the Innovation of Structures and Materials (LITEM). Lecturer of continuum mechanics and engineering structures. Interested in NDT, composites and new materials.
ORCID:0000-0002-2007-4846.
FIGURE 1. Twelve meshes of Chlamyphorus truncates obtained when evaluating the influence of size of the elements in the mesh.
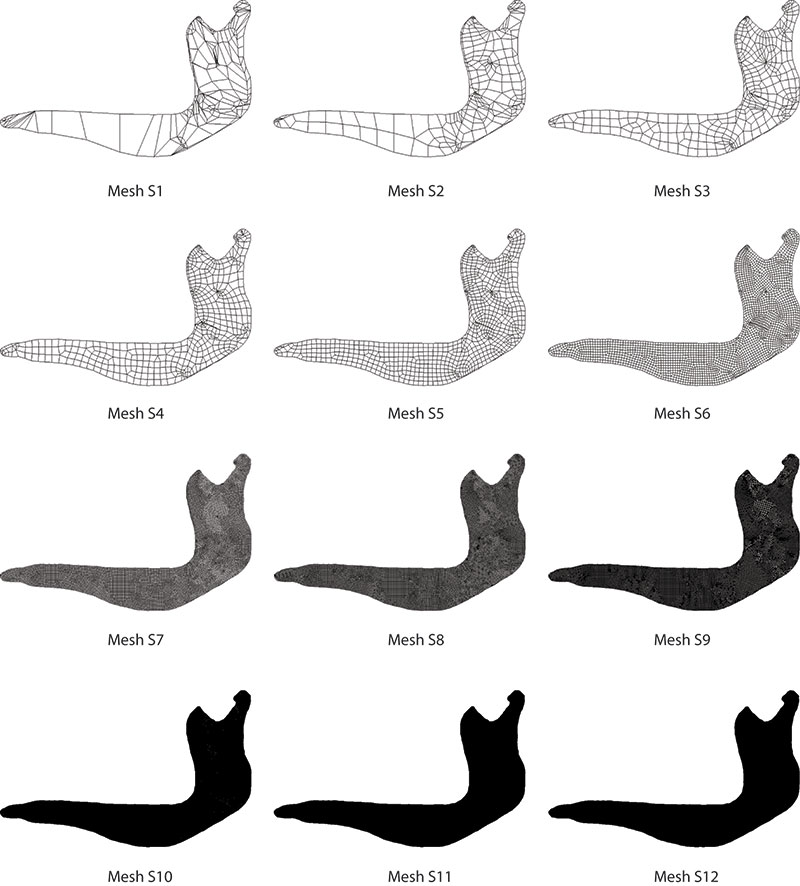
FIGURE 2. Six meshes of Chlamyphorus truncates obtained when evaluating the influence of the homogeneity of the mesh.
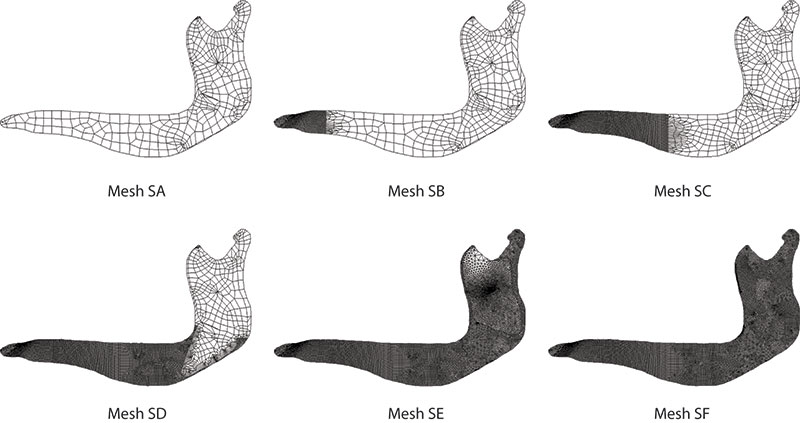
FIGURE 3. Evolution of the values of Arithmetic Mean (AM), Mesh-Weighted Arithmetic Mean (MWAM), Median (M), Mesh-Weighted Median (MWM), Percentage Error of the Arithmetic Mean (PEofAM) and Percentage Error of the Median (PEofM) in front of the size of the elements (1) and the uniformity of the mesh (2). Meshes from a Chlamyphorus truncates. S07 refers to Mesh S7 (mesh size), SE refers to Mesh SE (mesh homogeneity).
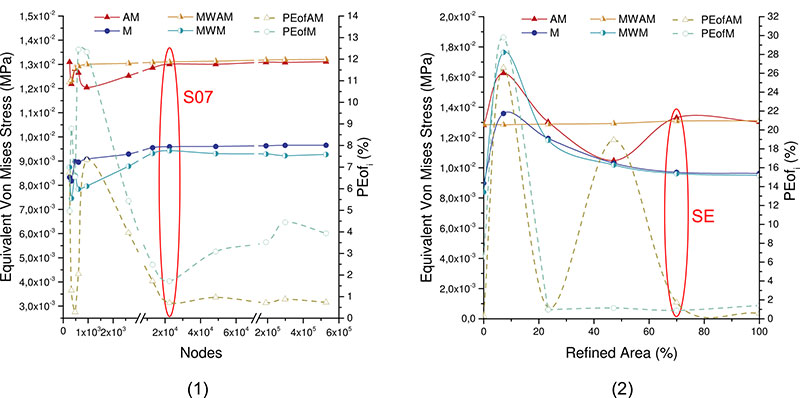
FIGURE 4. Evolution of the convergence error of each iteration of Arithmetic Mean (AM), Mesh-Weighted Arithmetic Mean (MWAM), Median (M), Mesh-Weighted Median (MWM) in front of the number of nodes (1) and the percentage of Refined Area (percent value of area with homogeneous mesh) (2). Meshes from a Chlamyphorus truncates. S07 refers to Mesh S7 (mesh size), SE refers to Mesh SE (mesh homogeneity).
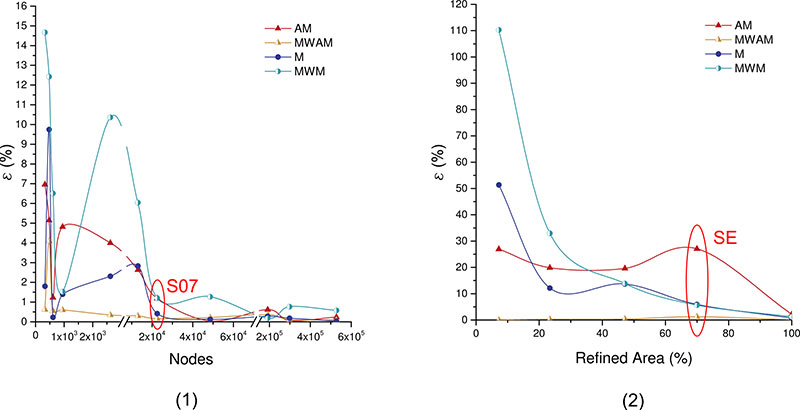
FIGURE 5. Evolution of the box-plots of the Von Mises stress distribution. X-axes refers to meshes S01 to S12: the size of the elements (1); and meshes SA to SF: the uniformity of the mesh (2). Meshes from a Chlamyphorus truncates.
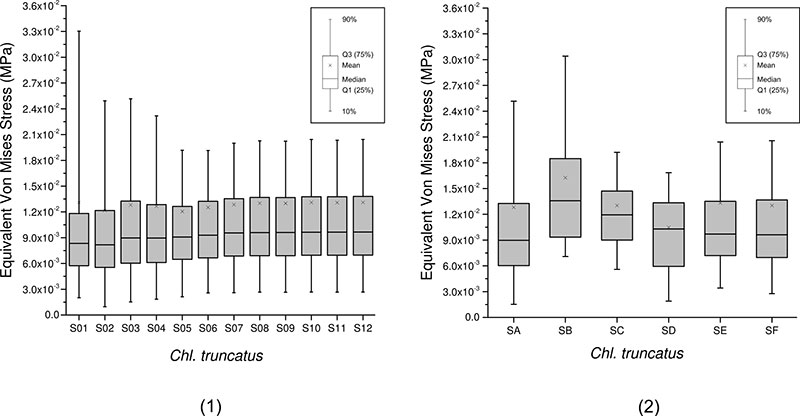
FIGURE 6. Box-plots of Von Mises stress distributions when Quasi-Ideal Meshes (QUIM) are assumed for the 20 Cingulata mandibles analysed. The 80% of the values of the Von Mises stress distribution are represented between the upper and lower whiskers.
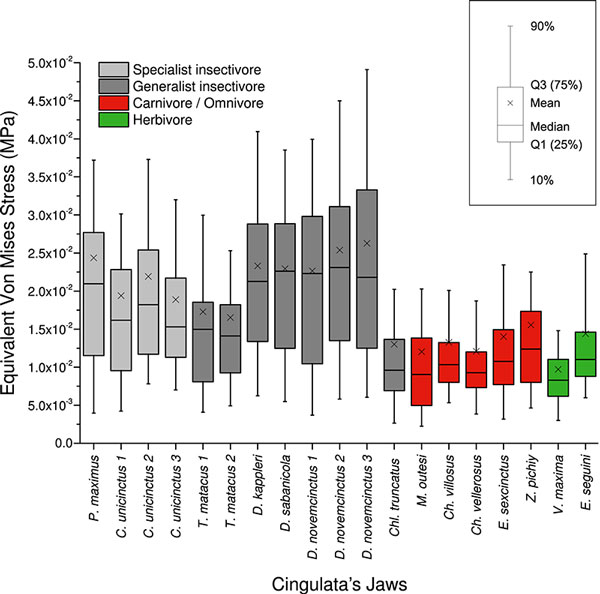
TABLE 1. List and geometric properties of species used in the present study. Diet following (Redford, 1985). Abbreviations preceding the names of institutions are used to identify the location of specimens: AMNH, American Museum of Natural History, New York, USA; FMNH, Field Museum of Natural History, Chicago, USA; MNCN, Museo Nacional de Ciencias Naturales, Madrid, Spain; MNHN, Muséum National d’Histoire Naturalle, Paris, France; ZMB, Zoologisches Museum, Berlin, Germany; MLP, Museo de la Plata, La Plata, Argentina. The data of Eutatus seguiniis is a reconstruction based on Vizcaíno and Bargo (1998).
| Taxon | Diet | Collection number | Thickness (mm) |
Model area [mm2] |
Masseter area [mm2] |
Temporalis area [mm2] |
Masseter Force [N] |
Temporalis Force [N] |
| Priodontes maximus | Specialist insectivore | AMNH 208104 | 6.41 | 2051.70 | 616.02 | 255.06 | 1.29 | 0.53 |
| Cabassous unicinctus 1 | Specialist insectivore | MNHN 1953/457 | 3.51 | 415.75 | 112.08 | 22.91 | 0.37 | 0.08 |
| Cabassous unicinctus 2 | Specialist insectivore | ZMB 5913 | 4.60 | 813.05 | 182.24 | 30.86 | 0.70 | 0.12 |
| Cabassous unicinctus 3 | Specialist insectivore | ZMB 37799 | 4.48 | 698.77 | 21.75 | 12.27 | 0.70 | 0.04 |
| Tolypeutes matacus 1 | Generalist insectivore | AMNH 246460 | 3.56 | 497.40 | 157.01 | 64116.00 | 0.35 | 0.14 |
| Tolypeutes matacus 2 | Generalist insectivore | ZMB 47083 | 3.97 | 316.81 | 94.09 | 32.51 | 0.33 | 0.11 |
| Dasypus kappleri | Generalist insectivore | MNHN 1995/207 | 3.51 | 971.37 | 105.37 | 153.18 | 0.28 | 0.41 |
| Dasypus sabanicola | Generalist insectivore | ZMB 85899 | 2.78 | 527.86 | 150.66 | 71545.00 | 0.27 | 0.13 |
| Dasypus novemcinctus 1 | Generalist insectivore | AMNH 133338 | 2.94 | 613.54 | 225.77 | 92174.00 | 0.32 | 0.13 |
| Dasypus novemcinctus 2 | Generalist insectivore | ZMB 38343 | 2.93 | 819.33 | 283.15 | 49.13 | 0.45 | 0.08 |
| Dasypus novemcinctus 3 | Generalist insectivore | ZMB 31703 | 3.19 | 882.19 | 295.67 | 65.74 | 0.49 | 0.11 |
| Chlamyphorus truncatus | Generalist insectivore | ZMB 4321 | 2.00 | 113.19 | 16035.00 | 34006.00 | 0.04 | 0.09 |
| Macroeuphractus outesi | Omnivore/ Carnivore | MLP 69-IX-9-3 | 25.97 | 11750.00 | 5328.00 | 1455.90 | 13.89 | 3.79 |
| Chaetophractus villosus | Omnivore/ Carnivore | MNCN 2538 | 4.94 | 1038.90 | 300.58 | 156.08 | 0.66 | 0.34 |
| Chaetophractus vellerosus | Omnivore/ Carnivore | MLP 18.XI.99.9 | 3.68 | 538.80 | 145.04 | 117.03 | 0.30 | 0.24 |
| Euphractus sexcinctus | Omnivore/ Carnivore | MNHN 1917/13 | 5.66 | 1019.20 | 331.22 | 190.60 | 0.72 | 0.41 |
| Zaedyus pichiy | Omnivore/ Carnivore | MLP 9.XII.2.10 | 3.51 | 327.35 | 89737.00 | 66091.00 | 0.23 | 0.17 |
| Vassallia maxima | Herbivore | FMNH 14424 | 25.97 | 4620.30 | 2208.40 | 140.23 | 10.43 | 0.66 |
| Eutatus seguini | Herbivore | Reconstruction | 13.74 | 3517.90 | 890.49 | 551.23 | 3.16 | 1.96 |
TABLE 2. Statistics for the Kruskal-Wallis test: Arithmetic Mean (AM), Mesh-Weighted Arithmetic Mean (MWAM), Median (M) and Mesh-Weighted Median (MWM).
| Kruskal-Wallis H | Kruskal-Wallis p-value | Pairwise test p-value: Bonferroni non-corrected / corrected | |||
| Specialist Insectivore vs Generalist Insectivore | Specialist Insectivore vs Omnivore | Generalist Insectivore vs Omnivore | |||
| AM | 9.429 | 0.0089 | 0.8197 / 1 | 0.0369 / 0.1107 | 0.0058 / 0.0173 |
| MWAM | 9.429 | 0.0089 | 0.8197 / 1 | 0.0369 / 0.1107 | 0.0058 / 0.0173 |
| M | 9.587 | 0.0072 | 0.3619 / 1 | 0.0368 / 0.1107 | 0.0058 / 0.0173 |
| MWM | 9.589 | 0.0081 | 0.5676 / 1 | 0.0358 / 0.1073 | 0.0057 / 0.0170 |
TABLE 3. Values for the descriptive statistics Arithmetic Mean (AM) and Median (M) of the Von Mises Stress Distribution in each of the 20 Cingulate mandible.
| Taxon | Nodes | AM [MPa] |
MWAM [MPa] |
M [MPa] |
MWM [MPa] |
PEofAM [%] |
PEofM [%] |
| Priodontes maximus | 34850 | 0.024369 | 0.024416 | 0.020965 | 0.021166 | 0.19 | 0.95 |
| Cabassous unicinctus 1 | 20223 | 0.019407 | 0.019715 | 0.016175 | 0.015493 | 1.56 | 4.40 |
| Cabassous unicinctus 2 | 147443 | 0.021900 | 0.021400 | 0.018200 | 0.018600 | 2.43 | 2.15 |
| Cabassous unicinctus 3 | 133183 | 0.018900 | 0.019000 | 0.015300 | 0.014700 | 0.79 | 3.94 |
| Tolypeutes matacus 1 | 24202 | 0.017281 | 0.017435 | 0.014982 | 0.014603 | 0.89 | 2.59 |
| Tolypeutes matacus 2 | 132946 | 0.016500 | 0.016700 | 0.014100 | 0.013500 | 0.72 | 4.56 |
| Dasypus kappleri | 45523 | 0.023298 | 0.023447 | 0.021266 | 0.020468 | 0.64 | 3.90 |
| Dasypus sabanicola | 25174 | 0.022948 | 0.023036 | 0.022615 | 0.021783 | 0.38 | 3.82 |
| Dasypus novemcinctus 1 | 29249 | 0.022644 | 0.022692 | 0.022301 | 0.021585 | 0.21 | 3.32 |
| Dasypus novemcinctus 2 | 133983 | 0.025400 | 0.025300 | 0.023100 | 0.022300 | 0.15 | 3.76 |
| Dasypus novemcinctus 3 | 187208 | 0.026300 | 0.026200 | 0.021800 | 0.021200 | 0.13 | 2.77 |
| Chlamyphorus truncatus | 48577 | 0.013004 | 0.013131 | 0.009605 | 0.009309 | 0.96 | 3.19 |
| Macroeuphractus outesi | 61435 | 0.012038 | 0.011881 | 0.009044 | 0.008903 | 1.32 | 1.59 |
| Chaetophractus villosus | 50126 | 0.013269 | 0.013519 | 0.010344 | 0.009984 | 1.85 | 3.60 |
| Chaetophractus vellerosus | 26309 | 0.012094 | 0.012253 | 0.009270 | 0.008934 | 1.30 | 3.77 |
| Euphractus sexcinctus | 48517 | 0.014003 | 0.014263 | 0.010759 | 0.010404 | 1.83 | 3.41 |
| Zaedyus pichiy | 136253 | 0.015548 | 0.015669 | 0.012378 | 0.011875 | 0.77 | 4.24 |
| Vassallia maxima | 65549 | 0.009714 | 0.009635 | 0.008301 | 0.008054 | 0.83 | 3.06 |
| Eutatus seguini | 76191 | 0.014400 | 0.014449 | 0.011008 | 0.010713 | 0.34 | 2.75 |
FIGURE S1. Map of Von Mises stress distribution in the 12 meshes of Chlamyphorus truncates obtained when evaluating the influence of size of the elements in the mesh.
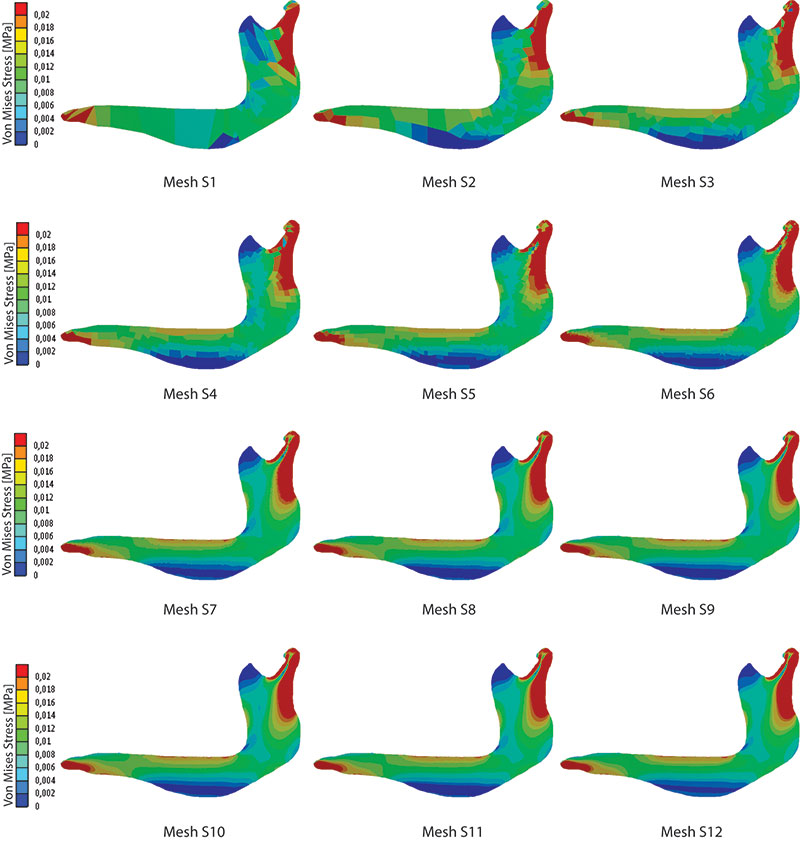
FIGURE S2. Map of Von Mises stress distribution in the six meshes of Chlamyphorus truncates obtained when evaluating the influence of the homogeneity of the mesh.
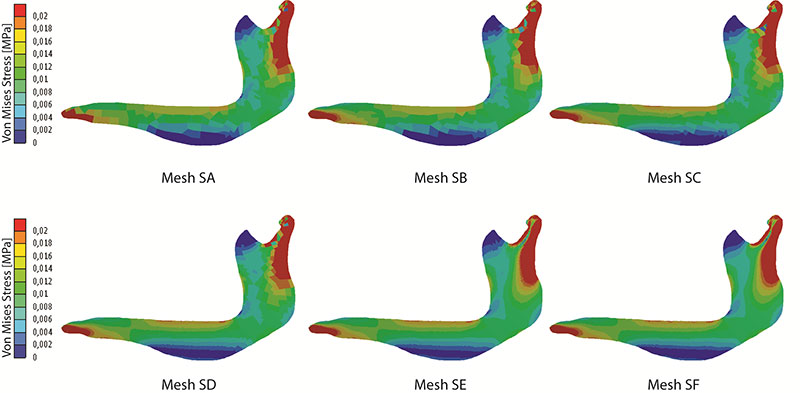
FIGURE S3. Map of Von Mises stress distribution in the 20 FEA models of Cingulata mandibles.
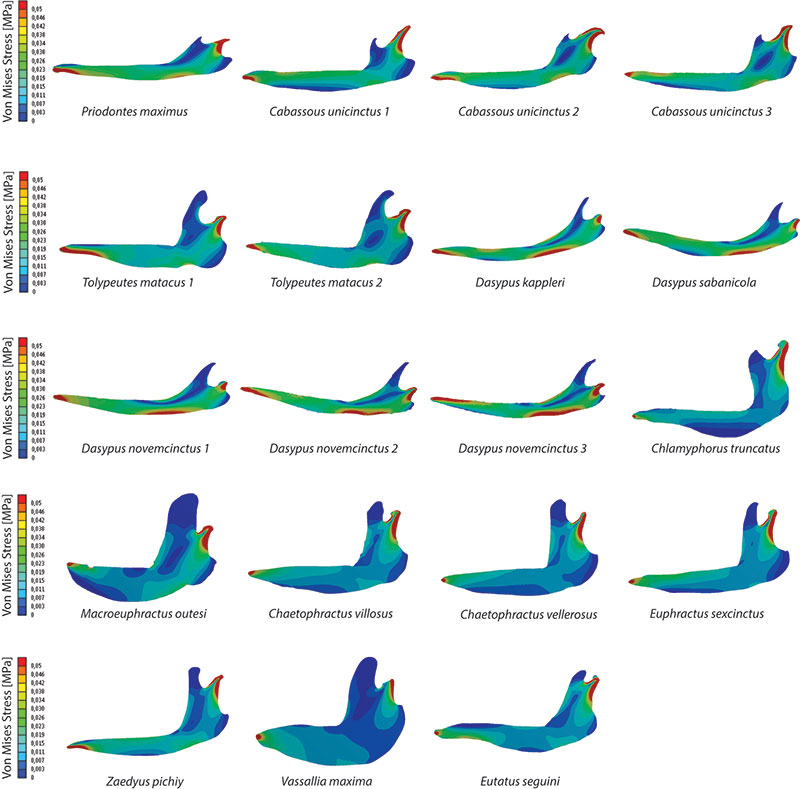
TABLE S1. Nodes of the model and values obtained for the 12 different meshes of Chlamyphorus truncates when varying the overall element size of: Arithmetic Mean (AM), Mesh-Weighted Arithmetic Mean (MWAM), Median (M), Mesh-Weighted Median (MWM), Percentage Error of the Arithmetic Mean (PEofAM) and Percentage Error of the Median (PEofM).
| Overall Element Size [mm] |
Nodes | AM [MPa] |
MWAM [MPa] |
M [MPa] |
MWM [MPa] |
PEofAM [%] |
PEofM (%) |
|
| 1 | 5 | 255 | 1.310E-02 | 1.227E-02 | 8.33E-03 | 8.74E-03 | 6.75 | 4.96 |
| 2 | 2 | 328 | 1.218E-02 | 1.234E-02 | 8.18E-03 | 7.46E-03 | 1.29 | 8.79 |
| 3 | 1 | 477 | 1.281E-02 | 1.285E-02 | 8.98E-03 | 8.39E-03 | 0.29 | 6.56 |
| 4 | 0.75 | 612 | 1.265E-02 | 1.292E-02 | 8.96E-03 | 7.84E-03 | 2.06 | 12.45 |
| 5 | 0.5 | 946 | 1.204E-02 | 1.300E-02 | 9.08E-03 | 7.96E-03 | 7.33 | 12.34 |
| 6 | 0.25 | 2619 | 1.253E-02 | 1.304E-02 | 9.29E-03 | 8.79E-03 | 3.96 | 5.43 |
| 7 | 0.1 | 13013 | 1.286E-02 | 1.308E-02 | 9.55E-03 | 9.32E-03 | 1.72 | 2.48 |
| 8 | 0.075 | 22525 | 1.301E-02 | 1.310E-02 | 9.59E-03 | 9.43E-03 | 0.71 | 1.72 |
| 9 | 0.05 | 48557 | 1.300E-02 | 1.313E-02 | 9.61E-03 | 9.31E-03 | 0.96 | 3.09 |
| 10 | 0.025 | 191368 | 1.308E-02 | 1.318E-02 | 9.63E-03 | 9.29E-03 | 0.71 | 3.53 |
| 11 | 0.02 | 298366 | 1.308E-02 | 1.319E-02 | 9.65E-03 | 9.22E-03 | 0.88 | 4.44 |
| 12 | 0.015 | 528034 | 1.311E-02 | 1.321E-02 | 9.65E-03 | 9.27E-03 | 0.73 | 3.93 |
TABLE S2. Per cent relative error (ε[%]) obtained for the convergence of 12 different meshes of Chlamyphorus truncates when varying the overall element size of Arithmetic Mean (AM), Mesh-Weighted Arithmetic Mean (MWAM), Median (M) and Mesh-Weighted Median (MWM).
| AM [%] |
MWAM [%] |
M [%] |
MWM [%] |
|
| 1 | - | - | - | - |
| 2 | 6.96 | 0.62 | 1.80 | 14.67 |
| 3 | 5.15 | 4.09 | 9.75 | 12.42 |
| 4 | 1.23 | 0.55 | 0.23 | 6.51 |
| 5 | 4.82 | 0.60 | 1.40 | 1.53 |
| 6 | 4.00 | 0.34 | 2.31 | 10.37 |
| 7 | 2.63 | 0.30 | 2.83 | 6.04 |
| 8 | 1.19 | 0.16 | 0.42 | 1.20 |
| 9 | 0.03 | 0.22 | 0.12 | 1.27 |
| 10 | 0.62 | 0.36 | 0.28 | 0.18 |
| 11 | 0.06 | 0.11 | 0.18 | 0.77 |
| 12 | 0.24 | 0.10 | 0.04 | 0.57 |
TABLE S3. Nodes of the model and values obtained for the six different meshes of Chlamyphorus truncates when varying the homogeneity of the mesh of: Arithmetic Mean (AM), Mesh-Weighted Arithmetic Mean (MWAM), Median (M), Mesh-Weighted Median (MWM), Percentage Error of the Arithmetic Mean (PEofAM) and Percentage Error of the Median (PEofM). Refined Area is the percent value of area with homogeneous mesh.
| Refined Area [%] |
Nodes | AM [MPa] |
MWAM [MPa] |
M [MPa] |
MWM [MPa] |
PEofAM [%] |
PEofM (%) |
|
| 1 | 0.00 | 477 | 1.28E-02 | 1.28E-02 | 8.98E-03 | 8.39E-03 | 0.29 | 6.56 |
| 2 | 7.20 | 2173 | 1.68E-02 | 1.29E-02 | 1.44E-02 | 1.66E-02 | 30.37 | 15.14 |
| 3 | 23.38 | 5644 | 1.27E-02 | 1.29E-02 | 1.19E-02 | 1.23E-02 | 1.27 | 3.82 |
| 4 | 47.16 | 11029 | 1.01E-02 | 1.29E-02 | 9.93E-03 | 9.93E-03 | 21.89 | 0.01 |
| 5 | 69.98 | 18145 | 1.32E-02 | 1.31E-02 | 9.60E-03 | 9.53E-03 | 0.54 | 0.65 |
| 6 | 100.00 | 22526 | 1.30E-02 | 1.31E-02 | 9.59E-03 | 9.43E-03 | 0.70 | 1.72 |
TABLE S4. Per cent relative error (ε[%]) obtained for the convergence of 12 different meshes of Chlamyphorus truncates when varying the homogeneity of the mesh of Arithmetic Mean (AM), Mesh-Weighted Arithmetic Mean (MWAM), Median (M) and Mesh-Weighted Median (MWM).
| AM [%] |
MWAM [%] |
M [%] |
MWM [%] |
|
| 1 | - | - | - | - |
| 2 | 26.94 | 0.01 | 51.37 | 110.28 |
| 3 | 19.88 | 0.28 | 12.15 | 32.97 |
| 4 | 19.59 | 0.34 | 13.70 | 13.85 |
| 5 | 27.08 | 1.24 | 5.91 | 5.65 |
| 6 | 2.17 | 0.09 | 0.71 | 1.23 |
Accounting for differences in element size and homogeneity when comparing Finite Element models: Armadillos as a case study
Plain Language Abstract
In a biomechanical analysis, the internal distributions of the forces ̶ called stress ̶ appear in the inner regions of the models due to the action of external forces. To model how different forces act on a biological structure, as a bone for example, computational models are created. These models are subdivided in small pieces called "elements" using a mesh. Then, theoretical forces are applied to the model and the stress values of each element are recorded. To analyse these stress values in a quantitative framework could be complicated, as these elements have different size in the same mesh. In this work we propose a method to obtain the average mean and median of the distribution of these stresses in a Finite Element model weighting for the differences in elements size. On the other hand we propose a procedure to check whether the meshes used to generate the elements provide accurate results to be used later in statistical analysis. Therefore the stress values can be used as a proxy of the relative strength of vertebrate structures in a comparative framework and allow comparing the obtained mechanical results of different models. This will give us clues about the biomechanical performance of extinct species.
Resumen en Español
Considerando diferencias en el tamaño y la homogeneidad de los elementos cuándo se comparan modelos de Elementos Finitos: Armadillos cómo caso de estudio
Recientemente y en diferentes trabajos en paleobiología, se ha calculado el valor promedio de tensión de von Mises en un modelo de elementos finitos para obtener un valor único que represente la resistencia relativa de estructuras de vertebrados. No obstante, debido a las características de los resultados provenientes de FEA, que dependen del tamaño de los elementos de la malla, este valor requiere ser modificado teniendo en cuenta justamente esta influencia del tamaño delos elementos en el resultado. En este trabajo se propone una media aritmética ponderada por el tamaño de los elementos de la malla (MWAM) cómo estadístico de tendencia central adecuado para mallas no uniformes. Si se quieren utilizar otras herramientas estadísticas, se propone la creación de una malla casi-ideal (QUIM). Primeramente, se utiliza una única mandíbula de Cingulata para testear las propuestas en frente la variación de la malla del modelo. A continuación, se ha realizado una FEA en veinte mandíbulas diferentes de Cingulata pertenecientes a 14 especies. Los resultados obtenidos sugieren que esas metodologías son adecuadas para el estudio de distribuciones de tensión. En particular, estos métodos han resultado ser muy útiles cuando se analiza la biomecánica de estructuras óseas de vertebrados estudiadas cómo modelos planos en un marco comparativo interespecífico.
Palabras clave: Análisis de Elementos Finitos, Mecánica de la mandíbula, biomecánica, dieta, armadillos, análisis funcional
Traducción: Author
Resum en català
Considerant diferències en la mida i la homogeneïtat dels elements quan es comparen models d'elements finits: Armadillos com a cas d'estudi
Recentment i en diferents treballs de paleobiologia, s'ha calculat el valor mitjà de tensió de von Mises en un model d'elements finits per obtenir un valor únic que representi la resistència relativa d'estructures de vertebrats. No obstant això, a causa de les característiques dels resultats provinents de FEA, que depenen de la mida dels elements de la malla del model, aquest valor ha de ser modificat tenint en compte justament aquesta influència de la mida dels elements en el resultat. En aquest treball es proposa una mitjana aritmètica ponderada amb la mida dels elements de la malla (MWAM) com estadístic de tendència central adequat per a malles no uniformes. Si es volen utilitzar altres eines estadístiques, es proposa la creació d'una malla quasi-ideal (QUIM). Primerament, s'utilitza una única mandíbula de Cingulata per testejar les propostes enfront la variació de la malla del model. A continuació, s'ha realitzat un FEA en vint mandíbules diferents de Cingulata pertanyents a 14 espècies. Els resultats obtinguts suggereixen que aquestes metodologies són adequades per a l'estudi de distribucions de tensió. En particular, aquests mètodes han resultat ser molt útils quan s'analitza la biomecànica d'estructures òssies de vertebrats estudiades com a models plans en un marc comparatiu interespecífic.
Paraules clau: Anàlisis d'Elements Finits, Mecànica de la mandíbula, biomecànica, dieta, armadillos, anàlisis funcional
Traducción: Author
Résumé en Français
Prise en compte des différences de taille d'élément et d'homogénéité lors des comparaisons de modèles d'éléments finis : un cas d'étude utilisant les tatous
Plusieurs études de paléobiologie ont récemment calculé la moyenne des contraintes de Von Mises des modèles d'éléments finis pour obtenir une mesure unique qui représente la résistance relative des structures des vertébrés. Cependant, en raison de la nature des données des analyses des éléments finis (FEA), qui dépendent de la taille des éléments du maillage, cette approche doit être pleinement développée en prenant en compte cette influence de la taille des éléments sur les résultats. Dans ce travail, nous proposons d'utiliser une moyenne arithmétique pondérée par le maillage (« Mesh-Weighed Arithmetic Mean ») comme statistique de tendance centrale des maillages non uniformes. Quand d'autres outils statistiques sont utilisés, nous proposons un maillage quasi-idéal (« Quasi-Ideal Mesh ») qui prend en compte les différences de taille des éléments. Dans un premier temps, afin d'analyser l'approche proposée, une mandibule de Cingulata a été utilisée en produisant différents maillages. Ensuite, la FEA a été appliquée comme cas d'étude à 20 mandibules différentes appartenant à 14 espèces de Cingulata. Nos résultats suggèrent que les méthodologies proposées sont adaptées pour comparer différents schémas de distribution des contraintes. En particulier, les méthodes proposées se sont prouvées très utiles pour analyser la biomécanique des structures osseuses des vertébrés qui peuvent être modélisées dans un plan, dans le cadre de comparaisons entre espèces.
Mots-clés : analyse des éléments finis ; mécanique de la mandibule ; régime alimentaire ; tatous ; analyse fonctionnelle
Translator: Antoine Souron
Deutsche Zusammenfassung
Berechnung von Unterschieden in Elementgröße und Homogenität beim Vergleich von Finite Element Modellen: Armadillos als Fallstudie
In verschiedenen paläobiologischen Arbeiten wurde jüngst die durchschnittliche Van Mises Spannung von Finite Element Modellen zur Berechnung eines einzelnen Messwertes genutzt, der die relative Stärke von Wirbeltierstrukturen repräsentiert. Wegen der Art der Finite Element Analysis (FEA) Daten, die von der Größe der Netzelemente abhängt, muss diese Herangehensweise jedoch voll entwickelt werden. Dazu muss der Einfluss der Größe der Elemente im Ergebnis mit einbezogen werden. In dieser Arbeit schlagen wir ein netzgewichtetes arithmetisches Mittel als adäquate zentrale Tendenz-Statistik für uneinheitliche Netze vor. Auf der anderen Seite schlagen wir ein Quasi-Ideales Netz vor, das die Größenunterschiede der Elemente berücksichtigt, wenn andere statistische Werkzeuge benutzt werden. Zur Analyse unserer vorgeschlagenen Herangehensweise wurden zuerst mit einem Cingulaten-Unterkiefer verschiedenen Netze generiert. Danach wurde in einer Fallstudie bei 20 verschiedenen Mandibeln, die zu 14 Cingulaten-Arten gehörten, FEA angewendet. Unsere Ergebnisse legen nahe, dass die vorgeschlagene Methodologie für den Vergleich verschiedener Stressmuster-Verteilungen brauchbar ist. Insbesondere zeigte es sich, dass die vorgeschlagenen Methoden äußerst zweckmäßig zur Analyse der Biomechanik von Wirbeltierknochenstrukturen sind, die als Flächenmodelle in einem interspezifischen Vergleichsrahmen modelliert werden können
Schlüsselwörter: Finite Element Analyse; Unterkiefermechanik; Biomechanik; Ernährung; Gürteltiere; Funktionsanalyse
Translator: Eva Gebauer
Arabic
Translator: Ashraf M.T. Elewa
-
-
-
Review: The Princeton Field Guide to Mesozoic Sea Reptiles
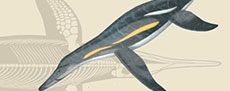 The Princeton Field Guide to Mesozoic Sea Reptiles
Article number: 26.1.1R
April 2023
 Poster Winners 2024