![]()
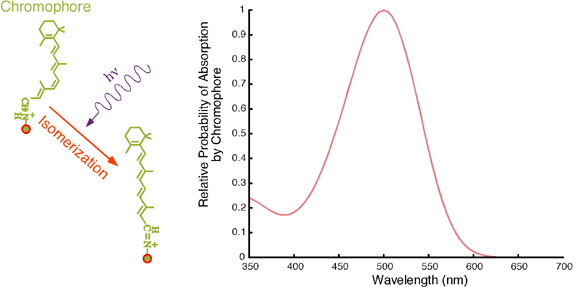
Figure 6A. Wavelength dependence of phototransduction. The reaction on the left is reproduced from Figure 5. The plot on the right shows how the probability that a chromophore will absorb a photon with a given wavelength depends upon that wavelength. The absorption spectrum in this case is that of a human rod. At night we are most sensitive to light with wavelengths around 500 nm. See Figure 6B.