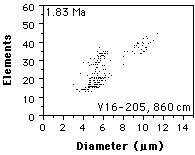
Figure 2. Contoured scatter diagrams as exploration tool for morphotype distinction: An example with a sample from core V16-205, 860 cm. Scatter plot of measurements of the coccolith diameter versus number of elements in the distal shield. The figure shows clustering of the data points into three different groups. Using a gridding algorithm Figure 3 was constructed so that frequency changes of coccoliths per grid-cells can be better followed. The contoured diagrams are easier to interpret for evolutionary changes of the coccoliths.
