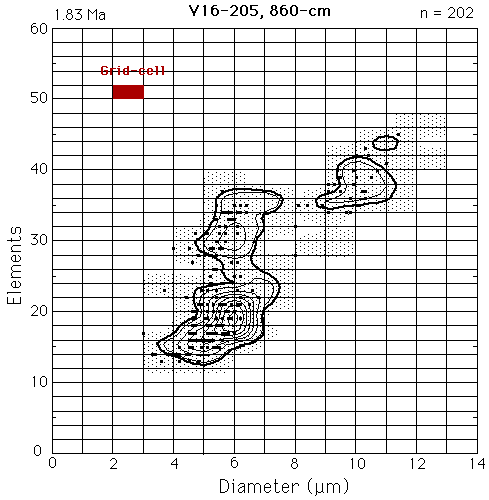
Figure 3. Gridded and contoured data derived from the scatterplot shown in Figure 2. The original scatter data are indicated by black points. The vertical and horizontal lines indicate the grid with a grid-cell size of 1 Ám by two elements. Coccoliths that fall within a grid-cell were counted using program Grid.f, which resulted in coccolith frequencies per grid-cell. The coccolith frequencies were the slight smoothing algorithm in Surface III and contour intervals of two coccoliths per grid-cell. The shaded area indicates the distribution of non-zero frequencies of less than two coccoliths per grid-cell. Note, that some shaded grid-cells contain no coccoliths which is due to smoothing and boundary effects (a coccolith, that falls onto a grid-line is encountered as half a coccolith). The thick contour line encircles areas with two or more coccoliths per grid-cell. This contour-line was chosen in order to construct the animated diagrams of coccolith changes through geological time as shown in Figure 6A-6B, Figure 8, and Figure 9.
