METHODS
Sampling and processing
In May 1993 and February 1995, about 200 samples of the top 1 cm of surface sediment were collected in environments representing a range of physical, chemical, and biological conditions
(Javaux
1999). Live (Rose Bengal stained) and total assemblages were determined in fractions of split samples including at least 300 specimens. Quantitative analyses of foraminiferal distribution in Bermuda can be found in
Javaux
(1999). Identifications of foraminiferal species were made using Bermudez and Seiglie (1965),
Bock (1971),
Brady (1884),
Buzas and Severin (1982),
Cimmermann and Langer (1991),
Cushman (1917,
1918-31),
Steinker (1980),
Todd and
Brönnimann (1957), and Wantland (1975). The generic nomenclature follows
Loeblich and Tappan (1964,
1988).
The distributions of the benthic foraminiferal species illustrated in this paper are summarized with each species in the remarks section of the systematics. These remarks include the distribution both in Bermuda and in other subtropical/tropical areas, summarized in
Table 1, Table
2, and Table 3. The data for benthic foraminifera distribution from Bermuda in brackish-water, nearshore and lagoons, backreef-reefs, and forereef-inner shelf-outer shelf (5 to 60 meters depth) is mostly new and comes in a large part from
Javaux
(1999), but also from Barnhardt (1963),
MacKenzie et al. (1965),
Pestana (1983),
Steinker and Clem (1984). Data for Florida-Bahamas is from
Bock (1971),
Todd and Low (1971),
Rose and Lidz (1977),
Steinker and Steinker (1976),
Steinker et al. (1977),
Lévy, (1991), and
Hallock and Peebles (1993); data for Tobago is from
Radford (1974); data for Jamaica is from
Martin and Liddell (1988) and
Buzas et al. (1977); data for St. Lucia is from
Sen Gupta and Schafer (1973); data for Trinidad is from
Todd and
Brönnimann (1957), Saunders (1957,
1958), and
Drooger and Kaasschieter (1958); data for Venezuela is from
Hedberg (1934); data for Puerto Rico is from
Culver (1990); data for Cuba is from
Bandy (1964); data for Barbuda is from
Brasier (1975a,
1975b) and
Radford
(1974); data for the Belize shelf is from Wantland (1975); and data for Panama (Bocas del Toro) is from
Havach and Collins
(1997). The data for Bermuda of mangrove/marsh foraminifera is from Javaux (1999),
Steinker and Butcher
(1981); data for Florida-Bahamas is from Goldstein (1976),
Phleger (1965),
Rose and Lidz (1977), and
Hallock et al. (1993); data for Tobago is from
Radford
(1974); data for Trinidad is from Todd and
Brönnimann (1957), Saunders (1957,
1958), and
Drooger and
Kaaschieter (1958); data for Puerto Rico is from Culver (1990);
data for Barbuda is from Brasier (1975a); data for Brazil is from
Zaninetti et al. (1977,
1979),
Hiltermann et al. (1981), and
Scott et al. (1990); data for equatorial regions is from
Boltovskoy and Vidarte (1977); data for Columbia is from
Boltovskoy and Hincapie de Martinez (1983); data for New Zealand is from
Gregory (1973) and Hayward et al. (1996,
1999); data for the Sunda Shelf (South China sea) is from
Biswas (1976); data for Senegal is from
Debenay et al. (1989); and data for Sinai is from
Halicz et al. (1984). These references will not be cited again in the remarks of each species distribution.
Illustration
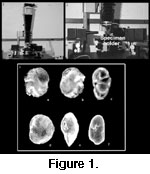 We used a Dynaphot® Scanning Light Microscope (SLM), manufactured by Irvine Optical of California, to photograph all the species illustrated in this paper
(Figs.1.1, 1.2).
This method has been described in detail in Scott et al. (2000). The SLM permits photography of specimens without coating and provides in-focus (no depth-of-field problem) color photomicrographs of each specimen most similar to the specimens the micropaleontologist sees under a dissecting reflected light microscope, in contrast to images made with scanning electron microscopes
(Fig.1.3). These pictures are the first SLM illustrations of subtropical/tropical species of benthic foraminifera and will be very useful for their identification. Foraminifera are mounted wet on a modified SEM stub with a beveled edge with a 50 micron groove to focus the light source on. (When the specimen dries, the surface tension holds it in place).
The SLM takes a composite photograph of the specimen as it moves through a lighted focal plane with a bandwidth of 50-100 photograph only records the sections that are lighted and in focus. The major limitation of the SLM is that the light bandwidth is sometimes more than the width of some smaller species. Another limitation, related to the light bandwidth, is the magnification obtainable with this system—its maximum is 45x—which is not sufficient for some of the smaller species. Although such images are in focus and can be enlarged photographically, a better quality image of small species can be obtained using higher magnification photographic systems. Finally, the horizontal, narrow band lighting means that specimens must be mounted in such a way that the light will get into critical regions such as umbilical cavities. Some features are virtually impossible to light; hence, some photographs unavoidably have dark areas. As a consequence, some of the angles of specimens are not the "standard" views that micropaleontologists are accustomed to with SEM photographs. Fuji 64T® color slide film (35 mm) was used for the photographs. We used slide film to be able to enlarge the photographs on a screen to whatever size necessary for examination. The slides are reproduced here in
Figures 2-6 after being scanned into Adobe® Photoshop and electronically adjusted for contrast and brightness. These are second-generation reproductions; the originals are high resolution color slides that have a dpi of probably 5000-6000 (as opposed to the 1000 dpi resolution of the electronic scans).
We used a Dynaphot® Scanning Light Microscope (SLM), manufactured by Irvine Optical of California, to photograph all the species illustrated in this paper
(Figs.1.1, 1.2).
This method has been described in detail in Scott et al. (2000). The SLM permits photography of specimens without coating and provides in-focus (no depth-of-field problem) color photomicrographs of each specimen most similar to the specimens the micropaleontologist sees under a dissecting reflected light microscope, in contrast to images made with scanning electron microscopes
(Fig.1.3). These pictures are the first SLM illustrations of subtropical/tropical species of benthic foraminifera and will be very useful for their identification. Foraminifera are mounted wet on a modified SEM stub with a beveled edge with a 50 micron groove to focus the light source on. (When the specimen dries, the surface tension holds it in place).
The SLM takes a composite photograph of the specimen as it moves through a lighted focal plane with a bandwidth of 50-100 photograph only records the sections that are lighted and in focus. The major limitation of the SLM is that the light bandwidth is sometimes more than the width of some smaller species. Another limitation, related to the light bandwidth, is the magnification obtainable with this system—its maximum is 45x—which is not sufficient for some of the smaller species. Although such images are in focus and can be enlarged photographically, a better quality image of small species can be obtained using higher magnification photographic systems. Finally, the horizontal, narrow band lighting means that specimens must be mounted in such a way that the light will get into critical regions such as umbilical cavities. Some features are virtually impossible to light; hence, some photographs unavoidably have dark areas. As a consequence, some of the angles of specimens are not the "standard" views that micropaleontologists are accustomed to with SEM photographs. Fuji 64T® color slide film (35 mm) was used for the photographs. We used slide film to be able to enlarge the photographs on a screen to whatever size necessary for examination. The slides are reproduced here in
Figures 2-6 after being scanned into Adobe® Photoshop and electronically adjusted for contrast and brightness. These are second-generation reproductions; the originals are high resolution color slides that have a dpi of probably 5000-6000 (as opposed to the 1000 dpi resolution of the electronic scans).
