MULTIVARIATE ANALYSIS OF DISTANCE MEASUREMENTS
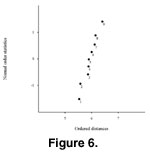
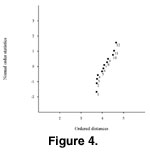 First, in order to examine the multivariate normality for each sample of the studied species, the Q-Q probability plot for each sample is made
(Figure 4, Figure 5,
Figure 6). This expression stands for
Q(uantile)-Q(uantile) probability plot. It is nothing more than advisory in nature because it provides a graphical means of assessing one aspect of multivariate normality in a sample. The plot is made using the generalized statistical distances computed for each specimen in the sample.
First, in order to examine the multivariate normality for each sample of the studied species, the Q-Q probability plot for each sample is made
(Figure 4, Figure 5,
Figure 6). This expression stands for
Q(uantile)-Q(uantile) probability plot. It is nothing more than advisory in nature because it provides a graphical means of assessing one aspect of multivariate normality in a sample. The plot is made using the generalized statistical distances computed for each specimen in the sample.
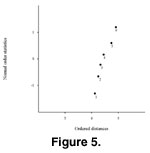 If there are strongly divergent specimens in the data, these will show up as isolated points at the top of the graph.
Figure 4, Figure 5,
and Figure 6 indicate that there are no markedly divergent specimens within each species and hence no indication of deviation from multivariate normality in the three samples.
If there are strongly divergent specimens in the data, these will show up as isolated points at the top of the graph.
Figure 4, Figure 5,
and Figure 6 indicate that there are no markedly divergent specimens within each species and hence no indication of deviation from multivariate normality in the three samples.
Next, the five measured distances were subjected to canonical variate analysis using a program by
Reyment and Savazzi (1999) to test the hypothesis that there are three different species.
 The results for the analysis yielded the ordination displayed in
Figure 7. Table 1 reveals that the 1st and 2nd canonical roots represent all the variance (100%). This table shows that the 1st normalized canonical vector may represent the relationship between the length (1 in
Table 1), the height (2) and the distance of the hinge (5). The 2nd normalized canonical vector shows the relationship between the height (2) and the length of the hinge (5). From
Figure 7, it can be concluded that the analysis could successfully distinguish males from females for each species;
The results for the analysis yielded the ordination displayed in
Figure 7. Table 1 reveals that the 1st and 2nd canonical roots represent all the variance (100%). This table shows that the 1st normalized canonical vector may represent the relationship between the length (1 in
Table 1), the height (2) and the distance of the hinge (5). The 2nd normalized canonical vector shows the relationship between the height (2) and the length of the hinge (5). From
Figure 7, it can be concluded that the analysis could successfully distinguish males from females for each species;
 however, it failed to differentiate between the shapes of the three species.
