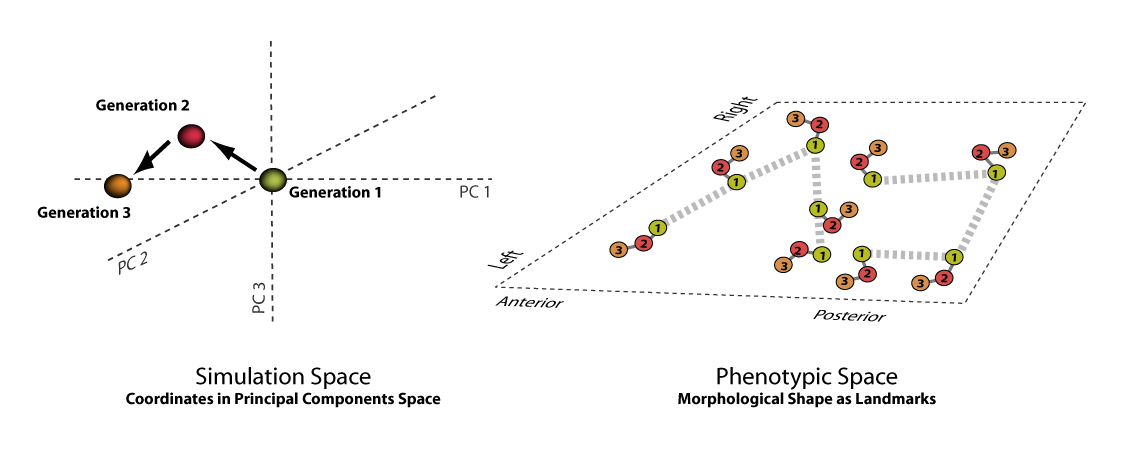
Figure 2. Each simulation is run in a principal component space (left), whose positions correspond to unique configurations of landmarks in the phenotypic space (right). The diagram illustrates three steps in a simulation of a molar tooth with nine landmarks (c.f., Figure 1). As the simulation moves through the PC space at left, the landmarks of the phenotype at right change according to the direction and size of the steps along each of the PC axes. Different phenotypic correlations are associated with each of the several PC axes, and the change in morphology at each step is the sum total of the changes on all axes. Different evolutionary modes (e.g., directional selection) are modeled by biasing the direction and length of the individual steps in the principal component space.