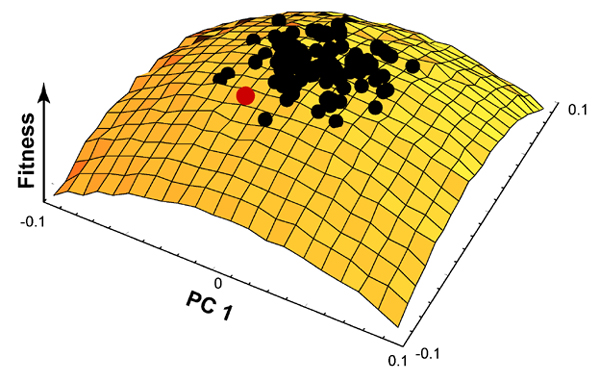
Figure 9. The adaptive landscape represented by the simulation of stabilizing selection. The optimum is at the centre of the peak, and fitness decreases away from that peak. Note the small fluctuations in the surface, which are due to the stochastic nature of the selection coefficients. The 100 phenotypes are shown as black and red dots on the surface. The red dot indicates the phenotype illustrated in Figure 10A. An animation of the fluctuating surface can be viewed.