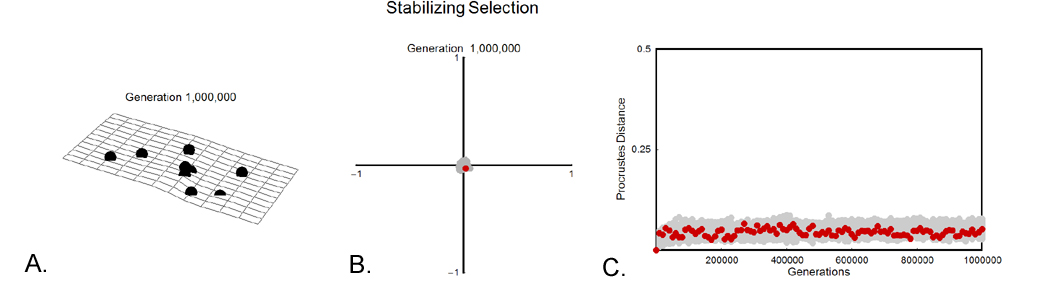
Figure 10. Results of stabilizing selection. A. The final phenotype of one of the 100 runs after 1,000,000 generations. Note that the phenotype is very similar to the starting phenotype shown in Figure 3. B. The distribution of all 100 phenotypes in principal components space after 1,000,000 generations. Note the very small dispersion compared to the first simulation. The red dot indicates the phenotype illustrated in A. Only the first two components are illustrated, but the results in panels A and C are based on all 15 axes. This panel is a two-dimensional version of Figure 9. C. The distribution of Procrustes distances relative to generation. The red trace indicates the distance of the run culminating in A. D. Animation of the entire simulation. The period of time covered by this simulation is 1,000,000 generations, which in shrews is equivalent to 800,000 – 1,000,000 years, approximately half the duration of the Pleistocene.