THE SIWALIK GROUP SNAKE RECORD
The
Siwalik Group provides a unique opportunity to examine snake faunal history due
to the large sample sizes, number of localities, and precise chronostratigraphic
control. In contrast, the majority of European and North American Neogene snake
records consists of assemblages derived from a few large, time-averaged
localities with much coarser temporal control (e.g.,
Szyndlar 1987;
Szyndlar and
Schleich 1993; Holman, 2000). The Siwalik Group additionally provides data on
evolutionary histories of South Asian snakes, which are poorly known relative to
European and North American taxa. Thus, examination of the Siwalik record
focuses on faunal change within the local section and the implications of
Siwalik snakes for understanding the larger evolution of Asian snake faunas,
after accounting for changes in record quality and taphonomic biases.
The
Siwalik snake assemblage consists of two separate records derived from
surface-collection and screen-washing, as with the mammalian record (Badgley et
al. 1995,
1998). Each method recovered specimens of different sizes.
Surface-collected methods recovered specimens with centrum lengths greater than
1 cm, whereas screen-washed methods recovered specimens with centrum lengths
less than 1 cm (Table 1). As a result, the records are treated separately in
examining record quality and sample biases. Unlike the mammalian record,
however, the two snake records sample the same fauna, because almost half of the
described taxa and morphotypes were collected using both methods (Table 1). Taxa
represented by single occurrences, Boidae? indeterminate (13.50 Ma), cf.
Erycinae indeterminate (13.55 Ma), and Gansophis potwarensis (6.78 Ma),
are not included in taphonomic and diversity analyses.
Record Quality, Specimens, and Localities
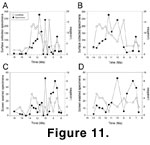 Figure 11 shows the numbers of specimens collected by both methods at 0.5 Ma
intervals, the shortest temporal interval for which localities can be combined
to produce consistently large sample sizes of specimens and localities (see
Barry et al. 1995). Intervals range from 0 to .5 Ma, with the youngest age used
as the reference datum for each. Several intervals between 6.5 and 18.0 Ma are
either poorly represented or lack snake fossils. The dataset was culled to
exclude those intervals with less than one locality for both the
surface-collected and screen-washed records. Two exceptions are the 11.5 Ma and
8.5 Ma intervals, both of which possess high record quality for one of the
records.
Figure 11 shows the numbers of specimens collected by both methods at 0.5 Ma
intervals, the shortest temporal interval for which localities can be combined
to produce consistently large sample sizes of specimens and localities (see
Barry et al. 1995). Intervals range from 0 to .5 Ma, with the youngest age used
as the reference datum for each. Several intervals between 6.5 and 18.0 Ma are
either poorly represented or lack snake fossils. The dataset was culled to
exclude those intervals with less than one locality for both the
surface-collected and screen-washed records. Two exceptions are the 11.5 Ma and
8.5 Ma intervals, both of which possess high record quality for one of the
records.
The
datasets after culling are plotted in Figure 11B, D. Culling both data sets
results in the absence of data for several important intervals, including 18.0
to 14.5 Ma, 10.5 Ma, 9.5 Ma, 8.0 Ma, and 6.0 Ma. The 18.0 to 14.5 Ma interval
spans the Kamlial Formation in the Siwalik Group. Although this interval is
crucial for determining the origin of the Siwalik snake fauna, its low record
quality renders it uninformative with respect to this analysis. The younger
intervals span a history of significant environmental change within the Siwalik
Group, and their exclusion limits interpretation of faunal histories (see
below).
 Both
records show a generally poor relationship between sample size (number of
individual specimens) and the number of localities throughout the section. The
surface-collected record shows an inverse relationship between sample size and
number of localities between the14.0 Ma and 10.0 to 9.0 Ma intervals, followed
by a more positive relationship between sample and locality sizes from 9.0 to
8.5 Ma. The screen-washed record demonstrates a positive relationship between
sample size and number of localities from 14.0 to 12.0 Ma, followed by an
inverse relationship between 11.5 and 7.0 Ma. Both records demonstrate a
decrease in sample size at 6.5 Ma.
Both
records show a generally poor relationship between sample size (number of
individual specimens) and the number of localities throughout the section. The
surface-collected record shows an inverse relationship between sample size and
number of localities between the14.0 Ma and 10.0 to 9.0 Ma intervals, followed
by a more positive relationship between sample and locality sizes from 9.0 to
8.5 Ma. The screen-washed record demonstrates a positive relationship between
sample size and number of localities from 14.0 to 12.0 Ma, followed by an
inverse relationship between 11.5 and 7.0 Ma. Both records demonstrate a
decrease in sample size at 6.5 Ma.
Comparing the records reveals two distinct histories of record quality. The
surface-collected record shows a greater concentration of specimens relative to
localities between 14.0 to 10.0 Ma, followed by a decrease in both concentration
and total number of specimens from 10.0 Ma and younger. The screen-washed record
demonstrates the inverse—a
sharp increase in the relative concentration and overall number of specimens
from 11.0 to 10.0 Ma and from 9.0 to 7.5 Ma.
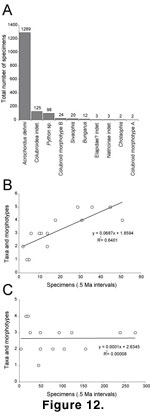
Figure 12A plots the total number of Siwalik specimens for each taxon or
morphotype. The record is dominated by Acrochordus dehmi, which
constitutes approximately 80% of the entire sample. This record differs from
most Neogene snake assemblages that often possess more even distributions of
specimens among taxa or are dominated by several taxa (e.g.,
Ivanov 2000, p.
587), and likely reflects both depositional and ecological histories within the Siwalik snake record (Head 1998, see below). The relationships between number of taxa and morphotypes and sample size for the screen-washed and surface-collected
records are plotted in Figure 12B, C. Taxonomic/morphotypic diversity has a
positive, significant relationship to sample size for the screen-washed record,
as documented for the screen-washed mammal fauna (Badgley et al. 1998), but no
significant relationship exists between diversity and sample size for the
surface-collected record.
Taphonomic Comparisons
I
examined the relationship of sample size to depositional and collection
processes using Analysis of Variance (ANOVA) and least squares linear
regression. Biases affecting sizes, distributions, and compositions of fossil
assemblages are well documented for the Siwalik Group, and consist of
variability in fluvial transport and depositional environment among
surface-collected records, and biotic agents, namely predator accumulations, for
screen-washed samples (Badgley 1986a,
1986b;
Badgley et al. 1998). These factors presumably affect the composition of the snake
faunas as well. Collection bias can be examined as sampling intensity for the
screen-washed record (see below), but cannot be measured for the
surface-collected record.
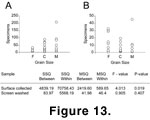 The
extent to which fluvial transport determines sample size was tested using ANOVA
between sample size and grain-size lithology for both surface-collected and
screen-washed localities.
Badgley et al. (1998) constrained the effects of
fluvial transport on screen-washed mammal assemblages from the Chinji Formation
using ANOVA and demonstrated that sample size was independent of lithology. For
the snake record, the analysis demonstrates the absence of a relationship
between sample size and grain size for screen-washed samples (Figure 13B), but
shows a statistically significant relationship between surface-collected
specimens and grain size (Figure 13A). The correlation with grain size can be
explained by depositional processes but may also represent habitat specificity
of autochthonous taxa.
The
extent to which fluvial transport determines sample size was tested using ANOVA
between sample size and grain-size lithology for both surface-collected and
screen-washed localities.
Badgley et al. (1998) constrained the effects of
fluvial transport on screen-washed mammal assemblages from the Chinji Formation
using ANOVA and demonstrated that sample size was independent of lithology. For
the snake record, the analysis demonstrates the absence of a relationship
between sample size and grain size for screen-washed samples (Figure 13B), but
shows a statistically significant relationship between surface-collected
specimens and grain size (Figure 13A). The correlation with grain size can be
explained by depositional processes but may also represent habitat specificity
of autochthonous taxa.
Least-squares linear regression was used to determine the relationship of sample
sizes in both records to locality temporal duration and the relationship of
screen-washed sample size to collection intensity and the potential for chemical
destruction. Temporal duration refers to the time span within which deposition
and incorporation of fossils occurred at individual localities, and ranged from
0.02 to 0.22 m.y. for screen-washed localities, and 0.01 to 0.16 m.y. among
surface-collected localities (see
Barry et al. 2002 for locality durations and
estimation methods). Potential biases affecting the screen-washed record include
sampling intensity and productivity, chemical destruction, and biotic agents of
assembly. As seen in Figure 12C, D, there is little correlation between sample
size and the number of screen-washed localities per interval through the Siwalik
section; however, the extent to which individual localities have been sampled
could potentially explain the increase in the number of recovered specimens from
screen-washed sites. screen-washed specimens were recovered from reduction of
bulk matrix, and the measure of sampling intensity was the total mass of
processed matrix from each locality (Badgley et al. 1998).
Comparison with the Siwalik rodent record was used to test the influence of
chemical destruction because screen-washed vertebrate remains of similar size
and composition should show similar patterns of changing abundance if changes in
sample size through time are the result of changing chemical preservation modes.
 Material differences in rodent teeth and snake vertebrae somewhat limit the use
of rodents as proxy data for chemical environment, because dense enamel is more
resistant to destruction. However, the record provides at least a first-order
approximation.
Material differences in rodent teeth and snake vertebrae somewhat limit the use
of rodents as proxy data for chemical environment, because dense enamel is more
resistant to destruction. However, the record provides at least a first-order
approximation.
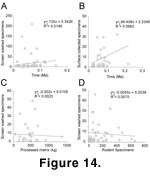
Regression of sample size onto the described taphonomic variables failed to
produce significant relationships (Figure 14A-D). ANOVA results indicate that
depositional bias affects the surface-collected record in the same general
pattern as for other Siwalik vertebrates, with the lowest sample sizes in
fine-grained deposits (Badgley et al. 1995,
1998), but no significant bias
amongst the screen-washed records. The independence of screen-washed snake
records from any of the examined sources of bias suggests an agent of
accumulation other than sedimentological, chemical, or collection processes,
such as predation, as proposed for Chinji Formation rodents (Badgley et al. 1998).
Taxonomic and Ecological Richness
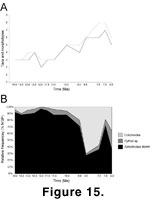 Figure 15B plots
relative frequency of taxa/morphotypes, expressed as number of identified
specimens (NISP) from the combined records. Both raw
richness and range-through (Cheetham and Deboo 1963) values are plotted.
Overall, the number of taxa and morphotypes increases through time in the
Siwalik Group: richness is comparatively low through the Chinji Formation,
followed by a progressive increase through the Nagri and Dhok Pathan formations,
starting between 11.0 and 10.0 Ma, with maximum richness at 7.0 Ma, and a
decline at 6.5 Ma. This pattern is consistent within both the screen-washed and
surface-collected records. Raw and range-through values track each other,
suggesting that the increase in taxa and morphotypes is a historical event as
opposed to simply a preservational bias. The pattern of increasing richness is
similar to the increasing sample size within the screen-washed record (Figure
11D), reflecting (in part) the positive relationship between
taxonomic/morphotypic diversity and sample size in the screen-washed record. The
richness increase in the surface-collected record is concurrent with a decrease
in sample size (Figure 11B, Table 2), however, indicating that sample size
alone does not explain the increase.
Figure 15B plots
relative frequency of taxa/morphotypes, expressed as number of identified
specimens (NISP) from the combined records. Both raw
richness and range-through (Cheetham and Deboo 1963) values are plotted.
Overall, the number of taxa and morphotypes increases through time in the
Siwalik Group: richness is comparatively low through the Chinji Formation,
followed by a progressive increase through the Nagri and Dhok Pathan formations,
starting between 11.0 and 10.0 Ma, with maximum richness at 7.0 Ma, and a
decline at 6.5 Ma. This pattern is consistent within both the screen-washed and
surface-collected records. Raw and range-through values track each other,
suggesting that the increase in taxa and morphotypes is a historical event as
opposed to simply a preservational bias. The pattern of increasing richness is
similar to the increasing sample size within the screen-washed record (Figure
11D), reflecting (in part) the positive relationship between
taxonomic/morphotypic diversity and sample size in the screen-washed record. The
richness increase in the surface-collected record is concurrent with a decrease
in sample size (Figure 11B, Table 2), however, indicating that sample size
alone does not explain the increase.
Figure 15B plots relative frequency of taxa/morphotypes, expressed as number of
individual specimens (NISP) from the combined records. Because sample sizes are
extremely small for most taxa (Table 2,
Table 3), all colubroid taxa and morphotypes
are summed as Colubroidea. Between 14.0 and 10.0 Ma, Acrochordus dehmi
represents between 88-97% of all recovered specimens. Between 10.0-8.5 Ma, the
relative frequency of A. dehmi decreases sharply to 28%, due to
both lower sample sizes for the taxon and the influx of colubroid specimens. The
spike in relative frequency of Acrochordus at 7.0 Ma is partially
artifactual, because that interval includes a locality (Y-935) containing a
large number of elements (84) that likely represent a single, associated,
surface-collected skeleton.
Changes in taxonomic richness and relative frequency are coeval with changes in
depositional environment, despite a poor correlation of sample size to lithology
for the screen-washed record. The three Siwalik formations included between 14.0
and 6.5 Ma represent distinct fluvial systems. The Chinji Formation (14.2 to
11.2 Ma) is primarily a fine-grained sequence representing large upland-sourced
river systems, and characteristically includes regularly spaced overbank
deposits. The Nagri Formation (11.2 to 9.0 Ma) is characterized by massive
sandstones and represents large trunk systems. The Dhok Pathan Formation (10.1
to 3.5 Ma) is fine grained and represents smaller, upland-sourced river systems
with increased avulsion and poorly drained floodplains (Willis and Behrensmeyer
1995; Barry et al. 2002). The domination by Acrochordus occurs through
the larger river systems of the Chinji and Nagri Formations between 14.0 and
11.0 Ma, and decreases throughout the more heterogeneous Dhok Pathan Formation.
The increase of taxonomic and morphotypic richness is approximately concurrent
with the transition from the Nagri fluvial system to the Dhok Pathan system at
approximately 10.1 Ma (Barry et al. 2002),
with the oldest locality at which diversity increases dated to 10.2 Ma (Y-450).
Changes in relation to depositional environment are consistent with inferred
ecology. Acrochordus dehmi, Python sp., and Colubroidea can be
broadly characterized for habitat and prey preference via phylogenetic
constraint and comparison with extant sister taxa. Acrochordus represents
a fully-aquatic piscivore (Shine 1986a,
1986b). Python represents a
terrestrial predator of large vertebrates (Murphy and Henderson 1997). Colubroidea represent a wide range of semi-aquatic to fully terrestrial small
carnivores (e. g., Mushinsky 1987). Within this context, the snake fauna of the Chinji and Nagri formations are predominately aquatic, and the Dhok Pathan
record includes increasing representation of both large and small semi-aquatic
and terrestrial taxa. Python is present in low abundance as a large
vertebrate predator throughout the entire Siwalik sequence, and likely
represents an allochthonous component of most depositional environments.
