METHODS
Initially, all fossils and fossil fragments were picked from the > 2 mm aliquot. For this analysis, all complete bivalve fossils and fragments that were (1) at least two-thirds complete and (2) were identifiable to at least a generic level were counted. Because almost all of the bivalves are disarticulated into two valves, this counting method estimates the maximum abundance of bivalves present in the assemblage. Furthermore, because this study is based exclusively on bivalves, there was no attempt made at this juncture to convert these maximum counts of bivalve individuals into a number that can be used to compare bivalve abundances to those of gastropods, scaphopods, solitary corals or other taxa, nor with colonial organisms like bryozoans.
Some groups of bivalves were identified to generic and species levels based on descriptions by
Maury (1917). While we recognize that there has been some systematic revisions and synonimization of these taxa, this preliminary study was more concerned with the identification of species-level groupings rather than on their taxonomic revision. Although some bivalves were not identified to the generic level, they were still counted so that we could obtain a snapshot of the entire bivalve paleocommunity and examine dominance patterns.
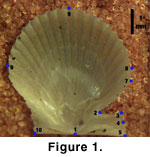 All 22 individuals of "Pecten" thompsoni were selected for morphometric analysis from Sample 052500-1C while 21 individuals were randomly selected for analysis from Sample 060700-2A. Specimens were imaged with either a Kodak MDS100 digital camera mounted on a Wild M400 dissecting microscope or a high- resolution flatbed scanner. Digital images were then imported as jpeg files into TnImage 3.0.6 (Linux) where 10 specimen landmarks were digitized (Figure 1).
The raw landmark data were used to calculate specimen size and describe the shape of the shell. Size was calculated as centroid size, which can be described independently of shape (Bookstein 1991), and bears the advantage of being uncorrelated with measures of shape in the absence of allometry.
Shape was described using principal warp analysis (Bookstein 1991), which summarizes shape as a transformation relative to a common reference form. Specimens were first scaled to unit centroid size and rotated to maximum interspecimen alignment using a Procrustes iterative alignment. Each specimen, or its map of landmarks, may then be represented in a special "shape space," relative to the common reference form, with each unique landmark configuration occupying a unique position in the shape space. This resulting Kendall shape space (Kendall 1986; actually, the small portion occupied by the distribution of specimens) is then projected onto a tangential Euclidean space where the axes correspond to the major dimensions of specimen distribution (variation) in the curved shape space (principal warps) (Rohlf 1996), with specimen coordinates on these axes (partial warp scores) summarizing specimen shape. Procrustes alignment and principal warp analyses were performed with tpsRelw (Rohlf 2002).
Shape variation was tested with multivariate analysis of variance (MANOVA) of partial warp scores and subsequent classification of specimens performed using canonical variates analysis (CVA). Intrasample allometry was tested by regression of relative warp scores on centroid size. Relative warps are factors (principal components of partial warp scores) which themselves summarize the major vectors of shape variation within samples. Because relative warps are independent components decomposing shape, a proper depiction of allometry is the multiple regression of size on all relative warps, or the individual regression of relative warps on size. The latter approach is used here. All statistical analyses were performed with SYSTAT 10 (Windows) and Stata 8.0 (Linux).
