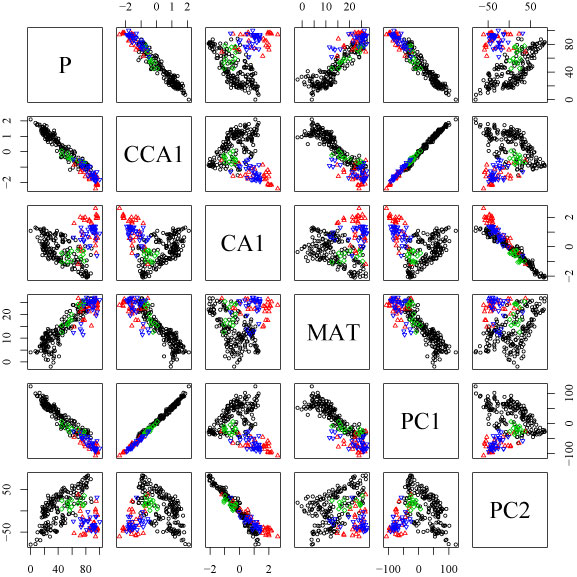
Figure 4. Traditional pairs plot as used in Basford and Tukey (1999). This is simply a matrix of scatter plots showing the relationships between each pair of a set of variables. All the data here are restricted to the original 29 CLAMP variables. In particular, note the similarity between PC1 and CCA1, demonstrating how little it matters which eigenvector method is chosen. Plots above the diagonal are inverses of the plots in the lower diagonal. Note that the plots in the third row, second column and sixth row, fifth column are exact duplicates of the right-hand two plots in Figure 3.