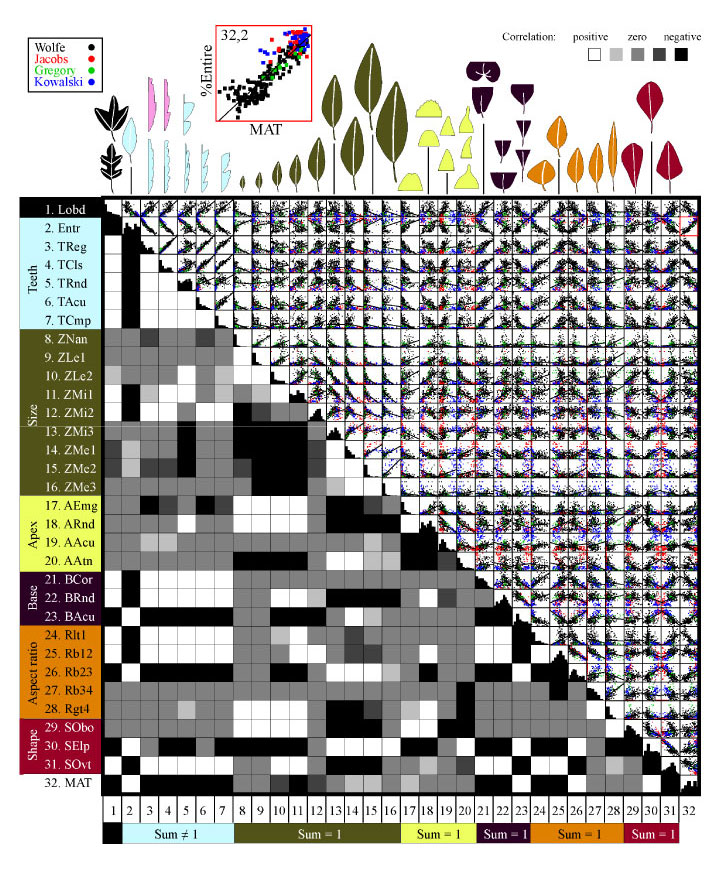
Figure 5. Elaborated pairs plot of 31 explanatory and one response variable. The variables are represented along the top of the matrix by the figures from Wolfe (1993) that were originally used to illustrate them, and along the left side by their abbreviated names. In two cases—"teeth regular" and "teeth close"—the line drawings colored red also show the opposite of the character being coded, "teeth irregular" and "teeth distant." Groups of related variables are shown by the colored bars along the top and left and those groups of related variables that are constrained to sum to 1 are so marked along the bottom of the matrix. Above the diagonal are scatter plots like the example shown in Figure 1; below the diagonal, the white, black, and grey squares show whether the relationships between the variables are statistically significant. The white squares show a strong positive relationship between the variables, the black a strong inverse relationship, and the intermediate shades of grey show weaker or absent relationships. Along the diagonal are plotted histograms of each of the 32 variables (the marginal distributions for the bivariate plots). (For larger version click image.)