|
SPECTRAL ANALYSIS
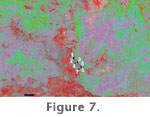 Visualization of band combination 7-3-1 (R-G-B respectively) was used to define and to collect spectral signatures. Although the spectral parameters of all seven bands were taken for each pixel, these three bands were chosen because they show the greatest contrast. It is impossible technically to assign more than three bands at the same time in viewer window, but our analytical procedure involves a classes,' we applied the unsupervised classification algorithm - ISODATA (with 5 to 30 classes over three iterations as conditions) to this full band false color image (Figure 6). Experience shows that three iterations are enough to allow the pixel classification to settle and become consistent; each additional iteration re-calculates and re-classifies pixels thus generalizing the statistics. Analysis of the resultant ISODATA images shows that topographic features are seen rather than geological ones (Figure 7). This preliminary step illustrates the general spectral homogeneity of the Syrdarya field area; this is also obvious in the true colored image (Figure 5). This image shows that the known localities fit into mixed classes (Figure 7) based on the ISODATA algorithm. Visualization of band combination 7-3-1 (R-G-B respectively) was used to define and to collect spectral signatures. Although the spectral parameters of all seven bands were taken for each pixel, these three bands were chosen because they show the greatest contrast. It is impossible technically to assign more than three bands at the same time in viewer window, but our analytical procedure involves a classes,' we applied the unsupervised classification algorithm - ISODATA (with 5 to 30 classes over three iterations as conditions) to this full band false color image (Figure 6). Experience shows that three iterations are enough to allow the pixel classification to settle and become consistent; each additional iteration re-calculates and re-classifies pixels thus generalizing the statistics. Analysis of the resultant ISODATA images shows that topographic features are seen rather than geological ones (Figure 7). This preliminary step illustrates the general spectral homogeneity of the Syrdarya field area; this is also obvious in the true colored image (Figure 5). This image shows that the known localities fit into mixed classes (Figure 7) based on the ISODATA algorithm.
 Our attempt to produce an image classification using the Band Ratio method resulted in the image shown in
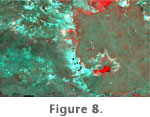
Figure 8. We calculated band ratios for clay minerals (red) and for ferrous minerals (bright green) (Figure 8): this supports the argument that the vertebrate fossils found to date in this region have been transported because ferrous minerals are usually determined by this algorithm as characteristic of weathered or disturbed areas. Our attempt to produce an image classification using the Band Ratio method resulted in the image shown in
Figure 8. We calculated band ratios for clay minerals (red) and for ferrous minerals (bright green) (Figure 8): this supports the argument that the vertebrate fossils found to date in this region have been transported because ferrous minerals are usually determined by this algorithm as characteristic of weathered or disturbed areas.
Next we used a Z Profile (Spectrum) function of RSI ENVI to collect spectra from most discernible pixel associations and applied Spectral Angle Mapper (RSI ENVI) to the whole multiband Landsat image (Figure 9). Although we use 7-3-1 visualisation to collect spectra, the full-band spectral signatures were recorded for each pixel examined as the algorithm operates with a
full set of bands. This approach defined the following numbered spectral
classes: (1) Yellow Late Cretaceous Clays – shown in yellow pixels; (2) red Late
Cretaceous clays – shown in red pixels; (3) overlying Neogene and Paleogene
sediments – shown in blue pixels; (4) Quaternary clay beds – shown in white
pixels; (5) dryed bottom of temporary lake – sea green pixels. All of these spectra were saved as a library for subsequent analyses.
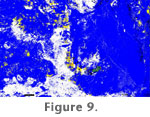 Analysis of this image (Figure 9) shows that Quaternary and Neogene classes are distributed evenly through the entire image, and that the margins of outcrops in the field are unclassified in this approach (colored black). The central part of the plateau depression is occupied by a dried lake (which may be filled with water in the early spring), while the area to the south of the plateau is comprised of mixed soils, sometimes covered with vegetation. This explanation shows why the spectral characters of these Quaternary elements may differ from those of the Quaternary sediments, which are white in the spectral analysis. The red and yellow pixels (Cretaceous sediments) also fit – could be applied to other adjacent regions of Kazakhstan that are also covered by images available from Landsat ETM +. Analysis of this image (Figure 9) shows that Quaternary and Neogene classes are distributed evenly through the entire image, and that the margins of outcrops in the field are unclassified in this approach (colored black). The central part of the plateau depression is occupied by a dried lake (which may be filled with water in the early spring), while the area to the south of the plateau is comprised of mixed soils, sometimes covered with vegetation. This explanation shows why the spectral characters of these Quaternary elements may differ from those of the Quaternary sediments, which are white in the spectral analysis. The red and yellow pixels (Cretaceous sediments) also fit – could be applied to other adjacent regions of Kazakhstan that are also covered by images available from Landsat ETM +.
Our fieldwork has shown that this combined map (Figure 9) is the most informative for pinpointing locations of possible fossil sites. Taken during the late summer of 2007, a transect from Shakh-Shakh hill along the western outcrops and then further to the west in the direction of Egizkara yielded almost perfect results - our research team found at least fragmentary fossil material in most places revealed by the Landast analysis. This compares very well to more traditional surface prospecting of sediments of the correct age where our teams found fossil material much less frequently.
|