|
|
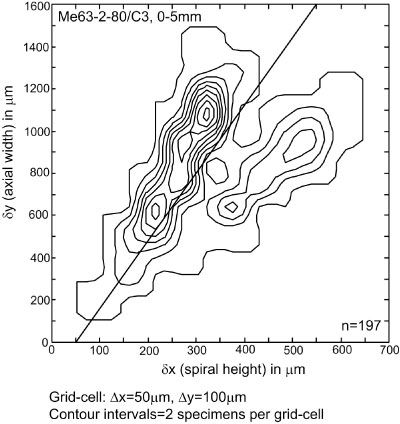
Figure 18. Example 2 of a bivariate frequency distribution of spiral height (Delta X) versus axial width (Delta Y) from 197 specimens of G. menardii cultrata (above line) and an mixture of G. menardii menardii and G. tumida (below line) in keel view from Holocene sample Me63-2-80/C3, 0-5mm and imaged with the new system of AMOR. The sample comes from the Guinea Basin (collected within the framework of project DIVA II of Deutsches Zentrum für Marine Diversitätsforschung (DZMB) during Meteor-cruise 63/2, station 80, lat. 0° 50.0' N / long. 5° 35.0' W, waterdepth 5138m). Same grid-cell size and contour intervals as in Figure 17. In this example the distribution is clearly bimodal.
|