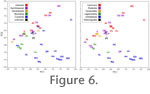
MULTIVARIATE ANALYSESLinear Postcranial MeasurementsA PCA of linear postcranial measurements resulted in two factors with eigenvalues > 1.0, together accounting for 88.2% of the variance. PC1 described postcranial variation primarily attributable body size; all variables except Ulna Diameter (UDML; see Table 2 for abbreviations) had very high positive loadings on PC1 (> 0.700, most > 0.850; Table 3). PC2 described postcranial variation primarily attributable to locomotor habit; UDML and HWD had high positive loadings (arboreal and semifossorial mammals typically have robust forelimb bones) whereas Metatarsal III Length (MT3L) had a high negative loading (distal limb elongation is typical of cursorial and some bounding mammals).
Protypotherium plots near the center of both PC axes, extremely close to the cursorial rodent Dasyprocta. Other nearby taxa include two semifossorial rodents (Myocastor and Lagostomus) and an arboreal one (Capromys). All of these except Dasyprocta have body masses of 6-9 kg, within the range inferred for Protypotherium. The position of Protypotherium in PC morphospace suggests that it is postcranially more similar to medium-sized caviomorph rodents than to comparably-sized carnivorans, lagomorphs, hyracoids, or artiodactyls; it says little about its locomotor habit other than that its postcrania are not as modified for force production as Erethizon or Dinomys nor as modified for speed as Dolichotis.
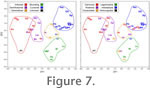
Misclassified mammals included: Dendrohyrax (semifossorial instead of arboreal), Herpestes (generalized instead of semifossorial), Mephitis (arboreal instead of semifossorial), Myoprocta (generalized instead of cursorial), and Oreotragus (bounding instead of cursorial). Except for Dendrohyrax, the true locomotor group of each of these mammals had the next highest posterior probability; in Dendrohyrax, it had the second lowest posterior probability (higher only than cursorial). It is notable that in no case was an arboreal or semifossorial mammal misclassified as bounding or cursorial (or vice versa). Protypotherium was classified as arboreal with a high posterior probability (0.984) but an extremely low conditional probability (0.000). In other words, based on these data, Protypotherium resembles arboreal mammals more than those in other locomotor groups, but it is quite different from the arboreal mammals considered here. This is apparent in Figure 7; Protypotherium plots closest to the arboreal group centroid but is much farther from that centroid than any member of that group. Semifossorial was the second most probable classification for Protypotherium. Based strictly on the DFA of linear postcranial measurements, it is unlikely that Protypotherium was a highly cursorial or bounding mammal. Functional Indices
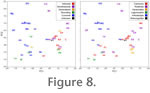
A PCA of functional indices resulted in two factors with eigenvalues > 1; the first two accounted for 63.6% of the variance (Table 4). PC1 primarily described variation due to locomotor habit and therefore resembled PC2 of the linear postcranial measurements analysis; arboreal and semifossorial mammals generally had high values on this axis whereas cursorial and bounding mammals generally had low values. Epicondylar Index (EI) and Femur Robustness Index (FRI) had the highest positive loadings (Index of Fossorial Ability, IFA, and Humeral Robustness Index, HRI, are slightly lower) and Crural Index (CI), Metatarsal/Femur Index (MFI), and Brachial Index (BI) all had high negative loadings; the former are expected to be greater in arboreal and semifossorial mammals whereas the latter are expected to be greater in cursorial and bounding mammals. Only a few exceptions to the locomotor distributions on PC1 are evident (Figure 8).
PC2 was primarily a phylogenetic axis, with mammals more or less distributed based on their ordinal affiliation, irrespective of locomotor habit; these groupings had much overlap, however. HRI, BI, and Gluteal Index (GI) had the highest positive loadings on this axis and no variable loaded negatively. Protypotherium plots closest in the PCA to Herpestes and Mephitis, two small (2-3 kg), semifossorial carnivorans. Other closely positioned mammals include Hyemoschus (discussed above) and Potos (an arboreal carnivoran similar in size to Herpestes and Mephitis). Given that Hyemoschus plots distant from other cursorial artiodactyls, Protypotherium can best be described as plotting in the generalized end of the semifossorial/arboreal region of PC1 and among rodents and carnivorans on PC2. It is quite distant from most cursorial and bounding mammals.
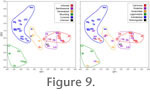
Two of the mammals misclassified by the DFA of functional indices were also misclassified by the DFA of linear postcranial measurements: Mephitis was classified as arboreal instead of semifossorial (as in the DFA of linear measurements), and Dendrohyrax was classified as generalized instead of arboreal (it was classified as semifossorial in the DFA of linear measurements). The three other misclassified mammals included Hyemoschus (generalized instead of cursorial), Cuniculus (arboreal instead of semifossorial), and Dasyprocta (generalized instead of cursorial). As in the other DFA, except for Dendrohyrax, the true locomotor group of each of these mammals was second most probable. In no case was an arboreal or semifossorial mammal misclassified as bounding or cursorial (or vice versa). Protypotherium was classified as semifossorial with a moderately low posterior probability (0.493) and a higher conditional probability (0.654). The second most likely classification for Protypotherium was arboreal, with a posterior probability of 0.441. In contrast to its position in the DFA of postcranial measurements, Protypotherium falls well within the morphospace occupied by extant mammals, close to Myocastor (Figure 9). Concordant with the DFA of postcranial measurements, the DFA of functional indices suggests it is unlikely that Protypotherium was a highly cursorial or bounding mammal. |
|