| |
METHODS
In order to test the proposed models for septal formation and explore variation in suture form, published suture patterns were analyzed using the GIS approach discussed above.
Ammonoid Taxa
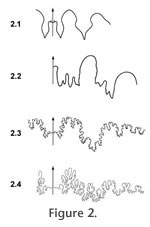 Several ammonoid taxa representing different sutural forms were chosen for this study (Figure 2). Cretaceous ammonites with complex sutures (i.e., with many subfolds) are represented by the large Middle Turonian species Coilopoceras springeri (Acanthocerataceae, Coilopoceratidae;
Cobban and Hook 1980) and the remarkably variable Early Cenomanian species Neogastroplites muelleri (Hoplitaceae, Hoplitidae;
Reeside and Cobban 1960). For comparison, much simpler sutures (i.e., with few or no subfolds) from Carboniferous goniatites, including an ontogenetic sequence of Metadimorphoceras subdivisum (Dimorphocerataceae, Dimorphoceratidae;
Manger and Quinn 1972) and five species of Somoholites (Goniatitaceae, Glaphyritidae;
Saunders 1971;
Titus and Manger 2001), were included. The selection of taxa for inclusion and the overall sample size were limited by the availability of publications that included multiple figured suture patterns per taxon. The great majority of the systematic literature for ammonoids includes only one or two figured suture patterns for each new taxon described; this paucity of suture variation data in the literature is problematic (see
Discussion below). It should be noted that the nature of the published data may produce a particular sampling bias, especially for the Paleozoic goniatites—there may have been something unusual about the taxon's anatomy that prompted the author to include additional figures in the original monograph. Hence, the taxa included here should not be viewed as a randomly selected sample of ammonoid diversity. Institutional abbreviations: Mineralogisch Geologisch Museum Technische Hogeschool Delft (MTHD); University of Iowa (SUI); U.S. National Museum of Natural History (USNM). Several ammonoid taxa representing different sutural forms were chosen for this study (Figure 2). Cretaceous ammonites with complex sutures (i.e., with many subfolds) are represented by the large Middle Turonian species Coilopoceras springeri (Acanthocerataceae, Coilopoceratidae;
Cobban and Hook 1980) and the remarkably variable Early Cenomanian species Neogastroplites muelleri (Hoplitaceae, Hoplitidae;
Reeside and Cobban 1960). For comparison, much simpler sutures (i.e., with few or no subfolds) from Carboniferous goniatites, including an ontogenetic sequence of Metadimorphoceras subdivisum (Dimorphocerataceae, Dimorphoceratidae;
Manger and Quinn 1972) and five species of Somoholites (Goniatitaceae, Glaphyritidae;
Saunders 1971;
Titus and Manger 2001), were included. The selection of taxa for inclusion and the overall sample size were limited by the availability of publications that included multiple figured suture patterns per taxon. The great majority of the systematic literature for ammonoids includes only one or two figured suture patterns for each new taxon described; this paucity of suture variation data in the literature is problematic (see
Discussion below). It should be noted that the nature of the published data may produce a particular sampling bias, especially for the Paleozoic goniatites—there may have been something unusual about the taxon's anatomy that prompted the author to include additional figures in the original monograph. Hence, the taxa included here should not be viewed as a randomly selected sample of ammonoid diversity. Institutional abbreviations: Mineralogisch Geologisch Museum Technische Hogeschool Delft (MTHD); University of Iowa (SUI); U.S. National Museum of Natural History (USNM).
Morphological Analyses in GIS
Published images of six to 20 suture patterns, depending on the taxon, were scanned as grayscale images at 600 dpi using a flatbed scanner. These published two-dimensional suture images were made by the original authors in the conventional way: by tracing the suture using a camera lucida (employing a rotating specimen mount) or tracing directly off the specimen onto a clear flexible medium (such as acetate film or plastic tape). Only right sutures of the five Somoholites spp. were figured, a common practice among Paleozoic ammonoid workers (see discussion below); data for the other taxa includes both right and left sutures. (Note that, in a quirk of anatomical terminology, a "right" suture refers to a suture pattern from the ventral midline to the umbilical margin of the left side of the shell, from the animal's perspective. This inconsistency results from the convention of figuring sutures from a ventral view, with the adapertural direction facing up the page; see
Figure 1). Where possible, the right and left sides of the same suture were both scanned. For C. springeri, only adult suture patterns were included. For the other taxa, available figured sutures were from juvenile specimens (N. muelleri) or the developmental stage was unspecified by the author (M. subdivisum and Somoholites spp.).
 Using image editing software, the scanned suture patterns were scaled to a width of 5000 pixels and saved as .jpg files. These files were then imported into the ArcGIS software system (ESRI 2007). The ArcTools digitizing tool was used to digitize C. springeri suture patterns, while the other taxa were digitized manually in ArcMap. These digitized lines were saved as new line features.
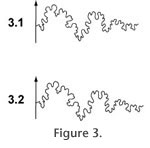
Figure 3 illustrates the fidelity of the digitizing process;
Figure 3.1 shows the output of the flatbed scanner for a suture of N. muelleri while
Figure 3.2 shows the product of digitizing that image in ArcMap. Once suture lines were digitized, points representing two landmarks were manually placed on each suture. These landmarks were chosen to bound the lateral sutural element, which is the most variable portion of the suture pattern for many taxa (Figure 1). Special care was taken to ensure that landmark placement was consistent within each taxon and that landmarks were placed at the precise tip (i.e., inflection point) of the bounding suture lobe. Segments of the digitized suture pattern beyond each landmark were then removed, leaving only the lateral elements. Information about the specimen (e.g., taxonomy, shell diameter, museum catalog number, publication source) was entered into the attribute table for each suture line. Using image editing software, the scanned suture patterns were scaled to a width of 5000 pixels and saved as .jpg files. These files were then imported into the ArcGIS software system (ESRI 2007). The ArcTools digitizing tool was used to digitize C. springeri suture patterns, while the other taxa were digitized manually in ArcMap. These digitized lines were saved as new line features.
Figure 3 illustrates the fidelity of the digitizing process;
Figure 3.1 shows the output of the flatbed scanner for a suture of N. muelleri while
Figure 3.2 shows the product of digitizing that image in ArcMap. Once suture lines were digitized, points representing two landmarks were manually placed on each suture. These landmarks were chosen to bound the lateral sutural element, which is the most variable portion of the suture pattern for many taxa (Figure 1). Special care was taken to ensure that landmark placement was consistent within each taxon and that landmarks were placed at the precise tip (i.e., inflection point) of the bounding suture lobe. Segments of the digitized suture pattern beyond each landmark were then removed, leaving only the lateral elements. Information about the specimen (e.g., taxonomy, shell diameter, museum catalog number, publication source) was entered into the attribute table for each suture line.
 Once the individual suture patterns were established in the ArcGIS environment, they could be visualized, manipulated, and compared. Sutures within each taxon were all scaled to the same arbitrary dimensions by aligning the two landmarks, using one suture pattern as the base to which others were matched. Sutures can then be overlain precisely by matching the two landmarks, allowing the suture patterns to be directly compared. It should be noted here that the scale used was specific to each taxon among the four groups included in the study, so measurements cannot be directly compared across taxa. Left sutures were scaled to each other, and also mirror-imaged in ArcMap, so they could be aligned directly with right sutures. Once the individual suture patterns were established in the ArcGIS environment, they could be visualized, manipulated, and compared. Sutures within each taxon were all scaled to the same arbitrary dimensions by aligning the two landmarks, using one suture pattern as the base to which others were matched. Sutures can then be overlain precisely by matching the two landmarks, allowing the suture patterns to be directly compared. It should be noted here that the scale used was specific to each taxon among the four groups included in the study, so measurements cannot be directly compared across taxa. Left sutures were scaled to each other, and also mirror-imaged in ArcMap, so they could be aligned directly with right sutures.
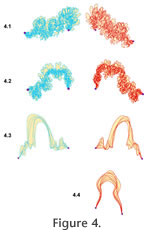
As well as visual comparison, two basic types of measurements were used to compare suture patterns – lengths of suture lines and areas of polygons defined by overlapping sutures. The units of these lengths and areas are given in arbitrary units, specific to each taxon. Hence, measurements can be meaningfully compared within a taxon, but should not be compared across taxa. Suture line lengths are automatically determined by the ArcGIS software. Because each suture line segment ends at the same, fixed landmarks, the suture lengths reflect the relative degree of folding of the septal margin. In addition to suture lengths, two areas were defined. First, polygons were created that spanned the full spatial range defined by a taxon's sutures, using the ArcMap Topology-Construct tool (Figure 4). The areas of these polygons (Table 1) provide a comparative measure of
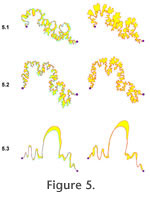 the variability of suture form: more tightly constrained sutures will fill in a smaller area than sutures that are more free to vary in the path they take from one landmark to the other. Second, two suture patterns were overlain and the polygons representing mismatch of the patterns were determined (Figure 5). The summed area of these polygons (Table 2) reflects the relative degree of congruence between the two suture patterns. the variability of suture form: more tightly constrained sutures will fill in a smaller area than sutures that are more free to vary in the path they take from one landmark to the other. Second, two suture patterns were overlain and the polygons representing mismatch of the patterns were determined (Figure 5). The summed area of these polygons (Table 2) reflects the relative degree of congruence between the two suture patterns.
To assess measurement error, one right and one left suture were selected for each taxon (two rights for Somoholites), and each suture was then re-digitized and rescaled five times. The lengths of the five replicate sutures were determined, as was the total area spanned by the five replicates. These replicate measures were then used to calculate the variation in length and area that can be explained solely by the measurement process (Table 3). These errors were uniformly low relative to the differences observed among different sutures.
|