

 The effect of singletons and interval length on interpreting diversity trends from the palaeobotanical record
PE Article Number: 15.1.6A
https://doi.org/10.26879/266
Copyright Palaeontological Association, February 2012
Author biographies
Plain-language and multi-language summaries
PDF version
Submitted 8 January 2011. Accepted 14 November 2011.
{flike id=123}
ABSTRACT
The reliability and the identification of potential biases are central aspects to providing an accurate robust palaeontological data analysis. In the last decade, older concepts of evolutionary processes and patterns have been revised in the light of new methods and hypotheses. Moreover, new mathematical algorithms have been developed to better interpret evolution and to reduce several biases inherent in the fossil record from the animal viewpoint. This new global study, based on a complete overview of the plant fossil record, uses comparisons with previously established palaeofloristic patterns and employs a set of regression, accumulative and evolutionary analyses to test the influence of two important variables in the inference methods: the role of singleton taxa and the duration of the time units. The regression analyses reveal that the duration of the time units employed does not distort our perception of the number of singletons at the family level. Likewise, the duration as single factor also does not affect the measures of taxonomic diversity, and does not influence representation of the main evolutionary patterns of vascular plants. The analysis reveals that the per-capita origination and extinction rates used provide global diversity patterns that diminish the effects of the possible taxonomic problems and preservational biases relating to the controversial nature of singleton taxa due to its restricted record, and they reveal that the main trends and plant turnover is characterized by slight abrupt changes, thus providing a more realistic vision about the dimension and magnitude of the observed evolutionary processes and diversification patterns from the plant fossil record.
Borja Cascales-Miñana. Department of Earth Sciences, University of Zaragoza. c/ Pedro Cerbuna 12, 50009 Zaragoza, Spain.
José Bienvenido Diez. Dpto. Xeociencias Mariñas e Ordenación do Territorio, Facultade de Ciencias do Mar, Universidade de Vigo, 36310 Vigo, Spain.
KEY WORDS: fossil record; palaeofloristic pattern; palaeontological data analysis; plant evolution; singleton taxa
FULL CITATION: Cascales-Miñana, Borja and Bienvenido Diez, José. 2012. The effect of singletons and interval length on interpreting diversity trends from the palaeobotanical record. Palaeontologia Electronica Vol. 15, Issue 1; 6A, 20p;
palaeo-electronica.org/content/2012-issue-1-articles/123-palaeofloristic-patterns
INTRODUCTION
In agreement with the Niklas' works (Niklas et al., 1980, 1983, 1985; Niklas, 1982, 1997, 2000), and the Benton's reflections on the fossil record (Benton, 1995, 1997; Benton and Hitchin, 1996, 1997; Benton et al., 2000), recent studies using the entire plant fossil record have clarified the main episodes of plant evolution on Earth by incorporating origination processes and extinction events (Cascales-Miñana et al., 2010; Cascales-Miñana and Cleal, 2012). Nevertheless, many aspects of such analyses, particularly those concerning the methodological biases, remain poorly resolved.
Over the past 15 years, many ideas on Phanerozoic animal evolution have been revised in the light of new methods and hypotheses, and Foote's works on the limitations and use of a taxon's stratigraphic range as a source of information about past life became particularly relevant, together with the application of new mathematical algorithms to better interpret evolution from the fossil record (Foote, 2000a, 2000b, 2003, 2005, 2007; Peters and Foote, 2001, 2002). In this way, from the Raup's studies about the role of the geologic record, in particular about the influence of the outcrop areas, in our perception of the life of the past (Raup, 1972, 1976; Raup and Stanley, 1978), many studies have followed these principles, and they have improved the measures of potential constraints of the fossil record employing modern computerized databases (Markwick and Lupia, 2002; Alroy, 2003; Ros and De Renzi, 2005; Uhen and Pyenson, 2007).
Nevertheless, all these methodologies have generally been tested based on the animal fossil record working on the palaeontological data analysis through time. Many of these about the ideas about real perception of the evolution using diversity metrics have never been tested from the plant fossil record into a comparative approach from a global viewpoint. On the other hand, despite that in the past 10 years crucial advances have been carried out in the field of the inference from the palaeobotanical data using compiled datasets, in general lines many of these works were focused on concrete geologic moments or restricted to particular palaeogeopgraphycal regions (Lupia et al., 1999; Lupia, 2004; Wilf and Johnson, 2004; Cleal, 2007, 2008).
In order to embrace modern methodologies on the plant record into a global perception, this paper has two specific aims: to test the role of singleton taxa and the length of the time units employed as a source of "distortion" (variability) in the pattern on plant diversification, and secondly, to re-evaluate the evolutionary patterns of vascular plants analysed in previous works using more recent methodologies to check the robustness of the palaeobotanical data.
MATERIAL AND METHODS
Palaeobotanical Data and Temporal Setting
Traditionally, in palaeobiology, the major contribution to understanding of diversity metrics through time have been consolidated from the palaeontological data analysis based on the animal record. Thus, for example, the Sepkoski's compendium about the marine invertebrates (Sepkoski, 1982, 1992) have been used as a methodological case study (Adrain and Westrop, 2000; Ausich and Peters, 2005; Ros and De Renzi, 2005) or from a classic viewpoint, as a data source (Flessa and Jablonski, 1985; Sepkoski, 1989; Gilinsky, 1994), for testing methodological procedures and biases or extracting information about the life extinction patterns through the study of evolutionary rates, respectively. These compendiums are currently in use (Nee, 2006; Markov, 2009). In contrast, in this approach we will show a methodological study from the plant viewpoint.
In order to test the role of the singleton taxa and the length of the intervals on our perception of the palaeophytodiversity, following the methodological principles present into the first general palaeobiological works based on large data compilations (Newell, 1952; Simpson, 1953; Müller, 1961; Schindewolf, 1962; Valentine, 1969), and more recently, the general ideas about the use of computerized palaeontogical data to test methodological aspect in the inference from the fossil record (Alroy et al., 2001; Alroy, 2003; Fara, 2004; Olszewski, 2004; Ros and De Renzi, 2005; Finnegan et al., 2008; Heim, 2008; Melott, 2008; Wall et al., 2009), a set of palaeobotanical data have been extracted from the descriptive/taxonomic literature and classic monographic studies. In this particular case, the data were extracted from The Fossil Record 2 (Cleal, 1993a, 1993b; Collinson et al., 1993) following the information recovered by Cleal and Thomas (1999). Nevertheless, computerized databases can still be considered as essential tool for investigating large-scale palaeontological problems, as it was well thought out by Markwick and Lupia (2002), the highly heterogeneous nature of the fossil record data and the dynamism of the taxonomic processes, confers to the any database a marked temporal character. This temporal aspect is due to the palaeontogical datasets are always undergoing continuous revision because, among other considerations, new findings and/or new phylogenetic models modify the stratigraphic information and the hierarchy of the taxonomic systems, respectively. For these reasons, and attending this background, the dataset used herein have been taken uniquely as a methodological case study to test the per-capita rates and inference methods commented below.
Following the taxonomic ideas expressed by Cascales-Miñana et al. (2010) and Cascales-Miñana and Cleal (2012), this study has been performed at the family level. This taxonomic level was chosen since it provided very thorough and consistent information. Using the same line of reasoning, this approach uses 21 time units extracted from Gradstein and Ogg (2004) embracing the complete history of the vascular plants from the Silurian to the present-day, see Table 1 for details. To perform the algorithms explained below, the families were put into a binary matrix placing the taxa in rows and the time units in columns; complete list of family taxa and binary matrix available from supporting on-line information (see Appendix for details).
Data Analysis
Singleton taxa (taxa to appear first and last in the same time unit) were analysed using accumulative abundance analyses (St) according to the expression St = (Ʃi,k Stk / Sc) * 100, where i corresponds to the first interval analysed, Stk corresponds to the number of singletons in time unit k, and Sc is the total of number of singleton taxa in the dataset from the Silurian to the present-day to illustrate the general distribution pattern across the geologic time of this type of taxa in the dataset. Together with this approach, the taxonomic model present in the original sources was firstly studied from an abundance analysis of the higher taxonomic categories of the singleton taxa to evaluate possible simple taxonomic bias. These complementary analyses have contemplated the higher levels of orders and divisions.
The effect of the length of the time units between the duration in millions of years for each time unit and the number of taxa registered in these intervals has been tested using analysis of simple regression under a liner generalized model representing the results with a correlation diagram in agreement with the general statistical procedure presents in the literature (Mitchell-Olds and Shaw, 1987; Payne, 2003; Freund et al., 2006). With this methodology, the originated, extinguished, total and singleton taxa have been independently tested. In order to avoid the subjective component in the interpretation of the results, the regression value has been calculated for each analysis performed. These analyses have been performed using the PAST software (Hammer et al., 2001).
The study of the evolutionary rates and the re-evaluation of the previous evolutionary patterns have been conducted using the methodological principles indicated by Foote (2000a, 2000b). The use of these per-capita rates rates has increased in recent years (Peters, 2006; Kiessling et al., 2007; Fröbisch, 2008; Liow et al., 2008; Sengor et al., 2008; Simpson and Harnik, 2009), and today these algorithms, which do not consider singleton taxa, are reference rates in modern palaeobiology. These type of rates based on boundary crossed taxa, as it was commented by Foote (2000a, 2000b), present a relative insensitivity to the preservation problems and, therefore, they can potentially diminish the biases related to the incompleteness of the record in comparison with the classic diversity measures. To simplify the explanation of the expressions, we have used the same nomenclature presented in Cascales-Miñana et al. (2010). The origination rate (TO) has been calculated according to the following expression TO = ln(Nt / Nr) / Δt, where for a given time unit k, Nt corresponds to the number of taxa present in this time unit which cross its upper limit and have record in the subsequent interval (k + 1), Nt can be calculated for each time unit from the expression Ntk = Tk+1 – Ok+1, where Tk+1 and Ok+1 are the number of total and originated taxa of the subsequent interval, respectively. Nris the number of taxa that cross both the earlier and later boundary of a time unit, also known as range-through taxa; that is, the taxa known before and after the interval (Casanovas-Vilar et al., 2010). Likewise, the extinction rate (TE) has been calculated from the expression TE = ln(N0 / Nr) / Δt, where N0 is the number of taxa originating from the previous time units or also defined as the initial number of plant families. This parameter as in the previous case can be calculated for a time unit k according to the expression N0k = Tk – Ok.Finally, the diversification rate (TD) was obtained from the difference of the origination and extinction rates according to the expression TD = TO - TE.
Finally, in order to evaluate the diversity changes associated with the origination and extinction levels described by the rates of evolution, Van Valen's mean standing diversity (Van Valen, 1984) has been calculated in terms of this parameter according to the expression Nst = (N0 + Nt) / 2. Alternatively, standing diversity can also be calculated with the expression Nst = [(Nr + Ne) + (Nr + Nf)] / 2, where Neare the taxa that cross the lower boundary and become extinct during this time unit, this parameter correspond to the number of extinguished taxa by discounting the singleton taxa, and Nf are the originated taxa that cross the upper boundary, or in other words, the number of originated taxa less the singleton appearances.
RESULTS AND DISCUSSION
The characteristics of the singleton taxa make of them a special case because they may be influenced by influenced by preservational biases rather than evolutionary processes (Fitzgerald and Carlson, 2006). From a temporal perspective, singleton taxa have a very restricted distribution, but this is a subjective aspect depending on the length of the time units employed (Casanovas-Vilar et al., 2010).
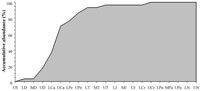
 Foote (2000a, 200b) noted that, this temporal aspect of singleton taxa together with the preservational biases inherent in the fossil record (Foote and Raup, 1996; Foote, 1997), produce many undesirable distortions of diversity trends through Earth's history. The vascular plant fossil record is no exception to this problem. In order to elucidate the role of such taxa in the trends of palaeofloristic diversity, we have used a dataset in which approximately 10% of the sample are singleton taxa. The temporal distribution of these taxa was plotted using an accumulative analysis (Figure 1). The results reveal that around 90% of these taxa appear to be registered before the Palaeozoic-Mesozoic transition. The results also reveal that the maximum increases of singleton taxa were registered between the Middle Devonian and the Pennsylvanian, and between the end of the Carboniferous and the Middle Triassic (Figure 1). Finally, the accumulative analysis shows that all the singleton taxa had been registered in plant life history at the family level by the end of the Cretaceous. In light of these results, a question is raised: are singleton taxa the key element to explain the profound differences in the evolutionary patterns between the Palaeozoic and the Mesozoic?
To answer this question, in the first place, the potential taxonomic biases have been evaluated from abundance analyses. Subsequently, a set of correlation analyses has been performed by focusing on the time-dependent aspects of singleton taxa. This second analysis has been performed considering the large differences among the durations of the time units employed.
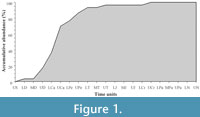
 Originally, a raw comparative approach between the Palaeozoic and Mesozoic taxa was performed to test the taxonomic bias in the cumulative abundance of the singleton taxa. Nevertheless, in agreement with the cumulative analysis, where it is apparent that the majority of singletons are Palaeozoic taxa, preliminary results showed that the important difference in the sample size between the two periods does not allow extract valuate information from the Mesozoic singleton taxa. In contrast, the Palaeozoic data revealed important taxonomic patterns. In our opinion, this fact has important connotations in terms of quality of the record because it could be showing unequal equivalence robustness through time bearing in mind the global scale of the study, but how could we evaluate the quality of the information based on a dataset between the different periods from an objective viewpoint? Wing and DiMichele (1995) postulated an objective form for resolving this question using the information contained in the singleton taxa of their dataset. The reasoning was the following; the number of singletons may be the most robust point of comparison between the two data sets (Wing and DiMichele, 1995). In agreement with this idea, if we separate the global database into three datasets (one of each period), we observe that the robustness decreases towards the Palaeozoic where the maximum number of singleton taxa are registered (Figure 2). It would be in concordance with Raup's ideas about the direct effect of the age of the rocks to interpret the fossil record (Raup, 1972; Raup and Stanley, 1978).
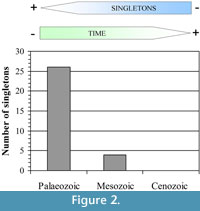
 In short, we think that these unequal quality relationships in the reading of the record through time can be strongly affecting the taxonomy. From Figure 3, where the higher taxonomic categories of the Palaeozoic singleton taxa have been analyzed, we observe that the number of singletons is not homogeneously distributed. There are important biases towards the concrete type of plant fossils, as is the case of the order Lepidocarpales, which contain approximately a quarter part of the Palaeozoic singleton taxa or the order Pinales with a value proximal to the 15% (Figure 3.1). In this sense, for example, from the raw literature most of the singleton families of the order Pinales are based in a unique plant organ, in a unique genera, or present taxonomic unclear relations from the original consulted material (Cleal, 1993b, 1993a; Cleal and Thomas, 1999). Obviously, these aspects are transmitted into the taxonomic hierarchy, and it produces an asymmetric effect in function on what is the considered group (Figure 3.2), emphasizing the need to unify criteria in the use of the singletons when all vascular plant groups are considered together. In summary, rare forms, poor preserved remains, or material accurately undetermined can all be real explanations for more of these singletons.
Regarding changes to the taxonomic hierarchy, we provide an example extracted from the primary literature of angiosperm family that demonstrates, how taxonomic changes influence about the apparition of taxa with first and last appearances in the same interval. As remarked by Crepet et al. (2004), the angiosperm family Priscaceae was placed as a new family taking into account fructifications determined as Prisca reynoldsii by Retallack and Dilcher (1981). Nevertheless, later, Drinnan et al. (1991) tentatively referred Prisca to Lauraceae. In the latter case, the family does would not be a singleton. This scenario is a potential reason why the angiosperms presumably do not have this type of taxa. All these views demonstrate that the singletons can be used to measure the robustness in concordance with the idea expressed by Wing and DiMichele (1995), but that their controversial taxonomy can produce unreal or distorted patterns from the direct reading of the plant record due to their controversial taxonomy.
On the other hand, Foote (2000a, 2000b) emphasized that time intervals can also distort diversity counts significantly if the time units vary greatly in length, which is the case employed herein. Accordingly, the apparent temporal variation in evolutionary rates shown in previous studies might be an artefact of variation in interval lengths. Casanovas-Vilar et al. (2010) recently emphasized the idea that the number of singletons will increase with the duration of the time units, which is logically due to the probability of the first and last appearances of a taxon occurring within a specific time unit being directly proportional to the duration of that time unit. Following this reasoning, the number of evolutionary events in an ideal system should also bear a direct relation with the length of the time interval.
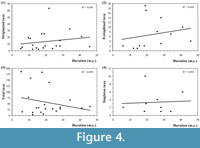 The results of the correlation analysis (summarised in Figure 4) clearly show that there is no relation between the length of the time units and the number of singletons and in the same form, between the duration and the origination, extinctions and diversification events. Consequently, duration do not seem to be a key factor in the configuration of our perception of the phytodiversity trends from a simple regression model viewpoint based on the dataset employed. All the regression values are less than 0.1 (Figure 4), thus confirming this observation. Therefore, in illustrating the main stages of plant life history, the time units employed probably produce only a minor distortion at the suprageneric level.
In the light of these assessments, a re-evaluation of the classic palaeofloristic patterns has been performed. As Foote (2000a, 200b) recommended, this re-evaluation is based on the per-capita evolutionary rates that use taxa, which are boundary-crossers for counts of diversity rather than those that are confined to the time interval alone in diversity analyses to avoid possible problems associated with interval length and the presence of singleton taxa (Figure 5.1).
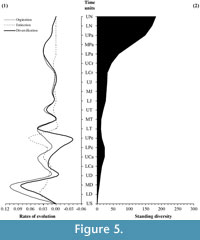 Palaeozoic patterns reveal higher origination levels during the early stages of the Devonian, during the Carboniferous period, and particularly towards the end of the Pennsylvanian. In contrast, the main Palaeozoic extinction levels are observed in the Early Devonian, in the Carboniferous-Permian transition and especially towards the end of the Permian. Consequently, standing diversity levels are not synchronous with the origination levels; e.g., while the Pennsylvanian registers a peak in the origination rate, the diversity curve picks during the Mississippian. In contrast, the origination and diversification rates during the Mesozoic exhibit a highly parallel behaviour with the maximum values during the Early and Late Triassic, together with a slight increase during the Middle Triassic, which strongly augments during the Cretaceous. The Mesozoic extinction levels are basically residuals in comparison to the Palaeozoic extinction levels. The Cenozoic shows a continuous diversification process according to the origination levels during the Early and Middle Palaeogene. Subsequently in the last stages considered, the evolutionary levels are practically inexistent. In the most recent time intervals, origination and extinction rates approach zero.
With respect to the study of the Van Valen's mean standard diversity (Figure 5.2), the standing diversity reveals that a direct relation does not exist between the magnitude of the diversification rate and the standing diversity. Indeed, only the Permian extinction produces a sharp drop in standing diversity. During the Palaeozoic, standing diversity shows a pick at the end of the Carboniferous, and this level of diversity only recovers by the Triassic-Jurassic boundary then increases slightly towards the end of the Mesozoic. From the Late Cretaceous to the Palaeogene-Neogene transition, the mean diversity increases dramatically. Finally, this trend slows through the Neogene.
These results confirm the mean stages, in origination and extinctions terms, previously described by Niklas et al. (1980, 1983, 1985), and more recently evaluated by Cascales-Miñana et al. (2010) and Cascales-Miñana and Cleal (2012), with the peculiarity that the general evolutionary patterns are more smoothed. This study confirms two previous observations: firstly, the rates of evolution employed are not strongly influenced by singleton taxa; and secondly, that practically all such singletons are present during the Palaeozoic. Consequently, this fact allows us to describe plant history with fewer potential distortion elements because singletons do not have the possibility to exaggerate or magnify the differences between the time units.
SUMMARY AND CONCLUSIONS
This paper presents a set of inference methods to test the role of singleton taxa and the length of the time units in the study of plant life by re-evaluating previously derived evolutionary patterns observed in the literature. The analyses reveal that the temporal component of singleton taxa does not distort our understanding of phytodiversification trends at the family level in this global approach. In contrast, the taxonomy and temporal assignation of the singletons seems to be a source of potential biases for providing consistent patterns through global temporal approach. In addition, the length of the time units employed in this approach does not affect the number of singleton taxa registered. Similarly, the results obtained do not allow us to infer a direct relation between the number of evolutionary events (originations or extinctions) and the duration of the time units. Finally, the results based on the evolutionary analysis seem to show that the singleton taxa provide some genuine information at the family level. The decline in singleton taxa agrees with the decline in rates of origination and extinction. At the same time, it seems that the decline in origination and extinction rates is the primary evolutionary signal; the pattern of singletons being just a consequence or symptom of this decline.
The evolutionary patterns derived from these algorithms confirm that the number of the singleton taxa in the original dataset does not strongly change the general observed patterns. Nevertheless, the rates of evolution derived from this analysis yield new global patterns that diminish the effects of the possible taxonomic problems and preservational biases relating to the nature of singleton taxa, and they reveal the main palaeophytodiversity patterns with slight yet abrupt changes. These facts provide us more realistic patterns regarding the intensities of evolutionary events emphasizing that the role of singleton taxa should be evaluated if robust conclusions want to be extracted from the plant fossil record. Future researches will be necessary for elucidating if these observations are extrapolated to concrete plant groups.
ACKNOWLEDGMENTS
We are grateful to M. Foote (Department of the Geophysical Sciences, University of Chicago) for his helpful comments and the critical reading of the manuscript. Special thanks are also due to S. McLoughlin (Department of Palaeobotany, Swedish Museum of Natural History), who very kindly reviewed the manuscript and helped us in its final elaboration with their corrections and suggestions. This work has been partially supported by the FPU Research Fellowship from the Spanish Ministry of Education and Science.
REFERENCES
Adrain, J.M. and Westrop, S.R. 2000. An empirical assessment of taxic paleobiology. Science, 289:110-112.
Alroy, J. 2003. Global databases will yield reliable measures of global biodiversity. Paleobiology, 29:26-29.
Alroy, J., Marshall, C.R., Bambach, R.K., Bezusko, K., Foote, M., Fursich, F.T., Hansen, T.A., Holland, S.M., Ivany, L.C., Jablonski, D., Jacobs, D.K., Jones, D.C., Kosnik, M.A., Lidgard, S., Low, S., Miller, A.I., Novack-Gottshall, P.M., Olszewski, T.D., Patzkowsky, M.E., Raup, D.M., Roy, K., Sepkoski, J.J., Jr., Sommers, M.G., Wagner, P.J., and Webber, A. 2001. Effects of sampling standardization on estimates of Phanerozoic marine diversification. Proceedings of the National Academy of Sciences of the United States of America, 98:6261-6266.
Ausich, W.I. and Peters, S.E. 2005. A revised macroevolutionary history for Ordovician-Early Silurian crinoids. Paleobiology, 31:538-551.
Benton, M.J. 1995. Diversification and extinction in the history of life. Science, 268:52-58.
Benton, M.J. 1997. Models for the diversification of life. Trends in Ecology and Evolution, 12:490-495.
Benton, M.J. and Hitchin, R. 1996. Testing the quality of the fossil record by groups and by major habitats. Historical Biology, 12:111-157.
Benton, M.J. and Hitchin, R. 1997. Congruence between phylogenetic and stratigraphic data on the history of life. Proceedings of the Royal Society B-Biological Sciences, 264:885-890.
Benton, M.J., Wills, M.A., and Hitchin, R. 2000. Quality of the fossil record through time. Nature, 403:534-537.
Casanovas-Vilar, I., García-Paredes, I., Alba, D.M., van den Hoek, L.W., and Moyà-Solà, S. 2010. The European Far West: Miocene mammal isolation, diversity and turnover in the Iberian Peninsula. Journal of Biogeography, 37:1079-1093.
Cascales-Miñana, B. and Cleal, C.J. 2012. Plant fossil record and survival analyses. Lethaia, 45:71–82.
Cascales-Miñana, B., Muñoz-Bertomeu, J., Ros, R., and Segura, J. 2010. Trends and patterns in the evolution of vascular plants: macroevolutionary implications of a multilevel taxonomic analysis. Lethaia, 43:545-557.
Cleal, C.J. 1993a. Plants. 44. Gymnospermophyta, p. 795-808. In Benton, M.J. (ed.), The Fossil Record 2. Chapman and Hall, London.
Cleal, C.J. 1993b. Plants. 43. Pteridophyta, p. 779-794. In Benton, M.J. (ed.), The Fossil Record 2. Chapman and Hall, London.
Cleal, C.J. 2007. The Westphalian-Stephanian macrofloral record from the South Wales Coalfield, UK. Geological Magazine, 144:465-486.
Cleal, C.J. 2008. Palaeofloristics of Middle Pennsylvanian lyginopteridaleans in Variscan Euramerica. Palaeogeography Palaeoclimatology Palaeoecology, 261:1-14.
Cleal, C.J. and Thomas, B.A. 1999. Plant Fossils: The History of Land Vegetation. The Boydell Press, Woodbridge.
Collinson, M.E., Boulter, M.C., and Holmes, P.L. 1993. Plants. 45. Magnoliophyta (´Angiospermae´), p. 795-808. In Benton, M.J. (ed.), The Fossil Record 2. Chapman and Hall, London.
Crepet, W.L., Nixon, K.C., and Gandolfo, M.A. 2004. Fossil evidence and phylogeny: The age of major angiosperm clades based on mesofossil and macrofossil evidence from Cretaceous deposits. American Journal of Botany, 91:1666-1682.
Drinnan, A.N., Crane, D.J., Friis, E.M., and Pedersen, K.J. 1991. Lauraceous flowers from the Potomac Group (mid-Cretaceous) of eastern North America. Botanical Gazette, 151:370-384.
Fara, E. 2004. Estimating minimum global species diversity for groups with a poor fossil record: a case study of Late Jurassic-Eocene lissamphibians. Palaeogeography Palaeoclimatology Palaeoecology, 207:59-82.
Finnegan, S., Payne, J.L., and Wang, S.C. 2008. The Red Queen revisited: reevaluating the age selectivity of Phanerozoic marine genus extinctions. Paleobiology, 34:318-341.
Fitzgerald, P.C. and Carlson, S.J. 2006. Examining the latitudinal diversity gradient in Paleozoic terebratulide brachiopods: should singleton data be removed? Paleobiology, 32:367-386.
Flessa, K.W. and Jablonski, D. 1985. Declining Phanerozoic background extinction rates: effect of taxonomic structure? Nature, 313:216-218.
Foote, M. 1997. Estimating taxonomic durations and preservation probability. Paleobiology, 23:278-300.
Foote, M. 2000a. Origination and extinction components of taxonomic diversity: general problems. Paleobiology, 26:74-102.
Foote, M. 2000b. Origination and extinction components of taxonomic diversity: Paleozoic and post-Paleozoic dynamics. Paleobiology, 26:578-605.
Foote, M. 2003. Origination and extinction through the Phanerozoic: A new approach. Journal of Geology, 111:125-148.
Foote, M. 2005. Pulsed origination and extinction in the marine realm. Paleobiology, 31:6-20.
Foote, M. 2007. Extinction and quiescence in marine animal genera. Paleobiology, 33:261-272.
Foote, M. and Raup, D.M. 1996. Fossil preservation and the stratigraphic ranges of taxa. Paleobiology, 22:121-140.
Freund, R.J., Willson, W.J., and Sa, P. 2006. Regression Analysis: Statistical Modeling of a Response Variable. Elsevier, London.
Fröbisch, J. 2008. Global Taxonomic Diversity of Anomodonts (Tetrapoda, Therapsida) and the Terrestrial Rock Record Across the Permian-Triassic Boundary. PLoS ONE, 3(11):e3733.
Gilinsky, N.L. 1994. Volatility and the phanerozoic decline of background extinction intensity. Paleobiology, 20:445-458.
Gradstein, F.M. and Ogg, J.G. 2004. Geologic time scale 2004 - Why, how, and where next! Lethaia, 37:175-181.
Hammer, O., Harper, D.A.T., and Ryan, P.D. 2001. Past: Paleontological Statistics Software Package for Education and Data Analysis. Palaeontologia Electronica, Vol. 4, Issue 1; art. 4: 9p, 178 Kb;
palaeo-electronica.org/2001_1/past/issue1_01.htm.
Heim, N.A. 2008. A null biogeographic model for quantifying the role of migration in shaping patterns of global taxonomic richness and differentiation diversity, with implications for Ordovician biogeography. Paleobiology, 34:195-209.
Kiessling, W., Aberhan, M., Brenneis, B., and Wagner, P.J. 2007. Extinction trajectories of benthic organisms across the Triassic-Jurassic boundary. Palaeogeography Palaeoclimatology Palaeoecology, 244:201-222.
Liow, L.H., Fortelius, M., Bingham, E., Lintulaakso, K., Mannila, H., Flynn, L., and Stenseth, N.C. 2008. Higher origination and extinction rates in larger mammals. Proceedings of the National Academy of Sciences of the United States of America, 105:6097-6102.
Lupia, R. 2004. Megaspores and palynomorphs from the lower Potomac Group of Maryland, USA. International Journal of Plant Sciences, 165:651-670.
Lupia, R., Lidgard, S., and Crane, P.R. 1999. Comparing palynological abundance and diversity: implications for biotic replacement during the Cretaceous angiosperm radiation. Paleobiology, 25:305-340.
Markov, A.V. 2009. Alpha diversity of Phanerozoic marine communities positively correlates with longevity of genera. Paleobiology, 35:231-250.
Markwick, P.J. and Lupia, R. 2002. Palaeontological databases for palaeobiogeography, palaeoecology and biodiversity: a question of scale. Palaeobiogeography and Biodiversity Change: The Ordovician and Mesozoic-Cenozoic Radiations, 194:169-178.
Melott, A.L. 2008. Long-term cycles in the history of life: periodic biodiversity in the paleobiology database. PLoS ONE, 3:e4044, 4041-4045.
Mitchell-Olds, T. and Shaw, R.G. 1987. Regression analysis of natural selection: statistical inference and biological interpretation. Evolution, 41:1149-1161.
Müller, A.H. 1961. Großabläufe der Stammesgeschichte. Gustav Fischer, Jena.
Nee, S. 2006. Birth-death models in macroevolution. Annual Review of Ecology, Evolution and Systematics, 37:1-17.
Newell, N.D. 1952. Periodicity in invertebrate evolution. Journal of Paleontology, 26:371-385.
Niklas, K.J. 1982. Computer-simulations of early land plant branching morphologies: canalization of patterns during evolution. Paleobiology, 8:196-210.
Niklas, K.J. 1997. The Evolutionary Biology of Plants. The University of Chicago Press, Chicago.
Niklas, K.J. 2000. The evolution of plant body plans - A biomechanical perspective. Annals of Botany, 85:411-438.
Niklas, K.J., Tiffney, B.H., and Knoll, A.H. 1980. Apparent changes in the diversity of fossil plants. Evolutionary Biology, 12:1-89.
Niklas, K.J., Tiffney, B.H., and Knoll, A.H. 1983. Patterns in vascular land plant diversification. Nature, 303:614-616.
Niklas, K.J., Tiffney, B.H., and Knoll, A.H. 1985. Patterns in vascular land plant diversification: an analysis at the specie level, p. 97-128. In Valentine, J.W. (ed.), Phanerozoic diversity patterns: profiles in macroevolution. Princeton University Press, New Jersey.
Olszewski, T.D. 2004. A unified mathematical framework for the measurement of richness and evenness within and among multiple communities. Oikos, 104:377-387.
Payne, J.L. 2003. Applicability and resolving power of statistical tests for simultaneous extinction events in the fossil record. Paleobiology, 29:37-51.
Peters, S.E. 2006. Genus extinction, origination, and the durations of sedimentary hiatuses. Paleobiology, 32:387-407.
Peters, S.E. and Foote, M. 2001. Biodiversity in the Phanerozoic: a reinterpretation. Paleobiology, 27:583-601.
Peters, S.E. and Foote, M. 2002. Determinants of extinction in the fossil record. Nature, 416:420-424.
Raup, D.M. 1972. Taxonomic diversity during the Phanerozoic. Science, 117:1065-1071.
Raup, D.M. 1976. Species diversity in the Phanerozoic: an interpretation. Paleobiology, 2:289-297.
Raup, D.M. and Stanley, S.M. 1978. Principles of Paleontology. W.H. Freeman and Company, San Francisco.
Retallack, G. and Dilcher, D.L. 1981. Early angiosperm reproduction: Prisca reynoldsii, gen. et sp. nov. from the mid-Cretaceous coastal deposits in Kansas, USA. Palaeontographica Abteilung B, 179:103-107.
Ros, S. and De Renzi, M. 2005. Preservation biases, rates of evolution and coherence of databases: Bivalvia as a study case. Ameghiniana, 42:549-558.
Schindewolf, O.H. 1962. Neokatastrophismus? Zeitschrift der deutschen geologischen Gesellschaft, 114:430-445.
Sengor, A.M.C., Atayman, S., and Ozeren, S. 2008. A scale of greatness and causal classification of mass extinctions: Implications for mechanisms. Proceedings of the National Academy of Sciences of the United States of America, 105:13736-13740.
Sepkoski, J.J., Jr. 1982. A compendium of fossil marine families. Milwaukee Public Museum Contributions in Biology and Geology, 51:1-125.
Sepkoski, J.J., Jr. 1989. Periodicity in extinction and the problem of catastrophism in the history of life. Journal of Geological Society of London, 146:7-19.
Sepkoski, J.J., Jr. 1992. A compendium of fossil marine families. Second edition. Milwaukee Public Museum Contributions in Biology and Geology, 83:1-156.
Simpson, C. and Harnik, P.G. 2009. Assessing the role of abundance in marine bivalve extinction over the post-Paleozoic. Paleobiology, 35:631-647.
Simpson, G.G. 1953. The Major Features of Evolution. Columbia University Press, New York.
Uhen, M.D. and Pyenson, N.D. 2007. Diversity estimates, biases, and historiographic effects: Resolving cetacean diversity in the tertiary. Palaeontologia Electronica, 10.
Valentine, J.W. 1969. Patterns of taxonomic ecologic structure of the shelf benthos during Phanerozoic time. Palaeontology, 12:684-709.
Van Valen, L. 1984. A resseting of Phanerozoic community evolution. Nature, 307:50-52.
Wall, P.D., Ivany, L.C., and Wilkinson, B.H. 2009. Revisiting Raup: exploring the influence of outcrop area on diversity in light of modern sample-standardization techniques. Paleobiology, 35:146-167.
Wilf, P. and Johnson, K.R. 2004. Land plant extinction at the end of the Cretaceous: a quantitative analysis of the North Dakota megafloral record. Paleobiology, 30:347-368.
Wing, S.L. and DiMichele, W.A. 1995. Conflict between local and global changes in plant diversity through geological time. Palaios, 10:551-564.
