

 A novel distance that reduces information loss in continuous characters with few observations
Article number: 26.2.a26
https://doi.org/10.26879/1250
Copyright Paleontological Society, July 2023
Author biographies
Plain-language and multi-lingual abstracts
PDF version
Submission: 31 October 2022. Acceptance: 29 June 2023.
ABSTRACT
The calculation of pairwise distances is a fundamental step in many statistical analyses in biology and paleontology. The most commonly used distances work with a single observation per object and character, but there are scenarios where multiple observations are available per object. In these situations, the information for the character spans an interval, and pairs of objects can have overlapping intervals, which further complicates the distance calculation. Some coefficients can deal with this wealth of information but are either too coarse to provide detailed results or too computationally demanding for even moderately large data sets. Here, we present the Distance Between Intervals (DBI) as a novel semi-metric distance that can accommodate both singular and multiple observations per object by analyzing them as intervals. The DBI ranges from 0 to 1 when there is an overlap between the objects and from 1 to infinity when there is no overlap between them. It is easy to calculate and can be applied to a wide variety of data types. Both simulated and empirical test cases show that the DBI correctly ranks pairs of objects by their level of overlap and non-overlap, while other distances struggle to do it. Therefore, the DBI can provide a finer level of definition than other available distances for empirical data sets, while generally agreeing with the broad results they provide. An implementation of DBI is provided for the R programming language.
Gerardo A. Lo Valvo. Centro de Investigaciones en Ciencias de la Tierra (CICTERRA), CONICET-UNC, Córdoba, Argentina. glovalvo@mi.unc.edu.ar
Oscar E. R. Lehmann. Sección Paleontología de Vertebrados, Consejo Nacional de Investigaciones Científicas y Técnicas-Museo Argentino de Ciencias Naturales “Bernardino Rivadavia”, C1405DJR, Buenos Aires, Argentina. lehmanncxii@gmail.com
Diego Balseiro. Centro de Investigaciones en Ciencias de la Tierra (CICTERRA), CONICET-UNC, Córdoba, Argentina. dbalseiro@unc.edu.ar
Keywords: distance coefficient; distance matrix; continuous characters; intervals; overlap
Final citation: Lo Valvo, Gerardo A., Lehmann, Oscar E.R., and Balseiro, Diego. 2023. A novel distance that reduces information loss in continuous characters with few observations. Palaeontologia Electronica, 26(2):a26.
https://doi.org/10.26879/1250
palaeo-electronica.org/content/2023/3889-novel-distance-for-intervals
Copyright: July 2023 Paleontological Society.
This is an open access article distributed under the terms of Attribution-NonCommercial-ShareAlike 4.0 International (CC BY-NC-SA 4.0), which permits users to copy and redistribute the material in any medium or format, provided it is not used for commercial purposes and the original author and source are credited, with indications if any changes are made.
creativecommons.org/licenses/by-nc-sa/4.0/
INTRODUCTION
Finding the difference between two or more objects is the basis for a wide array of analyses in biological sciences. These analyses can use a variety of distance measures that usually work with objects that have a single observation for any given character. When an object comprises multiple observations, the use of some measure of central tendency (e.g., the mean) is a common practice to summarize the available information into a single value (e.g., Scott and Anderson, 2023). This enables the use of common distances (e.g., the Euclidean or the Manhattan distance) but also could lead to the loss of valuable information about the variability of the data.
Another technique to address the issue of objects with multiple observations is the use of overlap indices. In this context “overlap” is defined as the intersection between the empirical probability density functions of the compared objects. Overlap indices have been used in economics, clinical sciences, and other fields since the introduction of the concept (see Pastore and Calcagnì, 2019), and multiple indices have been introduced ever since. Many of them require some distributional assumptions to operate properly (e.g., symmetry of the distributions, unimodality, belonging to the same parametric family, etc.) (Cohen, 1988; McGraw and Wong, 1992; Huberty and Lowman, 2000). Recently, some non-parametric methods have been developed using the estimated probability density functions (PDFs) obtained via kernel density estimators (Pastore and Calcagnì, 2019) or employing the maximum likelihood estimation of the parameters for parametric distributions (Amrhein and Fuchs, 2021). These overlap indices can take values between 0 and 1, with 0 indicating non-overlapped distributions, and 1 indicating identical distributions as they are similitude coefficients. Some overlap indices consider asymptotic distributions, which implies that they will never be completely different because there will always be a minimum probability of overlap between the distributions’ tails, making 0 impossible in practice.
These methods are commonly used to compare two or more objects having numerous observations. But working with a large set of observations might be the exception in some research areas such as paleontology, where sometimes only a couple of observations are available per object. When the sample size is too small or the available information is scarce only the range of observed values is commonly informed. But such data cannot fit any distribution and no parameter nor PDF can be estimated reliably. Moreover, it is common for numerous objects to be analyzed simultaneously (Cohen, 2012; Ferrer et al., 2014), which may result problematic as one of the latest functions that calculate overlap indices (Pastore, 2018; Pastore and Calcagnì, 2019; Pastore et al., 2022) has a great computational cost for each additional object being compared. This makes these methods impractical even for moderately large data sets with the functions provided in the Overlapping R package (Pastore, 2018; Pastore et al., 2022).
A compromise solution for these problems, which has been used previously by different authors (e.g., Bapst et al., 2012), simply evaluates whether intervals overlap or not and codes it as a discrete binary distance. If the intervals overlap, they are considered equal (distance of 0), while non-overlapping intervals are considered different (distance of 1). This approach provides a solution when data is scarce, a common occurrence in paleontology, and incorporates the non-overlap scenario. Nevertheless, it does not provide any granularity to capture how similar are two overlapping intervals or how different are two non-overlapping ones. We call this approach the Binary Overlap Distance (BOD).
Here we present the Distance Between Intervals (DBI), a novel distance that provides a continuous measurement of the distance between objects. It can be calculated with minimal information and has the property of treating the interval’s boundaries as the absolute end of the distribution, omitting any theoretical asymptotic tails. The DBI captures the paired relationship between groups of observations, reflecting how far apart or how overlapped their intervals are in the character’s space.
DISTANCE BETWEEN INTERVALS
Objectives
The DBI was created to quantify the distance between pairs of objects in a scenario where the only information available for multiple taxa is the minimum and maximum observed values of their characters. This scenario can be particularly frequent in systematic reviews in which the collection of vast amounts of data is undertaken and bibliographic sources, especially older ones, tend to simplify the data reported.
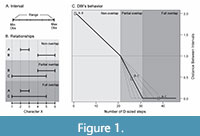 As a result of this context, the DBI is designed to operate with intervals made from two values that bound the character space occupied by the observations of the object (Figure 1A). These values can be the observed minimum and maximum, the position of the first and third quartiles, or other similar estimators that represent a lower and upper limit to the interval. The DBI can also work in cases where only one observation is available per object by using that single value as the lower and upper limits.
Here, we present the DBI algorithm for a given matrix with n taxa and one character coded as an interval. The algorithm returns a distance matrix for that character that can then be used as it is, combined with others produced in a similar way, or further processed. Thus, for example, the distances calculated with DBI can later be evaluated along with other types of characters as a multi-trait extension of the Gower or MORD distances (Pavoine et al., 2009; Lloyd, 2016) or any other multi-trait distance.
The DBI was developed to satisfy the following conditions: 1) it should be 0 if two intervals are equal or if one is completely embedded in the other; 2) it should be less than 1 when there is partial overlap between the intervals, and greater than 1 when there is no overlap; 3) it should increase as the overlapped proportion between two intervals decreases; 4) it should increase as the gap between non-overlapping intervals increases; and 5) it should be able to deal both with intervals and single observations.
Algorithm
Given the intervals of any two objects i and j , the DBI can be expressed as:
DBIij = 1 + min ( Dij ) – Pij
Where min( Dij ) is the minimum Euclidean distance between the intervals i and j , and Pij is the proportion of overlap of the interval with the smallest range (the range is the difference between its maximum and minimum value, see Figure 1A).
When there is no overlap (Figure 1B) Pij will be equal to 0 and min( Dij ) will be greater than 0, resulting in the DBIij taking values greater than 1. When there is overlap (Figure 1B) the situation inverts and Pij will be greater than 0 and min( Dij ) will be equal to 0, which results in the DBIij taking values greater than 0 and lesser than 1 for partially overlapped intervals and equal to 0 for fully overlapped intervals when Pij is equal to 1.
In the special case of two intervals that contact each other at a single point, e.g., [1, 4] and [4, 5], both min( D ij ) and Pij are equal to 0 leading to a DBIij equal to 1.
An implementation of the DBI calculation in R (R Core Team, 2022) is provided as Supplemental Material (DBIfunction.R) with a readme.txt file, and it is available free to access and download (see DATA AVAILABILITY STATEMENT section below). This implementation requires a data set provided as an object of class dataframe that has two columns per character, with the first one containing the lower and the second the upper limit of the interval. Further information about its implementation is available in the function’s help (presented with the help of the docstring package for R, Kurkiewicz, 2017).
Properties
The distance described here is semi-metric. This means that it satisfies the first three axioms necessary to establish a metric (non-negativity, identity of the indiscernibles, and symmetry), but it fails to satisfy the fourth axiom: the axiom of the triangle inequality.
The axiom of non-negativity can be easily proven as per the function’s definition its image is [0, +∞) when all of its parts are considered. The axiom of identity of the indiscernible states that the distance between an interval and itself is 0. It can be proven by considering that this scenario is a particular case of overlapping intervals. The proportion of overlap is 1 and the Euclidean distance between the intervals is 0, yielding a distance of 0. The axiom of symmetry states the distance between two intervals is the same regardless of the order in which they are provided to the distance function. This axiom is satisfied as the distance function performs the calculations by taking into account which interval of the pair being compared has the largest values or the smallest range.
Finally, the axiom of the triangle inequality states that D(a, c) ≤ D(a, b) + D(b, c). This means that the distance between two points must be smaller than or equal to the sum of the distances between each of those two points to a third one. This reflects the fact that in Euclidean space the sum of two sides of a triangle must be equal to or larger than the third side. This axiom is especially important when the results of the distance calculation are inputs for a dimensionality reduction technique that generates a Euclidean space representation, such as principal coordinates analysis.
The distance presented here does not satisfy the axiom of triangle inequality in all cases. Proof by counterexample can be found in the previous example where we considered an interval A = [2, 3], an interval B = [4, 6], and an interval C = [1, 5] (Figure 1B). The distance between A-B is 2, while the distances between A-C, and B-C are 0 and 0.5, respectively. If we replace these values in the triangle inequality we obtain 2 ≤ 0.5, thus proving that this axiom is not satisfied in all cases.
DBI’s Behavior
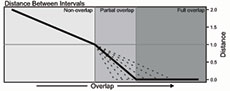
The distances obtained by the use of the DBI can be grouped by their value into three categories, reflecting the three different relative positions that two intervals can have: 1) from infinity to 1 for non-overlapped intervals (Figure 1C, Left section); 2) from 1 to 0 for partially overlapped intervals (Figure 1C, Central section); 3) and 0 for fully overlapped intervals (Figure 1C, Right section). Changes in the relative size of ranges (i.e., the interval size) will affect how quickly the distance will decrease from 1 to 0 when the overlapped proportion increases (Figure 1C, dashed lines). In the single observation scenario, the possible relationships between intervals are reduced to full overlap or non-overlap, so the obtained distance would be equal to 0 or greater than 1, respectively.
COMPARATIVE PERFORMANCE
Simulated Example
The performance of the DBI, the BOD (Bapst et al., 2012), and the Overlap Index (OV) (Pastore and Calcagnì, 2019) can be compared using the previous example (Table 1), in which objects A, B, and C are scored as [2, 3], [4, 6], and [1, 5], respectively, for character X. The three possible relationships between two intervals can be recognized in this example: A-B do not overlap, B-C overlap partially, and A-C overlap completely (Figure 1B). We can also include D as a single-observation object with a value of 4. This type of object should also be scored as an interval, in this case D = [4, 4], as its only value is considered as both its lower and upper limit. The R code for this example is available as Appendix 1.
As mentioned above, OV estimates an empirical distribution function (EDF) for each object based on its observations and calculates the overlapped area. For this estimation, the intervals here presented are considered as just a sample with two values leading to EDFs with bimodal distributions, with a peak at each limit of the interval, or even a normal distribution for the single-observation case. For fully overlapped intervals (A-C, B-D, and C-D), both the BOD and the DBI return distances equal to 0, while OV yields very different results (e.g., OV(A-C) = 0.55 and OV(B-D) = 0.12). Moreover, the BOD does not differentiate between partially and completely overlapped intervals, as it results in a distance of 0 for B-C, A-C, B-D, and C-D. The DBI has the potential to capture a more nuanced relationship between those intervals. In these cases, the DBI yields a distance of 0 for the completely overlapped intervals (e.g., A-C) and a larger distance of 0.5 for the partially overlapped intervals (e.g., B-C), which better agrees with the intuitive expectation.
For non-overlapped intervals, the BOD gives a distance of 1, which is the maximum distance possible computable for this method. Thus, the BOD is not capable of differentiating if non-overlapped intervals are very close or distant from one another. In the case of the OV, the estimated distributions’ tails lead to the overlap of the EDFs giving distances smaller than 1, even when the empirical data do not overlap in the character’s space. Instead, the DBI increases as the gap between intervals grows, capturing how different two non-overlapped intervals are.
Finally, the distances provided by OV in these situations can be counterintuitive to some extent. Pairs of partially overlapped intervals can lead to bigger distances than non-overlapped ones, as is the case with B-C (partially overlapped, OV = 0.37) and A-D (non-overlapped, OV = 0.28). Moreover, there is the case of fully overlapped intervals with a distance even bigger than the mentioned ones, such as A-C (OV = 0.55). On the other hand, the DBI not only gives granularity to the fully and partially overlapped and non-overlapped scenarios, but it also computes the distances with a logical order, increasing from fully overlapped to non-overlapped intervals.
Empirical Example
The performance of the DBI versus the BOD was also compared using empirical data. The OV was not included in the comparison as it is computationally unsuitable for a large data set and, as it was shown in the previous example, the results do not capture the true relationship between intervals within the data structure. The data set used was obtained from Bapst et al. (2012) and records morphological information of planktonic graptoloids spanning the Late Ordovician mass extinction interval. The analysis was limited to the four characters coded as intervals in their data set, and to the 180 taxa coded for at least one of these characters. The data set is available as Appendix 2. Using the BOD and the DBI, the paired distance for each of the four characters was calculated separately obtaining eight distance matrices. Then the four distance matrices obtained using each method were summed and rescaled by a factor calculated with the sum of the maximum observed distance of each character compared between those two taxa following Lloyd’s (2016) criteria for MORD. This rescalation reduces the impact of missing data, but any other multi-trait distance could have been applied. Two empirical morphospaces were then produced using a principal coordinates analysis (Gower, 1966; Legendre and Legendre, 2012) on each of the distance matrices using the pcoa function from the ape package for R (Paradis et al., 2004). The temporal trends in morphological diversity were analyzed for both morphospaces using the mean of the raw pairwise distances, a pre-ordination metric used by Bapst et al. (2012) and the sum of variances and the sum of ranges from the ordinated space, which are two of the most commonly used post-ordination disparity metrics (Foote, 1993). Time series were normalized (i.e., they were centered to their mean and scaled to unity) in all cases for ease of graphical comparison. These analyses and comparisons can be replicated with an R script provided as supplementary material along with the necessary CSV files (Appendix 2, Appendix 3, Appendix 4).
 For this data set, trends in disparity using the DBI and the BOD distances do not differ substantially and are not significantly different based on bootstrapped confidence intervals (CIs are not shown in Figure 2A for the sake of clarity). Nevertheless, some small differences can be observed in the post-ordination disparity metrics. The DBI exhibits greater variation among steps for the sum of variances (Figure 2A1), which would suggest a larger impact of the end Ordovician extinction. Moreover, contrary to the BOD, the DBI indicates that after a Katian maximum, disparity did not fully recover during the post-extinction radiation (Figure 2A1). For the sum of ranges, the DBI also indicates a larger impact of the extinction event compared to the BOD while also suggesting a smaller occupation of the morphospace during the Aeronian (Figure 2A2). Finally, both curves record almost identical patterns in the trends of mean pairwise distance (Figure 2A3). The results for this specific data set do not show an outstanding performance of the DBI over the BOD. Nevertheless, the potential effect of choosing the DBI over the BOD is shown in Figure 2B. Even when there is a positive correlation between distances, for the different values obtained using the BOD, the DBI has a wide range of distances due to its granularity. Furthermore, for a small range of DBI (between 0.26 and 0.32) the BOD distances span from 0 to 1. These contrasting results are caused by the DBI capability of capturing the small difference between intervals with a slight overlap from those very close to each other but without overlap. It is also worth mentioning that when using distances rescaled by the maximum observed distance, the BOD can reach the maximum rescaled distance (i.e., 1) more easily, therefore more frequently, while for the DBI the probability of reaching exactly the maximum difference between two intervals will be considerably lower. For example, in our case study, the rescaled BOD distances range from 0 to 1, while the DBI rescaled distances span from 0 to 0.8 (Figure 2B). This feature could be relevant when working with multiple types of characters and the application of some weighting might be desirable for a balanced combination of characters in the total dissimilarity (de Bello et al., 2021).
CONCLUSIONS
Here we presented the Distance Between Intervals, a new distance that can be used in data sets with one or more observations of one character per object along with an implementation that is computationally suitable for both small and large data sets. The DBI is shown to provide a more nuanced approach to scenarios where objects have overlapping ranges for their characters’ values, allowing the use of more information than what a central tendency estimator or a binary choice algorithm could provide. This approach recognizes three different possible relationships between objects regarding the relative positions of their intervals: fully, partially, and non-overlapped, and provides a continuous distance function between them. Previous proposals, such as the BOD, did not provide such a continuous solution. Finally, we showed that the DBI correctly ranks partially and non-overlapped intervals. We put forth the DBI as a useful tool for ecological, morphological, and many other kinds of analyses that rely on the creation of distance matrices, enabling the use of more information when it is available.
DATA AVAILABILITY STATEMENT
Data is available in GitHub (https://github.com/GerALVo/Distance-Between-Intervals-DBI-.git) and in the Digital Repository of the National University of Córdoba (https://rdu.unc.edu.ar/handle/11086/546977).
ACKNOWLEDGMENTS
This research was financially supported by Agencia I+D+i, PICT 2020-5853. We thank the referees for their comments on the manuscript that lead us to important improvements in the presentation of DBI. We thank M. Pastore for his feedback about the usage of its package. G.A.L.V. thanks its colleagues M.M. Demmel, R. Coppo, and E.A. Randolfe for their support and feedback on the manuscript.
REFERENCES
Amrhein, L. and Fuchs, C. 2021. stochprofML: stochastic profiling using maximum likelihood estimation in R. BMC Bioinformatics, 22:123.
https://doi.org/10.1186/s12859-021-03970-7
Bapst, D.W., Bullock, P.C., Melchin, M.J., Sheets, H.D., and Mitchell, C.E. 2012. Graptoloid diversity and disparity became decoupled during the Ordovician mass extinction. Proceedings of the National Academy of Sciences, 109:3428-3433.
https://doi.org/10.1073/pnas.1113870109
Cohen, J.I. 1988. Statistical Power Analysis for the Behavioral Sciences. Routledge, London.
https://doi.org/10.4324/9780203771587
Cohen, J.I. 2012. Continuous characters in phylogenetic analyses: patterns of corolla tube length evolution in Lithospermum L. (Boraginaceae). Biological Journal of the Linnean Society, 107:442-457.
https://doi.org/10.1111/j.1095-8312.2012.01938.x
de Bello, F., Botta-Dukát, Z., Lepš, J., and Fibich, P. 2021. Towards a more balanced combination of multiple traits when computing functional differences between species. Methods in Ecology and Evolution, 12:391-564.
https://doi.org/10.1111/2041-210X.13537
Ferrer, J., Wingert, J.M., and Malabarba, L.R. 2014. Description of a new species and phylogenetic analysis of the subtribe Cynopoecilina, including continuous characters without discretization (Cyprinodontiformes: Rivulidae). Zoological Journal of the Linnean Society, 172:846-866.
https://doi.org/10.1111/zoj.12190
Foote, M. 1993. Contribution of individual taxa to overall morphological disparity. Paleobiology, 19:403-419.
https://doi.org/10.1017/S0094837300014056
Gower, J.C. 1966. Some distance properties of latent root and vector methods used in multivariate analysis. Biometrika, 53:325-338.
https://doi.org/10.1093/biomet/53.3-4.325
Huberty, C.J. and Lowman, L.L. 2000. Group overlap as a basis for effect size. Educational and Psychological Measurements, 60:543-563.
https://doi.org/10.1177/0013164400604004
Kurkiewicz, D. 2017. docstring: Provides Docstring Capabilities to R Functions. R package version 1.0.0. The Comprehensive R Archive Network.
https://CRAN.R-project.org/package=docstring
Legendre, P. and Legendre, L. 2012. Numerical Ecology. Elsevier, Oxford, UK.
Lloyd, G.T. 2016. Estimating morphological diversity and tempo with discrete character-taxon matrices: implementation, challenges, progress, and future directions. Biological Journal of the Linnean Society, 118:131-151.
https://doi.org/10.1111/bij.12746
McGraw, K.O. and Wong, S. 1992. A common language effect size statistic. Psychological Bulletin, 111:361-365.
https://doi.org/10.1037/0033-2909.111.2.361
Paradis, E., Claude, J., and Strimmer, K. 2004. APE: Analyses of phylogenetics and evolution in R language. Bioinformatics, 20:289-290.
https://doi.org/10.1093/bioinformatics/btg412
Pastore, M. 2018. Overlapping: a R package for Estimating Overlapping in Empirical Distributions. The Journal of Open Source Software, 3:1023.
https://doi.org/10.21105/joss.01023
Pastore, M. and Calcagnì, A. 2019. Measuring Distribution Similarities Between Samples: A Distribution-Free Overlapping Index. Frontiers in Psychology, 10:1089.
https://doi.org/10.3389/fpsyg.2019.01089
Pastore, M., Loro, P.A.D., Mingione, M., and Calcagnì, A. 2022. overlapping: Estimation of Overlapping in Empirical Distributions. R package version 2.1. The Comprehensive R Archive Network.
https://CRAN.R-project.org/package=overlapping
Pavoine, S., Vallet, J., Dugour, A.-B., Gachet, S., and Daniel, H. 2009. On the challenge of treating various types of variables: application for improving the measurement of functional diversity. Oikos, 118:391-402.
https://doi.org/10.1111/j.1600-0706.2009.16668.x
R Core Team. 2022. R: A language and environment for statistical computing. R Foundation for Statistical Computing, Vienna, Austria.
https://www.R-project.org/
Scott, B.R. and Anderson, P.S.L. 2023. Examining competition during the agnathan/gnathostome transition using distance-based morphometrics. Paleobiology, 49:313-328.
https://doi.org/10.1017/pab.2022.32
