RESULTS
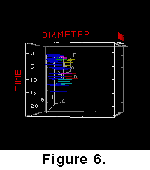 Figure
6 illustrates animated evolutionary models for C. leptoporus from the
early Miocene to Recent at individual sites (note, that the diagrams can be
watched in mono and stereo views; for stereo vision use red-green glasses to
experience the -3D effect in an optimal way). -3D glasses are available from Philip
Kurzenberger GMBH. The animations are combined with the phylogenetic tree (Figure
7), that was derived from the "morphotype classification" approach
in Knappertsbusch
(2000).
Figure
6 illustrates animated evolutionary models for C. leptoporus from the
early Miocene to Recent at individual sites (note, that the diagrams can be
watched in mono and stereo views; for stereo vision use red-green glasses to
experience the -3D effect in an optimal way). -3D glasses are available from Philip
Kurzenberger GMBH. The animations are combined with the phylogenetic tree (Figure
7), that was derived from the "morphotype classification" approach
in Knappertsbusch
(2000). 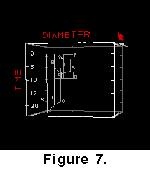 Figure
8 shows composites in mono- and stereo views, where the data from all cores
are included to arrive at a global impression of the morphological evolution of C.
leptoporus.
Figure
8 shows composites in mono- and stereo views, where the data from all cores
are included to arrive at a global impression of the morphological evolution of C.
leptoporus.
These composites demonstrate a cladogenetic event
occurred during the Upper Miocene, during which a prominent branch of large
morphotypes (morphotype D) developed from morphotype C. A second cladogenetic
event occurred during the Upper Miocene to Pliocene leading to the coccoliths of
morphotype A, that stratigraphers call C. macintyrei.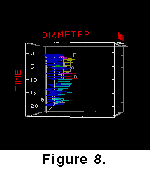 Note, that coccoliths of morphotypes C, D, and A have large areas of overlap in
the bivariate classification scheme of diameters and elements illustrated in Figure
4 and it would not be possible to discriminate between them without
additional information. However, these morphotypes are clearly separated from
each other by time: when looking at the stratigraphic development of diameters
and elements, separation patterns become apparent and morphotype D can easily be
separated from morphotype A because of their different phyletic trends during
different time intervals. These observations were reported in Knappertsbusch
(2000) with the help of two-dimensional contour plots, but clearly, the
animated diagrams presented here are more easily understood than the previously
published flat diagrams.
Note, that coccoliths of morphotypes C, D, and A have large areas of overlap in
the bivariate classification scheme of diameters and elements illustrated in Figure
4 and it would not be possible to discriminate between them without
additional information. However, these morphotypes are clearly separated from
each other by time: when looking at the stratigraphic development of diameters
and elements, separation patterns become apparent and morphotype D can easily be
separated from morphotype A because of their different phyletic trends during
different time intervals. These observations were reported in Knappertsbusch
(2000) with the help of two-dimensional contour plots, but clearly, the
animated diagrams presented here are more easily understood than the previously
published flat diagrams. 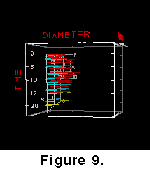 These
patterns possibly indicate true speciation events, and most probably are driven
by paleoenvironmental changes. An environmental influence is indicated when the
measurements from the southern Indian Ocean (DSDP Site 251) are compared with
those from equatorial Indian Ocean DSDP sites 236, 223 and 224 (Figure
9). At the higher latitude site, large coccoliths such as morphotypes A and
D appear more frequently than at the low-latitude end. This trend is confirmed
in samples from the equatorial Pacific (sample DSDP 572A-3-4, 80cm), North
Atlantic (DSDP 366A-3-5, 60cm; V16-205, 779 cm; and ME69-196, 471 cm) and Indian
Ocean (DSDP 251-6-2, 110 cm; and DSDP 236-3-1, 120 cm) at an Early Pleistocene
(1.8-1.6 Ma) time slice.
These
patterns possibly indicate true speciation events, and most probably are driven
by paleoenvironmental changes. An environmental influence is indicated when the
measurements from the southern Indian Ocean (DSDP Site 251) are compared with
those from equatorial Indian Ocean DSDP sites 236, 223 and 224 (Figure
9). At the higher latitude site, large coccoliths such as morphotypes A and
D appear more frequently than at the low-latitude end. This trend is confirmed
in samples from the equatorial Pacific (sample DSDP 572A-3-4, 80cm), North
Atlantic (DSDP 366A-3-5, 60cm; V16-205, 779 cm; and ME69-196, 471 cm) and Indian
Ocean (DSDP 251-6-2, 110 cm; and DSDP 236-3-1, 120 cm) at an Early Pleistocene
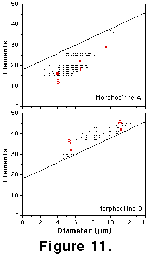
(1.8-1.6 Ma) time slice. 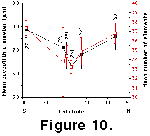 At
this time coccoliths, including the two extinct morphotypes A and B, show
significantly higher mean coccolith diameters and mean numbers of elements at
high latitudes than in equatorial regions (Figure
10 and Figure 11).
At
this time coccoliths, including the two extinct morphotypes A and B, show
significantly higher mean coccolith diameters and mean numbers of elements at
high latitudes than in equatorial regions (Figure
10 and Figure 11).
 Interestingly,
extant representatives of C. leptoporus (morphotypes S, I, L, and F) show
an opposite trend with respect to sea-surface temperatures. Here, large cells
covered by large coccoliths (i.e. morphotypes L and F) appear to prefer waters
with temperatures above the 23ºC isotherm, whereas the smaller morphotypes S
and I are cosmopolitan (Knappertsbusch
et al. 1997). These observations suggest that a strong environmental
component influenced size and coccolith morphology in the evolutionary history
of these algae.
Interestingly,
extant representatives of C. leptoporus (morphotypes S, I, L, and F) show
an opposite trend with respect to sea-surface temperatures. Here, large cells
covered by large coccoliths (i.e. morphotypes L and F) appear to prefer waters
with temperatures above the 23ºC isotherm, whereas the smaller morphotypes S
and I are cosmopolitan (Knappertsbusch
et al. 1997). These observations suggest that a strong environmental
component influenced size and coccolith morphology in the evolutionary history
of these algae.