 4A
4AIt is useful for analysis to reduce these many terms in a meaningful way. In time-series analysis and signal processing, the sum of the squares of the amplitudes of a signal is the signal's power. That is
 4A
4A
 4B
4B
The combined power of a suture pattern is:
P(all) = Power(h) + Power(theta) 4C
 4D
4D
Each of these definitions of Power describes different properties of the suture pattern. Power(h) describes variability in the height of the suture, the vertical distance between the top and bottom of the suture. A high Power(h) indicates that the suture is tall, along the longitudinal direction of the whorl. In the same way, the Power(phi) is a description of variability along the radial direction of the suture pattern. A suture pattern with non-singular points can be expected to have a high Power(phi). Power(all), Power(h) and Power(phi) of a straight suture line are all 0.
 For this study, ontogenetic series of Strenoceras and of
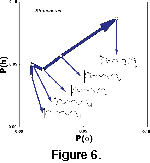
Scaphites were analyzed using this method, and Power(h) and
Power(phi) were plotted for each (Figure
6). The ontogenetic series show that h and phi do not develop synchronously. The amplitudes of the
h-frequencies increase more quickly than those of the phi-frequencies in the early stage of development, but in the middle stage of development this relationship changes. In the last stage of development of
Scaphites, both h and phi increase at an intermediate rate. Only two ontogenetic series are shown, and other ontogenetic series may display significant deviation from the simple pattern illustrated. More data are needed to determine the general applicability of the trend of suture development through ontogeny.
The Fourier description of suture patterns also provides a basis by which suture patterns may be compared. Previous quantitative comparisons of suture patterns have not been based on methods that are capable of reconstructing suture patterns, but have been based on suture statistics. The sutural complexity index (Westermann 1971) has been used in several studies with limited success. Its usefulness is limited because many different suture patterns have the same value. However, the sutural complexity index can be measured can be calculated directly from the Fourier series. The length of the suture line is the line integral of the parametric Fourier series, and the normalization can be accomplished by dividing the length by pi.
 5
5
As a practical matter, it is more efficient to calculate the index of sutural complexity by reconstructing the suture pattern and calculating and summing the distance between calculated points.
 The two Fourier series describe the shape of the suture pattern in detail, as can be demonstrated by recreating the suture pattern
(Figure 4). The series also record the shape in a more general fashion. Suture patterns reconstructed using only the first few frequencies display the same general shape. For
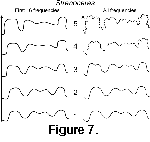
Strenoceras and Scaphites, reconstructions of stages in an ontogenetic series using the first 32 frequencies generate patterns that are similar
(Figure 7) to other members of the same series. The basic pattern of major and minor lobes can be seen in each reconstruction, from the earliest to the mature suture pattern.
The frequencies of both h and phi can be treated as orthogonal axes defining a multidimensional space (the number of dimensions equal twice the number of frequencies). The amplitude of each frequency of a suture pattern describes a point in this space. Another way of thinking of this concept is to consider the suture pattern a vector in the multidimensional space, starting at the origin and ending at the point defined by the amplitudes of each frequency. The magnitude of the vector is the square root of Power(all); the direction is determined by the relative amplitudes of each frequency. Each suture pattern defines a unique point. Visualizing the pattern in this way is a useful way to think about the analysis and comparison of suture patterns. Suture patterns can be compared by analyzing the relationships of points and vectors.
Suture patterns whose points are coincident are the same pattern; they have the same shape. Those whose points are near each other in space have similar shapes. Because the Euclidean distance between the points representing suture patterns is a reflection of their similarity, comparison of these distances is a comparison of suture patterns. This difference can be demonstrated by varying the amplitudes of fossil suture patterns (Scaphites, Figure 4) to generate suture patterns that can then be compared to the original: the greater the difference in power, the greater the difference in shape. The Euclidean distance between points is
 6
6
where C is the distance between the points, and A(i) and B(i) are the amplitudes of the ith frequencies for the two suture patterns.
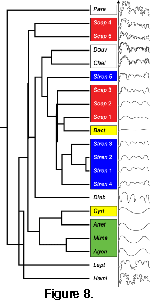
 A dendrogram of nearest neighbors can be created from the distances
(Figure 8). The taxa used in this study are not meant to be exhaustive, but were chosen to capture a range of suture shapes. Five relatively simple nautilitic suture patterns were chosen:
Agoniatites, Anetoceras, Bactrites, Cyrtobactrites, and Mimagoniatites. Seven (or eight if
Scaphites and Strenoceras are counted separately?) more complex suture patterns were chosen:
Chelinoceras, Diabologoceras, Douvilleiceras, Hamites, Leptoceras, Paraspiticeras,
Scaphites, and Strenoceras. The ontogenetic series of Scaphites and
Strenoceras used in the analysis above were included, with each stage of the series treated as a separate suture pattern. Among these taxa,
Agoniatites, Anetoceras, and Mimagoniatites are agoniatitid genera,
Bactrites and Cyrtobactrites are bactritid genera, and Douvilleiceras,
Cheloniceras, and Paraspiticeras are douvilleiceratid genera; other families are represented by single taxa. All genera are currently assigned to the ammonoids (Order Ammonoidea Zittel, 1884).
Euclidean distance between the points representing suture patterns will not necessarily be a very sensitive indicator of similarity between suture shape. As seen earlier, the shape of a suture pattern is conserved if all amplitudes are scaled equally. A greater distance than one might expect from a visual examination separates the points for these similar suture patterns. The general shape of the suture pattern is preserved in the relative amplitudes between frequencies, not in their absolute magnitude. That is, the general shape of the suture pattern is recorded in the orientation of the vector, not its magnitude.
The distance-based dendrogram reflects this insensitivity. Although there is an apparent visual pattern in the tree, the bactritids, douvilleiceratids and ontogentic series are split between different branches, separated by the suture patterns of more distantly related taxa. Only the suture patterns of the agoniatitids are grouped into the same branch of the dendrogram. This moderate success is lessened by the placement of the agoniatitids among the other taxa.
The orientations of the vectors can be more sensitive indicators of the similarity between suture patterns. The orientations can be compared by examining the angle between the vectors representing them. The Cosine Law resolves the angle between two suture patterns (A and B) and origin as:
 7
7
where delta is the angle between the two suture patterns, A and B are the magnitudes of the vectors (equal to the square root of Power(All) for each), and C is the distance between the endpoints of the vectors, and is the same distance that is used to compare suture patterns by Euclidean distance.
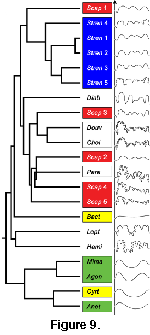
 As with Euclidean distances, a dendrogram of nearest angular neighbors can be created
(Figure 9). The dendrogram based on angles is similar in some ways to the distance-based dendrogram, but in other ways is significantly different. The agoniatitids remain collected into the same branch, and the bactritids, douvilleiceratids and ontogenetic series of
Scaphites remain separated. However, the ontogenetic series of Strenoceras is now grouped together in the same branch. In addition, the agoniatitids are now separated from the other taxa at a much higher level, indicating that the difference in their shape compared to the shape of the other taxa is more significant.
The ontogenetic series of Strenoceras was easily grouped into one cluster using the angular measure, but not using Euclidean distance. Even though the first, youngest suture in the series is very "simple," clustering by angle tightly groups it with the rest of the taxon. The ontogenetic series of Scaphites is not grouped using either Euclidean distance nor angular measures of similarity, although clustering is more complete using the angular measure. In both instances, the douvilleiceratids Douvilleiceras and Chelinoceras are grouped closely, but separated from the other douvilliceratid Paraspiticeras.
In neither case does the nearest-neighbor dendrogram accurately reflect taxonomy. This lack of correlation is not surprising, because it has been shown that determining taxonomic relationships requires examination of both the patterns and their ontogenetic development (House 1980, Wiedmann and Kullman 1980). The effort reinforces common knowledge: that similarity of suture shape alone, without regard to the shapes ontogeny, is not sufficient for unraveling the phylogeny of the ammonoids.