METHODS
The first requirement for standardized surface
sampling is to have a clear research goal in mind, because this affects the type
of data recorded and the deployment of people doing the recording. In the case
of the Siwalik surveys, we were interested in delimiting a number of
biostratigraphic events that were suggested by more traditional survey and
collection methods, i.e., the level of disappearance (LAD) of Sivapithecus,
the decline and extinction of the Tragulidae, the regional appearance datum for
“Hipparion” and a large genus of bovid, and the overall faunal response
to changes in fluvial systems and climate between ~8.0 Ma and 6.0 Ma. Thus, we
designed our sampling strategies to cover sequences of exposures in several
different areas that fell within this time range, with correlations between
areas based on the well-documented Siwalik magnetostratigraphic record (Tauxe
and Opdyke 1982; Johnson et al. 1985;
Barry et al. 2002). We were also
interested in assessing fossil productivity of different stratigraphic levels
throughout the Potwar sequence, as we knew from more traditional collecting that
it was likely to vary considerably and was undoubtedly important in
considerations of biostratigraphy of these intervals. We thus broadened
sampling to include fragmentary fossil debris (“scrap”), even if unidentifiable
except as vertebrate remains.
In addition to providing data relating to our
primary goals, the biostratigraphic surveys also can address questions such as:
1) the effect of different outcrop slopes and lighting (bright sun, overcast,
etc.) on fossil collecting, 2) variation among different individuals in finding
fossils, 3) variation in skeletal parts preserved in different lithofacies and
stratigraphic intervals, 4) ratios of “good” fossils (i.e., identifiable to
major group, etc.) to scrap, 5) variation through time and by facies of aquatic
versus non-aquatic vertebrates, and 6) relative frequency of recovery of small
mammals on walking surface surveys (as opposed to crawling the outcrops). We do
not attempt to treat all of these questions here but point them out as
possibilities for future research.
As erosion proceeds along the Potwar Plateau
strike valleys, resistant lags of carbonate nodules, gravels, and fossil bones
tend to be dispersed widely over the ground surface. Occasionally there are
patches of more abundant fossils weathering out from particular lithofacies, and
these are treated separately as localities (Barry et al. 1980;
Behrensmeyer and
Raza 1984). The biostratigraphic surveys target the scatter of fossils between
the richer patches, although many of the more evenly dispersed remains may
ultimately have been derived from spatially circumscribed concentrations. Relatively few Siwalik fossils are found in situ, and the fragmentary remains
recorded on the surveys represent the net result of original (pre-fossilization) taphonomic processes combined with erosion and fragmentation on the modern
outcrop surfaces. Nevertheless, there is little chance that fossils from higher
or lower levels contaminate the level being sampled, given the continuous strike
ridges that separate these levels (Figure 3). The areas used for the biostratigraphic surveys either had not been previously searched or were
documented only on the basis of spatially circumscribed fossil localities.
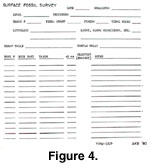 Survey parties usually consist of three to six
individuals, each of whom is given a biostratigraphic survey card to fill out
(Figure 4) as he or she covers the assigned area of outcrops. Well-defined
blocks of exposures are typically surveyed by several individuals together,
evening out differences in experience between individuals. One individual is
responsible for assigning the search area and for keeping people on more-or-less
parallel tracks along the outcrops, for noting light and substrate/slope
conditions, outlining the area on airphoto overlays, and collecting the cards at
the end of each survey. Individuals vary in their ability to identify fossils,
so the more experienced typically assisted the less experienced. In practice,
most of the surface fossils can only be identified to major vertebrate or mammal
group, which is relatively easy even for inexperienced collectors.
Survey parties usually consist of three to six
individuals, each of whom is given a biostratigraphic survey card to fill out
(Figure 4) as he or she covers the assigned area of outcrops. Well-defined
blocks of exposures are typically surveyed by several individuals together,
evening out differences in experience between individuals. One individual is
responsible for assigning the search area and for keeping people on more-or-less
parallel tracks along the outcrops, for noting light and substrate/slope
conditions, outlining the area on airphoto overlays, and collecting the cards at
the end of each survey. Individuals vary in their ability to identify fossils,
so the more experienced typically assisted the less experienced. In practice,
most of the surface fossils can only be identified to major vertebrate or mammal
group, which is relatively easy even for inexperienced collectors.
For each biostratigraphic survey block, the
surveying team typically spends several hours walking along a dissected,
low-relief strike valley or proceeding carefully across the steeper slopes below
a capping sandstone looking for fossils. When a team member finds a fossil,
decisions must be made during the recording process about the identity and size
of the bone or tooth fragment (Figure 4). A number of rules were developed to
standardize recording and collecting of some of the materials encountered on the
surveys.
- At the start of each biostratigraphic survey
block, the surveyor fills out the top portion of the card, and at the end of the
block notes the finish time and total hours. Individuals were asked to stop the
clock during any significant rest-breaks during the surveys.
- All bones are recorded, either tallied as
“scrap” if unidentifiable or “turtle scrap” if identifiable as such, or as
separate items numbered sequentially and identified to body part and taxon. Body part can be as non-specific as “limb fragment - mammal,” or as specific as
“upper right premolar - Hipparion.”
- Patches of multiple fragments of bones or
teeth that have recently broken up on the eroded surfaces are counted as
single occurrences.
- Each bone is scored as either larger or smaller
than 5 cm maximum dimension, to keep track of the degree of fragmentation in a
survey block and also the observation capabilities of different surveyors.
- Two or more identifiable and separately
recorded bones from the same or different individuals that occur in a small area
(e.g., ~1-10 square meters) are noted as “clusters” by brackets on the survey
card (Figure 4). Some of these were later designated as localities and given a
locality number.
- If a surveyor is stuck on fossil
identification, he/she calls in another surveyor for a second opinion, or in
some cases collects the specimen for later identification. We often convened
periodically to go over identifications, and in practice, most people kept close
enough together that it was easy to check an identification without stopping the
survey.
- The group leader(s) are called in to collect
particularly good or informative specimens, which are documented on air photos
or, in some cases, simply to survey level and block. Surveyors are instructed
to leave such specimens in place and to put a cairn at the discovery site, then
get the assistance of other team members. If air photographs and/or a GPS are
available, map position and GIS coordinates should also be recorded.
- At a particularly rich patch of fossils, i.e.,
a locality, the survey clock is stopped and the team gathers to collect the
patch and document it as a locality. Once this is done, the clock starts again,
and the survey continues.
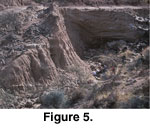 This procedure can result in a lot of information
in a relatively short period of time, depending of course on the density of
surface fossils and the size of the survey team. It can also result in the
discovery of high-quality specimens (Figure 5) as well as the collection of
additional identifiable material to supplement formal localities (Barry et al.
1980, 2002). The standardized methodology allows various kinds of analyses that
are not possible with more free-form paleontological surveying. In the examples
to follow, we focus on measures of fossil productivity – identifiable bones and
teeth per search hour, ratios of different taxa or body parts – e.g., bovid
versus equid and teeth versus axial remains, abundance of a particular taxon
relative to total identifiable sample, etc. The fossil productivity measures
can be used in conjunction with geological data to investigate how sedimentary
environments or stratigraphic intervals vary in fossil richness. Taxonomic
data, even at very coarse levels of identification (e.g., mammal versus reptile)
can provide evidence for questions such as the abundance of aquatic components
in the fauna. The value of such information is most apparent when the data are
compared through time or across different areas representing the same time.
This procedure can result in a lot of information
in a relatively short period of time, depending of course on the density of
surface fossils and the size of the survey team. It can also result in the
discovery of high-quality specimens (Figure 5) as well as the collection of
additional identifiable material to supplement formal localities (Barry et al.
1980, 2002). The standardized methodology allows various kinds of analyses that
are not possible with more free-form paleontological surveying. In the examples
to follow, we focus on measures of fossil productivity – identifiable bones and
teeth per search hour, ratios of different taxa or body parts – e.g., bovid
versus equid and teeth versus axial remains, abundance of a particular taxon
relative to total identifiable sample, etc. The fossil productivity measures
can be used in conjunction with geological data to investigate how sedimentary
environments or stratigraphic intervals vary in fossil richness. Taxonomic
data, even at very coarse levels of identification (e.g., mammal versus reptile)
can provide evidence for questions such as the abundance of aquatic components
in the fauna. The value of such information is most apparent when the data are
compared through time or across different areas representing the same time.
