METHODS
Samples and Collection
Conodont samples were collected from more than 70 superposed beds within the Lower Devonian Windmill Limestone
(Lochkovian) (Johnson
1970) at the SP-VII section, Coal Canyon, northern Simpson Park Range, central Nevada
(Berry and Murphy 1975;
Murphy and Berry,
1983). The SP-VII section exposes a regressive sequence that begins in the upper part of the deep-water, graptolitic Roberts Mountains Formation and the overlying allodapic carbonate and interbedded shale slope deposits of the Windmill Limestone
(Johnson and Murphy
1984). The section is very fossiliferous in both formations with a well-documented sequence of graptolite
(Berry and Murphy 1975), conodont
(Murphy and Matti
1983), brachiopod (Johnson
1973), and ostracode
(Evola
1983) faunas that have served as the basis for zonation of the middle Lochkovian and as a standard of reference for the interval
(Murphy and
Valenzuela-Ríos, 1999). The SP-VII section has been correlated previously to the Copenhagen Canyon section of the Monitor Range (COP IV-V), the latter section serving as a standard reference for the region
(Murphy and Berry,
1983). The section spans approximately 10 million years of the Lower Devonian (graptolite Zones
uniformis, praehercynicus, and hercynicus).
Specimens of Wurmiella were recovered from more than 50 beds, of which 15 with adequate sample sizes (> 10 specimens) were selected as the basis of the present statistical work. The lowest stratigraphic level sampled is denoted as sample 200, but thereafter stratigraphic levels (samples) are enumerated 8 to 15 in ascending stratigraphic order, with sublettering (for example, 9H) indicating successively higher samples.
W. wurmi was not included in the derivation of the graphic correlation relationship between sections SP-VII and COP IV-V.
Standard Spline Analysis
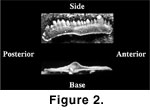 The smooth morphology of the element basal platform margins, and the absence of all but two geometrically homologous Type I landmarks
(Bookstein
1991) (Figure 2) means that much of the information of morphological variation is encompassed in the outline of the margin. A cubic spline was used to describe the platform margin outline and hence capture the variation
(Roopnarine et al.
2001).
The smooth morphology of the element basal platform margins, and the absence of all but two geometrically homologous Type I landmarks
(Bookstein
1991) (Figure 2) means that much of the information of morphological variation is encompassed in the outline of the margin. A cubic spline was used to describe the platform margin outline and hence capture the variation
(Roopnarine et al.
2001).
Individual elements were imaged in lateral view with a Pulnix electronic CCD camera mounted on a Wild dissecting microscope. Elements were imaged in a consistent lateral orientation with the element blade coplanar to the camera. This was accomplished by mounting micropaleontological slides on a stage capable of movement in three dimensions. The lateral margin of the platform was digitized using TnImage for Linux; the number of points used to describe a particular margin depended solely on the complexity of the margin and therefore varied among individual specimens. The digitized points were then converted to
Bookstein-style shape coordinates by the sequence of translation, rotation and rescaling
(Bookstein
1991), the anterior and posterior ends of the basal cavity (the two Type I landmarks), which spans the length of the element; these points serve as the anchors of the baseline
(Figure 3). 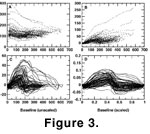 The shape of each margin was then reconstructed by fitting a cubic spline to the shape coordinates, and the spline standardized by computing new coordinates at fixed x-axis intervals. Intervals of 0.02, ranging from 0 to 1, were used for this study, resulting in each margin being described by 51 standard spline coordinates, of which two are redundant among specimens (the baseline anchors). The result is that all specimens vary in the y-dimension only. Use of a cubic spline to reconstruct the margin outline ensures a smooth reconstruction while minimizing the curvature between points; the result is that no extraneous information is added to the description of the outline. The standard spline approach also eliminates the necessity of a fixed number of digitized points per outline, as generally required if digitization follows a fixed angle sampling approach or the outline is divided into a fixed number of equally spaced points.
Singular Value Decomposition and Cross-Validation Analysis
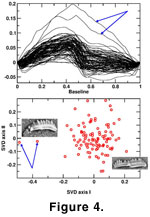 Sample homogeneity/heterogeneity was assessed using singular value decomposition
(SVD) of mean centered standard spline matrices (Sampson et al.
1996). Each sample was centered by representing specimens as deviations from the sample mean
spline. The structure of this matrix of deviations was then examined with SVD analysis, the resulting eigenvectors of which characterize the major regions of dispersion of the splines within the sample. Each specimen was also given a score or location on each eigenvector (a function of the variable loadings on the eigenvector), the value of which reflects the shape of the spline
(Figure 4). The resulting distribution of specimen scores is therefore a measure of sample homogeneity, and this is tested further with a cross-validation analysis of the
SVD.
Sample homogeneity/heterogeneity was assessed using singular value decomposition
(SVD) of mean centered standard spline matrices (Sampson et al.
1996). Each sample was centered by representing specimens as deviations from the sample mean
spline. The structure of this matrix of deviations was then examined with SVD analysis, the resulting eigenvectors of which characterize the major regions of dispersion of the splines within the sample. Each specimen was also given a score or location on each eigenvector (a function of the variable loadings on the eigenvector), the value of which reflects the shape of the spline
(Figure 4). The resulting distribution of specimen scores is therefore a measure of sample homogeneity, and this is tested further with a cross-validation analysis of the
SVD.
The cross-validation analysis proceeds by removing specimens from the sample one at a time (with subsequent replacement) and reconducting the SVD with each removal. Any specimen that is a statistical outlier is expected to exert significant influence on the results of the full-sample SVD
(Reyment and Jöreskog
1996). Its removal will result in significant alteration of the SVD eigenvectors, and this is detected as a reduction in the correlation between reduced-sample SVD eigenvectors and full-sample eigenvectors.
Ontogenetic Allometry
The exact manner in which the P1 element increases in size remains unknown, but the lamellar cross-sectional patterns of many conodont elements suggest that they grow by expansion around the basal cavity. Growth is not by simple accretion, since element shape changes, and structures such as denticles are added as size increases. Quantifying element shape and shape variation within a sample presents an opportunity to describe ontogenetic shape change in a precise manner for the first time.
The relationship between size and shape of the platform margin was examined as the relationship between centroid size, SVD scores, and spline shape coordinates. The correlations between significant SVD eigenvectors (determined as proportion of sample variance explained by each eigenvector) and centroid size were measured, a significant correlation indicating significant shape change with changing size, that is,
allometry. Following the detection of allometry, the actual associated changes in shape are measured with a multivariate regression of the shape coordinates on centroid size and calculation of predicted spline shapes throughout the size range of the sample.
Mode of Evolution
Describing the mode of evolution of W. wurmi during the time represented by the SP-VII section is a three-step procedure. First, all the samples must be aligned stratigraphically and placed on a common temporal scale. In this case, the samples were placed on a composite stratigraphic scale derived from the graphic correlation of SP-VII with another section of the Windmill Limestone, COP IV-V (Copenhagen Canyon area). COP IV-V has served as the standard reference section for much of the biostratigraphic work that has been conducted on the Windmill Limestone sections in this area
(Murphy
and Berry 1983). Second, the samples are ordinated within a common multivariate space to facilitate standard inter-sample comparisons. This was accomplished with a canonical variates analysis
(CVA) of the sample SVD scores, which tests both inter-sample discrimination (with a prior multivariate analysis of variance
[MANOVA]) and ordinates specimens according to their canonical or Mahalanobis distances.
Evolutionary pattern, and consequently mode, cannot be determined from visual inspection of stratophenetic series, nor from straightforward statistical comparisons of net differences over a stratigraphic interval. The likelihood of random walks meeting criteria of directionality under such conditions, yet with no underlying deterministic mechanisms, precludes such approaches
(Bookstein
1988). A random walk and randomization technique (Roopnarine
2001) was therefore used to search for non-randomness in the SVD I-III stratophenetic series. Evolutionary mode of
W. wurmi in the SP-VII section was determined by analyzing the temporal passage of the samples through the conodont lower profile morphospace as described by SVD analysis of the samples. The analysis used here measures the deviation of the stratophenetic series sample means from the expectation of a random walk through the
morphospace. It proceeds by measuring the pattern or the information content of the series with an estimation of the Hurst component, which is in fact a measure of the fractal dimension of the passage. The relationship of the calculated Hurst estimate to that expected of a random walk is tested with comparison of the estimate to a distribution of estimates derived from repeated randomization and re-analysis of the stratophenetic series. Any stratophenetic series so analyzed may then be classified as significantly directional, random, or constrained (static). The entire procedure is described in greater detail in
Roopnarine
(2001).
The standard spline analysis, SVD and cross-validation SVD analyses were performed by programs written in C++ and Octave for Linux, while other statistical analyses were performed with
Stata-SE 7.0 for Linux and SYSTAT 10 for Windows. The Hurst estimation analysis was performed with Enigma-1.0 for Linux
(Roopnarine
2001).
