RESULTS
Sample Composition and Discrimination
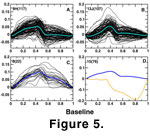 Singular value decomposition analysis and cross-validation SVD were performed on each stratigraphic sample to examine sample homogeneity and detect possible outliers. Most samples were homogeneous and without outliers, and the majority of specimens per sample can be assigned to a single variable species. Throughout the section, however, there are three distinct
morphotypes. The most common morphotype has a lateral profile that is concave posterior to the basal or central cavity and horizontal anterior to the cavity
(Figure 5A). These specimens are assignable to
Wurmiella wurmi. The second morphotype is distinguishable from W. wurmi by having a convex profile posterior to the basal cavity and is assignable to
W. tuma (Figure 5B), first described by
Murphy and Matti (1983) as a subspecies of
Ozarkodina excavata and was later elevated to species status (Murphy and Cebeçioglu
1986) on the basis of differences in denticulation frequency.
W. tuma is stratigraphically restricted, and Murphy and Cebeçioglu (1986) hypothesized that it is a cladogenetic descendant of what was considered by these authors to be
O. excavata (=W. wurmi). There is no stratigraphic overlap between the two
morphotypes, with W. tuma occurring in only a short interval in the upper portion of the section. The third morphotype comprises individuals with significantly concave arches, and while it is dominant in only one sample (8), additional individuals do occur infrequently throughout the section. This morphotype is clearly and statistically distinct from the common
W. wurmi morphotype in the section, though it has been repeatedly referred to that species in the past (for example,
Murphy and Cebeçioglu
1986). It is designated here as a potentially new species,
W. n. sp. (Figure 5C). Finally, there is a single aberrant individual in sample 15 that is not yet assignable to a described
taxon; similar specimens do not occur anywhere else in the section. This specimen is not included in further analyses.
Singular value decomposition analysis and cross-validation SVD were performed on each stratigraphic sample to examine sample homogeneity and detect possible outliers. Most samples were homogeneous and without outliers, and the majority of specimens per sample can be assigned to a single variable species. Throughout the section, however, there are three distinct
morphotypes. The most common morphotype has a lateral profile that is concave posterior to the basal or central cavity and horizontal anterior to the cavity
(Figure 5A). These specimens are assignable to
Wurmiella wurmi. The second morphotype is distinguishable from W. wurmi by having a convex profile posterior to the basal cavity and is assignable to
W. tuma (Figure 5B), first described by
Murphy and Matti (1983) as a subspecies of
Ozarkodina excavata and was later elevated to species status (Murphy and Cebeçioglu
1986) on the basis of differences in denticulation frequency.
W. tuma is stratigraphically restricted, and Murphy and Cebeçioglu (1986) hypothesized that it is a cladogenetic descendant of what was considered by these authors to be
O. excavata (=W. wurmi). There is no stratigraphic overlap between the two
morphotypes, with W. tuma occurring in only a short interval in the upper portion of the section. The third morphotype comprises individuals with significantly concave arches, and while it is dominant in only one sample (8), additional individuals do occur infrequently throughout the section. This morphotype is clearly and statistically distinct from the common
W. wurmi morphotype in the section, though it has been repeatedly referred to that species in the past (for example,
Murphy and Cebeçioglu
1986). It is designated here as a potentially new species,
W. n. sp. (Figure 5C). Finally, there is a single aberrant individual in sample 15 that is not yet assignable to a described
taxon; similar specimens do not occur anywhere else in the section. This specimen is not included in further analyses.
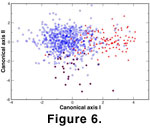 A multivariate analysis of variance and canonical variates analysis were performed on the pooled SVD scores of each morphotype in order to compare the
morphotypes. Results indicate that all morphotypes differ significantly (Wilks'
A multivariate analysis of variance and canonical variates analysis were performed on the pooled SVD scores of each morphotype in order to compare the
morphotypes. Results indicate that all morphotypes differ significantly (Wilks'
 =0.441, p<0.0001)
(Figure 6) and the morphological discontinuities suggest that they should be treated as individual
taxa. SVD analysis of the multiple W. wurmi samples (first morphotype), however, yields no obvious discrimination
within this taxon, though there is noticeable variation within individual samples.
=0.441, p<0.0001)
(Figure 6) and the morphological discontinuities suggest that they should be treated as individual
taxa. SVD analysis of the multiple W. wurmi samples (first morphotype), however, yields no obvious discrimination
within this taxon, though there is noticeable variation within individual samples.
Allometry
The quantitative description of shape variation and separate recording of size present the opportunity to examine static allometry in each sample. Most samples had broad size ranges and significant relationships between profile variability and size, and it was therefore possible to calculate allometric relationships for these samples and to predict shape throughout a sample's size range. In several cases there was no significant allometry within a sample, and in these instances the shape of a sample was summarized simply as the mean morphotype profile for that sample.
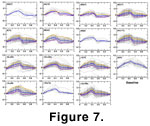
Figure 7 A-D
illustrates the allometries of the dominant morphotype in each sample. The first
series outlines sample allometries of W. wurmi (morphotype 1). The
general pattern throughout the samples is a change of margin shape, posterior to
the central cavity, from very straight, to slightly basal-concave at the mean
size. Further growth is relatively isometric (for example sample 10Li), or
involves either continued increase of concavity of the posterior margin (for
example samples 14L and 15), and/or a posterior shift in the relative position
of the central cavity (for example samples 8A-9E). These stratigraphically
successive allometric patterns are interesting both from the standpoint of
stability or stasis over brief stratigraphic intervals, as well as their
fluctuation within the lineage over longer periods of time.
The highly arched W. n. sp. is present in
significant numbers only in sample 8 and exhibits no allometric change (Figure 7D).
This may be a function of small sample size but is more likely caused by a
narrow size range preserved within the sample. Finally, W. tuma (sample
13J) does exhibit allometry, with the concavity of the central cavity becoming
more pronounced with increasing element size and also shifting to a more
anterior relative position (Figure 7D).
Microevolutionary Mode of Wurmiella wurmi
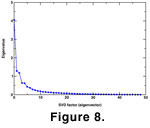 Samples of Wurmiella wurmi were discriminated from the other taxa on the basis of the canonical variates analysis (above). The pooled samples were subjected to a single SVD analysis in order to examine intraspecific variation and microevolutionary dynamics. The first three eigenvectors accounted for the majority of the variance in the pooled sample (58.23%)
(Figure 8) and are the only eigenvectors considered for further analysis. The nature of the SVD analysis ensures that the eigenvectors are orthogonal, so they may be treated as independent characters in the analysis of microevolutionary pattern.
Samples of Wurmiella wurmi were discriminated from the other taxa on the basis of the canonical variates analysis (above). The pooled samples were subjected to a single SVD analysis in order to examine intraspecific variation and microevolutionary dynamics. The first three eigenvectors accounted for the majority of the variance in the pooled sample (58.23%)
(Figure 8) and are the only eigenvectors considered for further analysis. The nature of the SVD analysis ensures that the eigenvectors are orthogonal, so they may be treated as independent characters in the analysis of microevolutionary pattern.
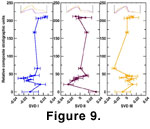 Sample distributions for each eigenvector are illustrated in
Figure 9. Sampling is not distributed evenly along the stratigraphic section, due primarily to the relative scarcity of
W. wurmi between stratigraphic composite units (SCU) 75 and 150; samples in that interval are generally specimen-poor, though current sampling efforts may remedy that situation in the near future. Each SVD axis represents a different aspect of margin shape, and it is obvious that the axes are not reflecting similar patterns of evolutionary change. For example, the first axis is a measure of the overall arch or concavity of the platform, the second axis contrasts concavity of the margin anterior and posterior to the basal cavity, and the third axis reflects the relative position of the cavity as well as the shape and concavity of the margin posterior to the cavity
(Figure 9).
Sample distributions for each eigenvector are illustrated in
Figure 9. Sampling is not distributed evenly along the stratigraphic section, due primarily to the relative scarcity of
W. wurmi between stratigraphic composite units (SCU) 75 and 150; samples in that interval are generally specimen-poor, though current sampling efforts may remedy that situation in the near future. Each SVD axis represents a different aspect of margin shape, and it is obvious that the axes are not reflecting similar patterns of evolutionary change. For example, the first axis is a measure of the overall arch or concavity of the platform, the second axis contrasts concavity of the margin anterior and posterior to the basal cavity, and the third axis reflects the relative position of the cavity as well as the shape and concavity of the margin posterior to the cavity
(Figure 9).
 Visual inspection of the stratophenetic series in
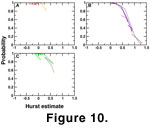
Figure 9 suggests several microevolutionary features. None of the characters seem to undergo net evolutionary change, though there are some suggestions of directionality. Analyses of the series using the Hurst estimation procedure
(Roopnarine
2001) result in SVD I and III being categorized as static series. The SVD I trajectory moves very little as the series is analyzed
(Figure 10A), and its very low Hurst estimate
values are strongly suggestive of a morphology that is not varying randomly but is perhaps constrained. SVD III varies more than SVD I, and could be described as a classic stasis, or `no net change' type of pattern
(Figure 10C). SVD II, however, exhibits significant directionality in the stratigraphic interval 25-50 SCU
(Figure 10B), and this is documented by its trajectory's high values and relatively low probabilities of being generated by a random process (95%
c.i. of minimum P value of the trajectory, 0.548
Visual inspection of the stratophenetic series in
Figure 9 suggests several microevolutionary features. None of the characters seem to undergo net evolutionary change, though there are some suggestions of directionality. Analyses of the series using the Hurst estimation procedure
(Roopnarine
2001) result in SVD I and III being categorized as static series. The SVD I trajectory moves very little as the series is analyzed
(Figure 10A), and its very low Hurst estimate
values are strongly suggestive of a morphology that is not varying randomly but is perhaps constrained. SVD III varies more than SVD I, and could be described as a classic stasis, or `no net change' type of pattern
(Figure 10C). SVD II, however, exhibits significant directionality in the stratigraphic interval 25-50 SCU
(Figure 10B), and this is documented by its trajectory's high values and relatively low probabilities of being generated by a random process (95%
c.i. of minimum P value of the trajectory, 0.548 P0.042). Beyond that interval, however, the series becomes significantly constrained.
