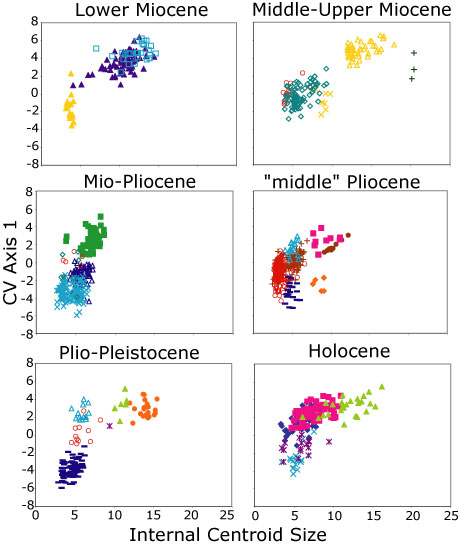
Figure 9. Centroid size based on interior landmarks vs. CV Axis 1 for Caryocorbula. Data are identical to Figure 7 and Figure 8 but scores are separated onto plots representing same time intervals as in Figure 8. Symbols as in Figure 7.