Materials and methods
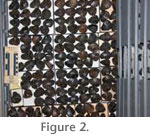 One of the best ways to address this question is to measure a relatively large set of fossilized intermembranous and endochondral bones from a homogeneous population. Unfortunately, most fossil samples only rarely preserve sesamoid bones, especially the small sesamoids of the manus and pes, or else the taxonomic identity of the sesamoids cannot be established. Some exceptions to this rule are the large samples of bones (Figure 2) from late Pleistocene localities such as Rancho La Brea tar pits (Stock and Harris 1992) and cave deposits such as San Josecito Cave in Nuevo Leon, Mexico (Arroyo-Cabrales et al. 2003)
In this study, we measured samples of intermembranous and endochondral bones from nearly all the large mammals for which a sufficiently large sample (wherever possible, more than 100 of each element) exists. These include two ground sloths (Paramylodon harlani and Nothrotheriops shastensis), the extinct bison Bison antiquus, the extinct horse Equus occidentalis, the lamine camelid Camelops hesternus, the Ice Age lion Panthera atrox, and the saber-toothed cat Smilodon fatalis. The only common mammal not included in the study was the dire wolf (Canis dirus), which is currently under study by F.R. O'Keefe (personal commun., 2008).
Sloths not only possess patellae and sesamoids of the manus, but also a layer of dermal ossicles just under the skin, similar to an armadillo's armor, which may have been used as protection against predators (Stock 1925). The ossicles of the species Paramylodon harlani are the most common fossil found at the La Brea tar pits (S. Cox, personal commun.). Previous literature on giant ground sloths have commented on high levels of variability and sexual dimorphism amongst the larger species, Eremotherium eomigrans (De Iuliis and Cartelle 1999). However, our previous study found that the Rancho La Brea sloths did not exhibit significant size variability or sexual size dimorphism. Their bones did show some shape variability (Prothero and Raymond 2008), which is apparent in intermembranous bones such as the patella (Figure 1).
None of the specimens from Rancho La Brea and very few of those from San Josecito Cave are articulated or associated, so there is no way to relate individual bones to individual animals. In the case of Rancho La Brea bones, the radiocarbon dates for the samples we used are tightly clustered (Marcus and Berger 1984) so they appear to sample populations over a small interval of time and are not significantly time averaged. In addition, our work on most of the Rancho La Brea mammals and birds (Prothero and Raymond 2008;
Prothero et al. 2009) demonstrates no significant size or shape change over the entire 40,000 years that the bones accumulated, so even if the samples spanned significant time intervals, they would not show increased size variation.
All of the bones measured in this study were unworn and pristine in condition, so there is no evidence of taphonomic abrasion or breakage that might affect the data set. As shown by
Prothero and Raymond (2008), most postcranial bones show no evidence of sexual size dimorphism, so there is no way to segregate the bones into the two sexes. We eliminated bones that were poorly ossified or looked like they might belong to juveniles, so the samples we measured should contain only bones of mature adult individuals.
The La Brea felids, Smilodon fatalis and Panthera atrox, have been described in literature (Merriam and Stock 1932) quite thoroughly but very little research has been conducted specifically focusing on the variation of their intermembranous bones. Most research of these creatures involves their masticatory apparatus, paleodiet, paleoecology and systematic description. The osteology of Camelops was last reviewed by
Webb (1965), and the systematics and osteology of North American Pleistocene bison was reviewed by
McDonald (1981), but there has not been a lot of recent published research on the osteology of the La Brea horse (E. Scott, personal commun.)
Using dial calipers, the first author measured several dimensions of a grand total of over 1800 bones from these species and entered data into Microsoft Excel spreadsheets. Measurements of the 989 intermembranous bones were taken from the maximum lateral width, proximo-distal length and dorso-plantar depth of patellae and inner and outer carpal sesamoids. The endochondral bone selected for study was the astragalus, which was very abundant and could be measured in comparable dimensions and was comparable in size to the patella. Measurements of the 811 astragali were taken of the proximo-distal height, lateral width, and maximum dorso-plantar depth. In all cases, the measurements were taken along axes that represent the strain between articular surfaces, and thus should have functional significance.
Using Microsoft Excel, means and standard deviations of each dimensional measurement were calculated
(Table 1). The statistical analyses followed the methods of
Sokal and Rohlf (1994,
2009) and
Plavcan and Cope (2001). These data were then used to calculate the coefficients of variation, which is used in paleontological and biological studies to determine the level of variability within a sample population. The coefficient of variation is defined as 100*(standard deviation/mean). Because the units of measurement in the standard deviation and the mean are the same, the CV becomes a unitless measurement. This is especially useful when comparing bones of significantly different sizes, since the standardization of the mean by the standard deviation makes the CV uniform, regardless of absolute size. The comparison of the coefficients of variation, which are derived from different distributions, is consistently valid and useful if the samples share a similar or related structure, position or value (Simpson et al. 1960;
Lande 1977;
Sokal and Rohlf 1994;
Polly 1998;
Dayan et al. 2002;
Meiri et al. 2005). Fifty years of zoological research indicates that for most mammal populations, CVs will be less than 10 except for features that are extremely sexually dimorphic (Kurtén 1953;
Simpson et al. 1960;
Yablokov 1974).
Additional statistical analyses were conducted to test for significance of variability between intermembranous and endochondral bones. However, in order to determine which tests are appropriate to the study, we first had to determine whether the data samples are normally distributed. Using the f-statistic, probability plots were calculated by ranking the measurements and assigning a z-score (individual raw score minus population mean). Z-scores were plotted on bivariate plots (on the y-axis) against the ranked data (on the x-axis), and a regression line was added. In a normal distribution, the regression line crosses the x-axis at about the mean, and the slope is close to the reciprocal of the standard deviation. If all the data are normally distributed, certain parametric tests are then appropriate to analyze the variability of the samples.
The next test used to determine which statistical methods would be appropriate for this study is the f-test for equality of variances. Variance is defined as the average of the squared deviations from the mean, or the square of the standard deviation. Therefore, the variance is a measure of statistical dispersion from the sample mean and portrays the degree of distribution. The f-test measures whether the variances from two samples are statistically equal or unequal. The null hypothesis in this test states that the variances of the two normally distributed samples are equal and, therefore, comparable. The alternate hypothesis states that the variances are unequal. If the null hypothesis is accepted, t-tests for equal variances and Analysis of Variance (or ANOVA) are applicable to this study. If the null hypothesis is rejected, t-tests are available to assess the differences in means where the variances are assumed to be unequal. For an ANOVA to be valid, the samples involved must have a normal distribution, have equal variances, and variables must be independent. In this case there is one measurement variable and one nominal (or categorical) value. The purpose of the test is to analyze how much of the variation among the observations is due to variation in each factor (nominal variable) influencing the character (measurement value) being studied. If the F value is greater than the F-critical value, there is a statistically significant difference and the null hypothesis of equal means is rejected.
In addition to these traditional methods, we also used the modified Levene's test (Levene 1960;
Lewontin 1966;
Schultz 1985;
Plavcan and Cope 2001) to determine whether the variabilities of two samples were significantly different. The modified Levene test uses natural logs to remove effects of relative size then calculates the absolute values of differences between each individual measurement and the median, which can then be analyzed for mean and standard deviation and tested for significance using ANOVA.