| |
METHODS
 Producing casts by traditional techniques, such as rubber or silicon molds, were rejected due to cost of material, labor, limited life span, storage issues, and potential damage to the track. Although casts have been used successfully for replication and distribution of fossils, including tracks, recent advances in 3D digitizing technology provide a high fidelity, low cost means of producing facsimiles that can be used in a variety of ways.
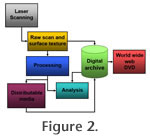
Figure 2 provides an overview of the process employed to achieve our aforementioned goals. Producing casts by traditional techniques, such as rubber or silicon molds, were rejected due to cost of material, labor, limited life span, storage issues, and potential damage to the track. Although casts have been used successfully for replication and distribution of fossils, including tracks, recent advances in 3D digitizing technology provide a high fidelity, low cost means of producing facsimiles that can be used in a variety of ways.
Figure 2 provides an overview of the process employed to achieve our aforementioned goals.
Data Acquisition
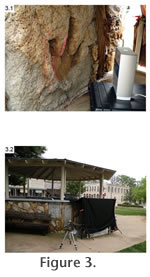
We employed a NextEngine™ HD Desktop 3D scanner and ScanStudio™ HD PRO software (NextEngine™ 2008,
Figure 3.1) running on a standard Windows XP 32 laptop. The scanner and pc were powered from outlets available on the bandstand. A tent was required to control lighting and maximize laser contrast (Figure 3.2).
 Based on the large size of the track (640 mm x 430 mm), precision was set to wide mode for single scans, capturing a view approximately 250 by 330 mm. The optimum recording distance from the scanner to the footprint was between 400 mm to 480 mm, measured before each scan. To ensure the greatest resolution, the NextEngine™ was set to HD (high definition), a tolerance of 0.13 mm, and a smoothing level of one. A surface attributes setting (light - dark) of 60% and matte surface were determine experimentally to give optimum color fidelity and surface capture. Data capture was focused primarily on the track impression and not on the peripheral surface of the limestone block. Multiple scan angles were required to capture all internal track surfaces and minimize occluded surfaces. Scans were rough aligned within ScanStudio™. Fifty-two overlapping scans (~2.0 GB in size) were saved. The scanner captured both point cloud data and RGB color textures during the scanning process, removing the need to integrate scan data with secondary surface images to create a photo-realistic model. Other scanner technologies may require this additional step. Based on the large size of the track (640 mm x 430 mm), precision was set to wide mode for single scans, capturing a view approximately 250 by 330 mm. The optimum recording distance from the scanner to the footprint was between 400 mm to 480 mm, measured before each scan. To ensure the greatest resolution, the NextEngine™ was set to HD (high definition), a tolerance of 0.13 mm, and a smoothing level of one. A surface attributes setting (light - dark) of 60% and matte surface were determine experimentally to give optimum color fidelity and surface capture. Data capture was focused primarily on the track impression and not on the peripheral surface of the limestone block. Multiple scan angles were required to capture all internal track surfaces and minimize occluded surfaces. Scans were rough aligned within ScanStudio™. Fifty-two overlapping scans (~2.0 GB in size) were saved. The scanner captured both point cloud data and RGB color textures during the scanning process, removing the need to integrate scan data with secondary surface images to create a photo-realistic model. Other scanner technologies may require this additional step.
Data Processing and Archiving
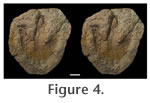 Raw scans were imported into Rapidform® XOR2™ Redesign (INUS 2009) to align and merge them into a single 3D model. The final 3D model was exported in Wavefront OBJ (Rose and Ramey 1993) format that includes mesh, material, and texture files (*.obj, *.mtl, *.jpg). LightWave 3D® version 9.3 software (NewTek 2007) was used to render the 3D object into common web accessible media Raw scans were imported into Rapidform® XOR2™ Redesign (INUS 2009) to align and merge them into a single 3D model. The final 3D model was exported in Wavefront OBJ (Rose and Ramey 1993) format that includes mesh, material, and texture files (*.obj, *.mtl, *.jpg). LightWave 3D® version 9.3 software (NewTek 2007) was used to render the 3D object into common web accessible media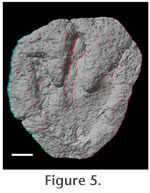 file formats (Figure 4,
Figure 5,
Appendix 1). Raw ScanStudio™ files, processed 3D object file (Appendix 2), and additional media formats were archived within the Shuler Museum of Paleontology at Southern Methodist University, Texas. file formats (Figure 4,
Figure 5,
Appendix 1). Raw ScanStudio™ files, processed 3D object file (Appendix 2), and additional media formats were archived within the Shuler Museum of Paleontology at Southern Methodist University, Texas.
Erosional Analysis
Visual inspection reveals that the track-bearing limestone surface has undergone deterioration since its mounting in 1933 (Figure 1.2), but to an unknown degree. Although
 theoretically possible, we made no attempt to quantify the morphology present at the time of Shuler's publication.
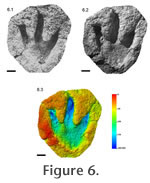
Shuler (1935, figures 2, 3) did make clay molds and plaster casts of the bandstand track; however, those and his original photographs and notes are now lost; therefore, quantitative comparisons with first generation facsimiles was not possible. To qualitatively assess erosional loss, we made visual comparisons with figure 1 from Shuler's original 1935 publication (Figure 6.1). theoretically possible, we made no attempt to quantify the morphology present at the time of Shuler's publication.
Shuler (1935, figures 2, 3) did make clay molds and plaster casts of the bandstand track; however, those and his original photographs and notes are now lost; therefore, quantitative comparisons with first generation facsimiles was not possible. To qualitatively assess erosional loss, we made visual comparisons with figure 1 from Shuler's original 1935 publication (Figure 6.1).
The 3D digital model provides a baseline to monitor future erosion using quantitative digital techniques. To demonstrate the potential of erosional monitoring, we modified the mesh of the 3D facsimile. Using Rapidform® XOR2™ Redesign's mesh tools, randomly chosen surface areas along the outer edges of the track impression were altered (Figure 7.1 - 7.2).
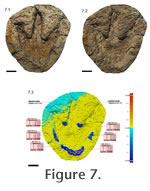 Within Rapidform® XOV2™ verifier software (INUS 2009), the modified scan model was compared to the baseline model to calculate the amount of deviation. Whole deviation analysis of XOV2™ aligns and compares spatial coordinates of the vertices, or points, in the new scan model to those of the baseline model, and calculates the gaps between points that depart, generating various reports that quantify the area and degree of divergence (Figure 7.3). Within Rapidform® XOV2™ verifier software (INUS 2009), the modified scan model was compared to the baseline model to calculate the amount of deviation. Whole deviation analysis of XOV2™ aligns and compares spatial coordinates of the vertices, or points, in the new scan model to those of the baseline model, and calculates the gaps between points that depart, generating various reports that quantify the area and degree of divergence (Figure 7.3).
Renderings of Digital Model
A two-dimensional image of the color mapped 3D model was rendered in Lightwave 3D (Newtek) to replicate a similar camera view and shadowing to what is seen in
Shuler's (1935) figure 1 (Figure 6.2). The camera view and light origin were visually approximated based on shadows in
Shuler's (1935) figure 1, and we made no assumptions as to camera type, lens, or distortion introduced by either. A second false color image of the 3D model was rendered to illustrate the relief of the impression, with cool colors indicating the deeper areas of the track (Figure 6.3). The render was done from the same perspective but with self-lighted surface attribute (luminosity = 100%) to eliminate shadows.
|