Figure 1. Scatter diagrams of winter sea surface temperature (SST) (¡C) versus squared chord distance (SCD) values between (A.) a modern planktonic foraminifer sample and 223 modern North Atlantic planktonic foraminiferal faunal analyses and (B.) a middle Pliocene sample from Deep Sea Drilling Project (DSDP) Hole 606 and the 223 modern core top samples. Twenty-one counting categories were used in these comparisons. Vertical blue bands indicate standard deviation about mean (shown by arrow) of 10 closest anologs to test samples. Horizontal pink band in lower panel highlights the no analog region of SCD values.
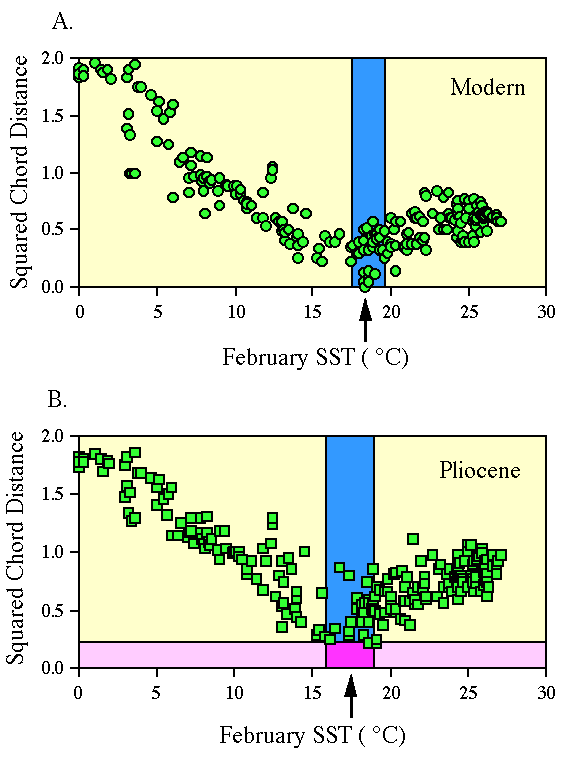
Figure 2. Warm and cold season latitudinal SST gradients for the North Atlantic Ocean. A.) Estimates of modern SST based upon MAT analyses of four core-tops are plotted as points with error bars of 1 standard deviation (s.d.). B.) Estimated Pliocene (2.795 Ma) SST gradients are based upon MAT analyses of four DSDP/ODP Sites in the North Atlantic (see text). Error bars are 1 s.d.
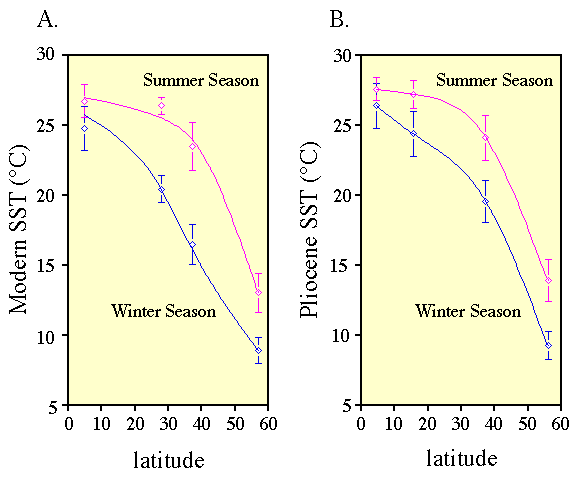
Figure 3. Map of the Pacific Ocean showing the location of Pliocene Sites 445, 463, and 769 and 499 samples with modern planktonic foraminifer data.
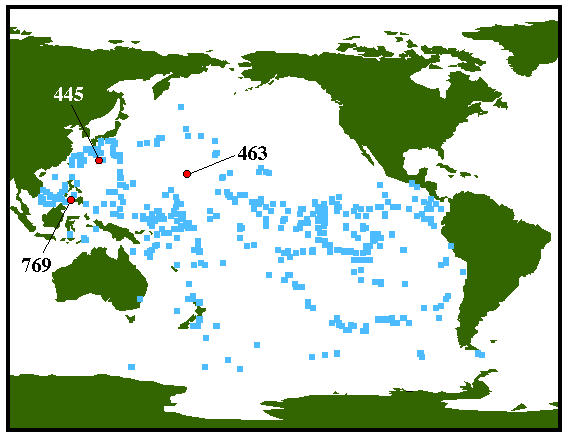
Figure 4. Graphic correlation diagram of DSDP Hole 445 and composite standard reference section of Dowsett (1989a and b). Circles and crosses indicate first and last occurrences respectively.
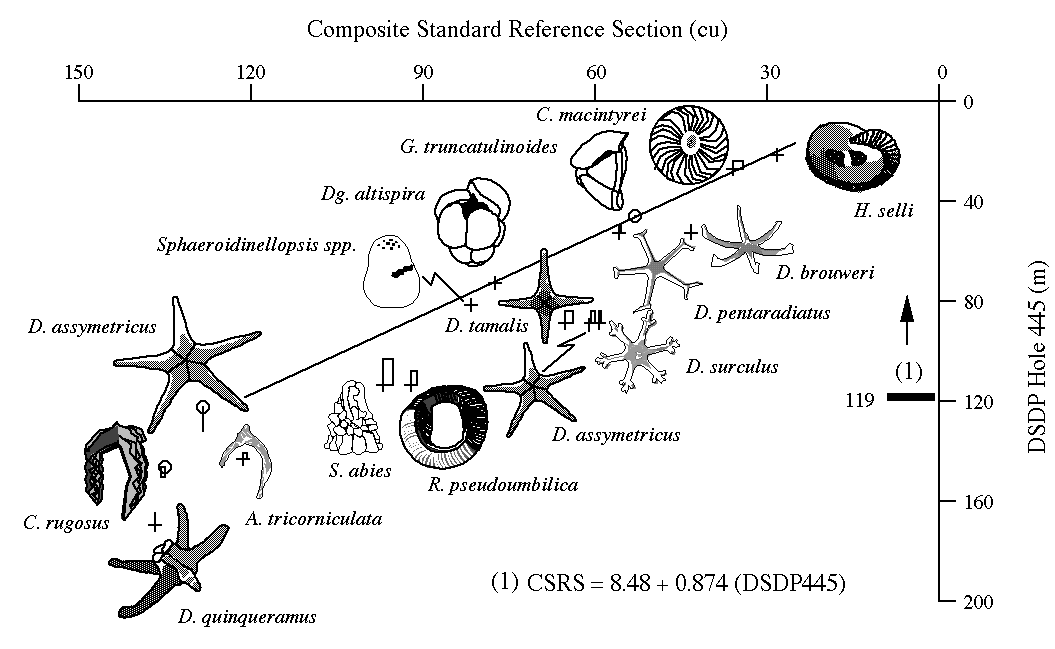
Figure 5. Graphic correlation diagram of DSDP Hole 463 and composite standard reference section of Dowsett (1989a and b). Circles and crosses indicate first and last occurrences respectively.
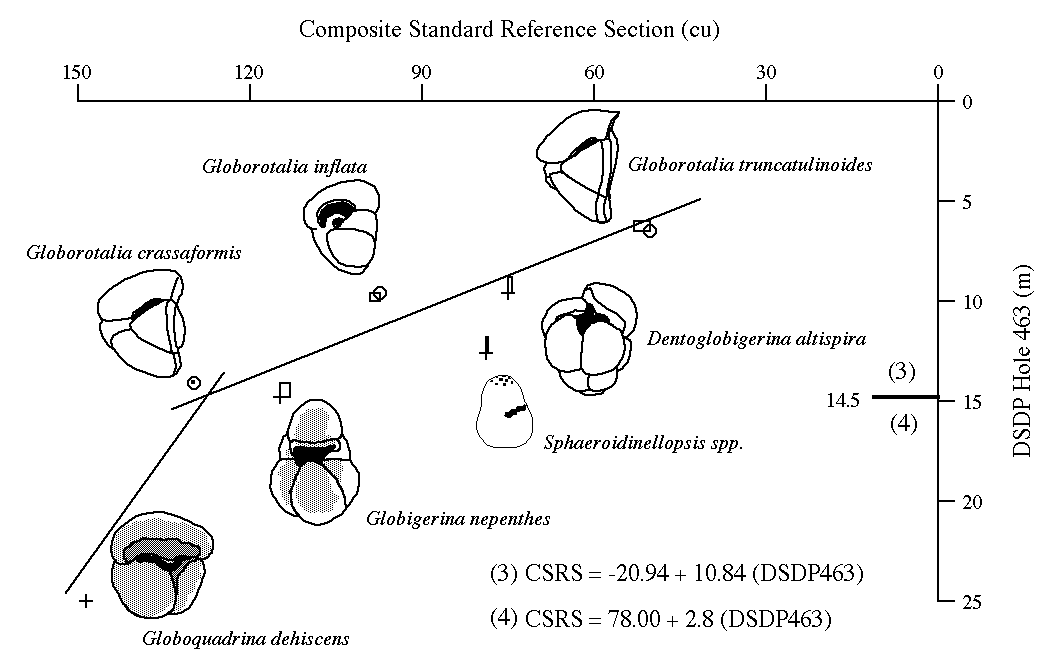
Figure 6. Magnetostratigraphic interpretation of the paleomagnetic record at ODP Hole 769B.
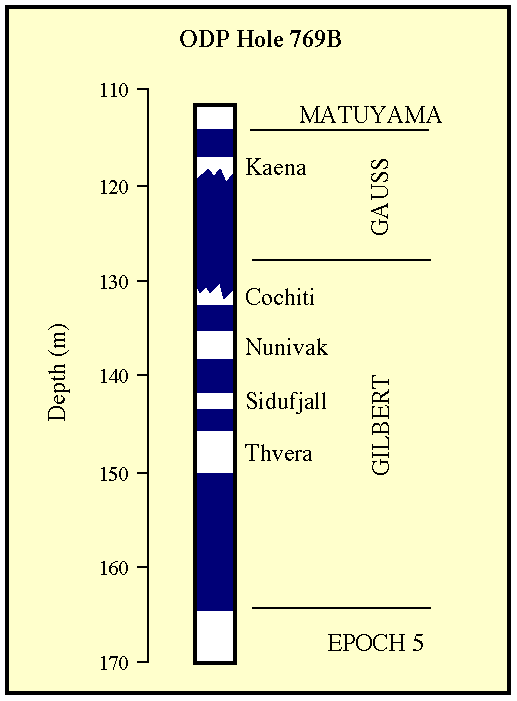
Figure 7. Sea surface temperature estimates (February = Blue, August = Red) for DSDP Holes 445 and 463 and ODP Hole 769, western North Pacific Ocean. Vertical black lines on each time series indicate modern winter and summer SST(¡C). Gray regions labeled “no analog” correspond to samples that have high SCD values and thus SST estimates are not considered reliable. PRISM time slab refers to the time interval between 3.15 Ma and 2.85 Ma (Geomagnetic Polarity Time Scale of Berggren et al., 1985). Error bars are ±1s.
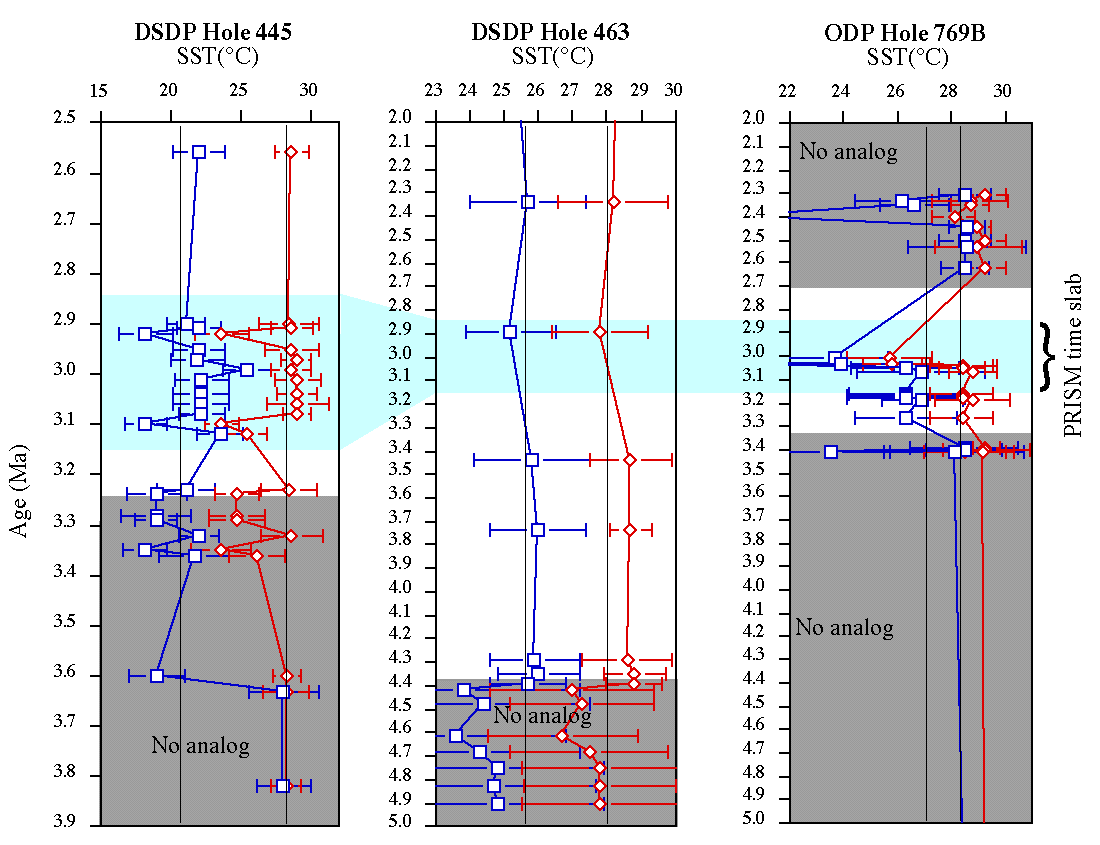
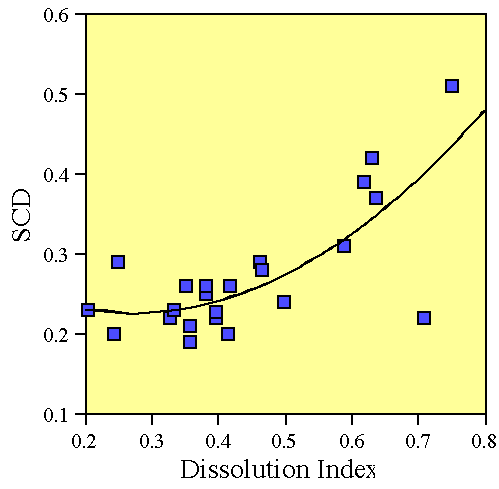
Figure 8. Relationship between Squared Chord Distance (SCD) and dissolution at DSDP Site 445.
