SEARCH SEARCH

Article Search

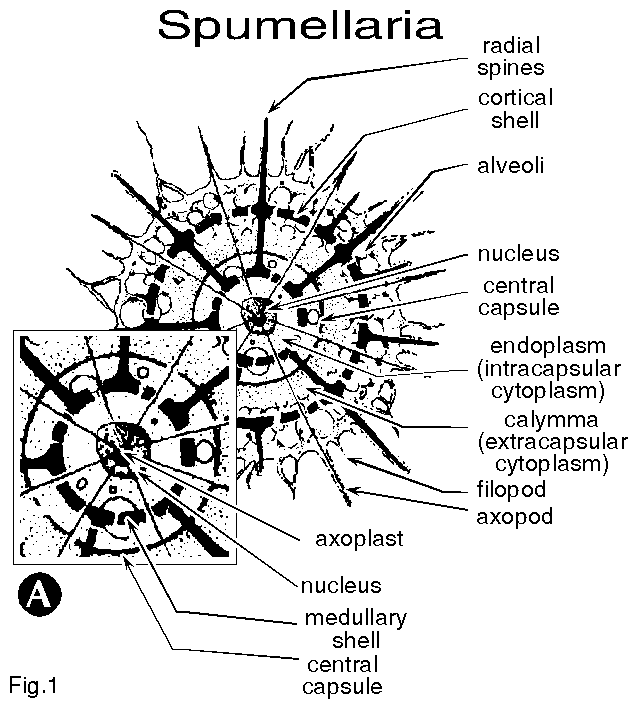
Figure 1A. Main features of a polycystine spumellarian cell. Slightly modified from Kling (1978) and Boltovskoy (1981e).
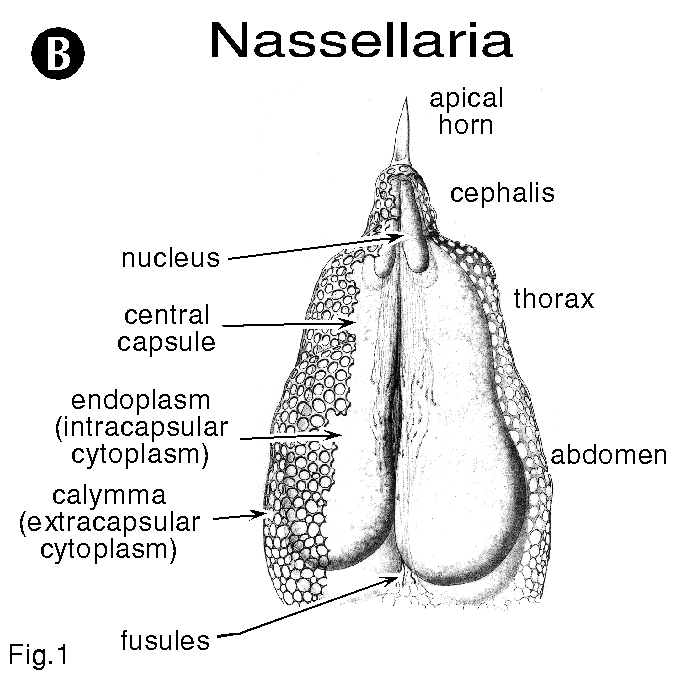
Figure 1B. Main features of a polycystine nassellarian cell. From Hollande and Enjumet (1960).
Figure 1C-E. General view of entire radiolarian colonies. C, D: by courtesy of Neil Swanberg (from Swanberg 1979); E: from Strelkov and Reshetnjak (1971).
Figure 2ABC. Characters used for the identification of spumellarian radiolarians. A, B, from Haeckel (1887); C: original.
Figure 2D, E. Characters used for the identification of spumellarian radiolarians. From Haeckel (1887).
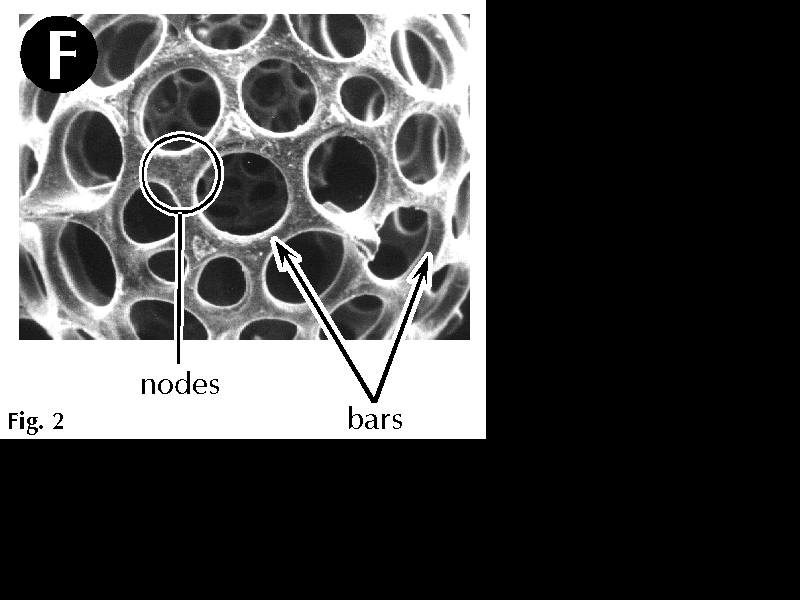
Figure 2F. Characters used for the identification of spumellarian radiolarians. Original.
Figure 2G. Characters used for the identification of spumellarian radiolarians. From Haeckel (1887).
Figure 2H, I. Characters used for the identification of spumellarian radiolarians. H: from Haeckel (1887); I: from Riedel (1958).
Figure 2J. Characters used for the identification of spumellarian radiolarians. Original.
Figure 2K. Characters used for the identification of spumellarian radiolarians. From Haeckel (1887).
Figure 2L, M. Characters used for the identification of spumellarian radiolarians. Original.
Figure 2N-S. Characters used for the identification of spumellarian radiolarians. M, P, Q: original; R: fom Nigrini and Moore (1979); N: from Dreyer (1889); O: from Petrushevskaya (1967); S: from Hollande and Enjumet (1960).
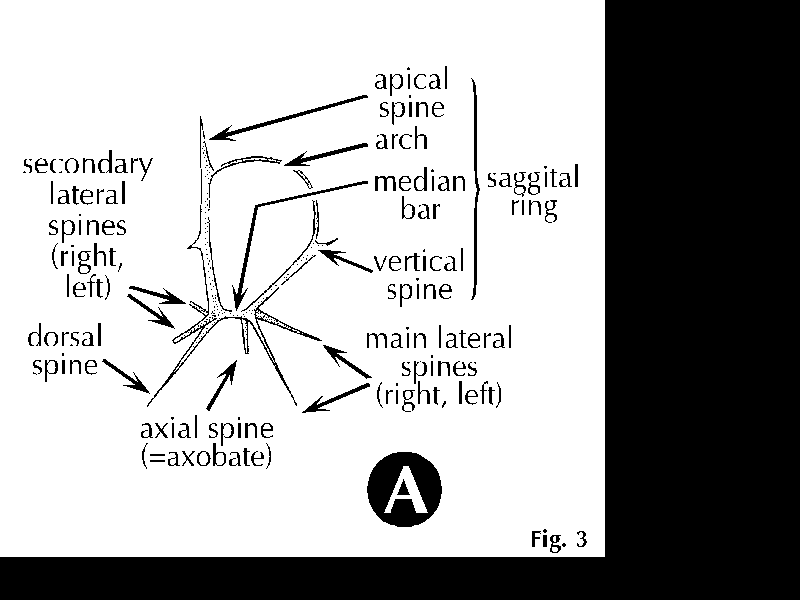
Figure 3A. Characters used for the identification of nassellarian radiolarians. From Petrushevskaya (1981).
Figure 3B, C. Characters used for the identification of nassellarian radiolarians. B: from Riedel (1958); C: from Petrushevskaya (1971a).
Figure 3D, E. Characters used for the identification of nassellarian radiolarians. From Petrushevskaya (1971a).
Figure 3F. Characters used for the identification of nassellarian radiolarians. From Haeckel (1887).
Figure 3G. Characters used for the identification of nassellarian radiolarians. From Petrushevskaya (1971a).
Figure 3H-J. Characters used for the identification of nassellarian radiolarians. H: original; I, J: from Petrushevskaya (1971a).
Figure 3K, L. Characters used for the identification of nassellarian radiolarians. K: from Petrushevskaya (1971a); L: from Riedel (1957).
Figure 3M, N. Characters used for the identification of nassellarian radiolarians. M: from Petrushevskaya (1971a); N: from Petrushevskaya (1981).
Figure 3O, P. Characters used for the identification of nassellarian radiolarians. O: from Petrushevskaya (1971a); P: from Paverd (1995).
Figure 3Q, R. Characters used for the identification of nassellarian radiolarians. From Petrushevskaya (1971a).
Figure 3S-W. Characters used for the identification of nassellarian radiolarians. S, T, U, V: original; W: from Petrushevskaya (1971a).
Figure 4A. Comparison of the mean percentage abundances for several numerically dominant polycystine species recovered in 0-300 m plankton tows with those from time-series sediment traps deployed at 853 m, in the eastern equatorial Atlantic. 1: Dictyocoryne profunda; 2: Spongodiscus resurgens; 3: Spongaster tetras; 4: Euchitonia elegans/furcata; 5: Stylochlamydium asteriscus; 6: Didymocyrtis tetrathalamus; 7: Spongotrochus glacialis; 8: Stylodictya multispina; 9: Arachnocorallium sp. (d) ; 10: Arachnocorallium sp. (a) ; 11: Arachnocorallium sp. (e) ; 12: Tetraplecta pinigera; 13: Cornutella profunda; 14: Dictyophimus gracilipes. From Boltovskoy et al. (1995).
Figure 4B. Comparison of the mean percentage abundances for several numerically dominant polycystine families and the two orders, recovered in 0-300 m plankton tows with those from time-series sediment traps deployed at 853 m, in the eastern equatorial Atlantic. 1: Spongodiscidae; 2: Pyloniidae; 3: Pyloniidae; 4: Litheliidae; 5: Coccodiscidae; 6: Collosphaeridae; 7: Plagoniidae; 8: Theoperidae; 9: Pterocorythidae; 10: Pterocorythidae; 11: Cannobotryidae; 12: Artostrobiidae; 13: Spumellaria; 14: Nassellaria. From Boltovskoy et al. (1995).
Figure 5A, A. Scanning electron microscope (left) and light-microscopy (right) photographs of the same radiolarian specimen, Cromyechinus antarctica. Notice that while SEM pictures yield great details of the surface of the shell-wall, they conceal all internal structures, most of which are important for identification purposes. From Boltovskoy (1981e), and Boltovskoy et al. (1983).
Figure 5B, B. Scanning electron microscope (left) and light-microscopy (right) photographs of the same radiolarian specimen, Larcopyle butschlii. Notice that while SEM pictures yield great details of the surface of the shell-wall, they conceal all internal structures, most of which are important for identification purposes. From Boltovskoy (1981e), and Boltovskoy et al. (1983).
Figure 5C, C. Scanning electron microscope (left) and light-microscopy (right) photographs of the same radiolarian specimen, Lithelius nautiloides. Notice that while SEM pictures yield great details of the surface of the shell-wall, they conceal all internal structures, most of which are important for identification purposes. From Boltovskoy (1981e), and Boltovskoy et al. (1983).
Figure 6. Schematic diagram of the mechanisms that can distort the sedimentary imprint of the planktonic pattern of fossilizable microplankton in general, and of polycystine radiolarians in particular (see text for detailed explanation). From Boltovskoy 1995.
Figure 7. Quantitative radiolarian distribution in the surface sedimentary layer of the South Atlantic. Redrawn from Goll and Bjørklund (1974).
Figure 8. Numbers of polycystine species reported in various surveys which presumably attempted to identify all members of this group in their samples (some figures are approximate). a: Benson 1966 (surface sediments from the Gulf of California); b: Renz 1976 (0-100 m plankton and surface sediments, selected satations); c: Boltovskoy and Riedel 1980 (0-1500 m plankton); d: Boltovskoy 1987 (surface sediments); e: Boltovskoy and Riedel 1987 (0-100 m plankton); f: Swanberg and Eide 1992 (0-400 m plankton); g: Boltovskoy et al. 1993a (sediment trap samples from 853 m); h: Boltovskoy et al. 1996 (sediment trap samples from 2195 m); i: Boltovskoy et al. 1995 (0-300 m plankton); j: Kling and Boltovskoy 1995 (0-2000 m plankton, selected samples); k: Paverd 1995 (5 m plankton); l: Welling 1990 (1000-1500 m sediment traps and surface sediments); m: Takahashi 1981 (400-5500 m sediment traps); n: Abelmann 1992 (300-2500 m sediment traps); o: Bjørklund 1973, and Swanberg and Bjørklund 1987 (0-1000 m fjord plankton samples and surface sediments); p: Abelmann and Gowing 1997 (0-1000 m vertically stratified plankton samples from 7 stations).
Figure 9. Fluctuations in polycystine numbers of species and specific diversity in surficial bottom sediments along a transect from the equator to the Antarctic in the south Pacific (based on data from Boltovskoy 1987).
Figure 10. Changes in the species richness and the equitability of radiolarian assemblages, as exemplified by single sample yields from an Equatorial area (from Boltovskoy 1987, surface sediments), a Transitional area (from data in Boltovskoy and Riedel 1987, 0-100 m plankton), and from the Antarctic (from data in Boltovskoy 1987, surface sediments).
Figure 11. Main biogeographic areas characterized by different radiolarian specific assemblages. Inset maps show the distribution of selected radiolarian species in surface sediments indicative of major biogeographic patterns (A, according to Goll and Bjørklund 1974); and B, Morley's (1977) biogeographic divisions of the South Atlantic based on the polycystine contents of 57 surface sediment samples).
Figure 12A, B. Vertical distribution patterns of polycystine radiolarians in various oceanic areas. In all cases total numbers of shells recorded are illustrated, which most probably significantly overestimates in situ living populations, especially below 100-200 m. From data in Kling and Boltovskoy (1995).
Figure 12C-E. Vertical distribution patterns of polycystine radiolarians in various oceanic areas. In all cases total numbers of shells recorded are illustrated, which most probably significantly overestimates in situ living populations, especially below 100-200 m. From data in Renz (1976).
Figure 12F, G. Vertical distribution patterns of polycystine radiolarians in various oceanic areas. In all cases total numbers of shells recorded are illustrated, which most probably significantly overestimates in situ living populations, especially below 100-200 m. From data in Boltovskoy and Alder (1992).
Figure 12H. Assumed proportions of live polycystine cells at various depths in the water column. From data in Kling and Boltovskoy (1995).
Figure 13. Schematic representation of the characteres used by Haeckel (1887) for the classification of the Sphaeroidea. 1: Ethmosphaerida; 2: Xiphostylida; 3: Staurostylida; 4: Hexastylida; 5: Coscinommida; 6: Carposphaerida; 7: Sphaerostylida; 8: Staurolonchida; 9: Hexalonchida; 10: Haliommida; 11: Thecosphaerida; 12: Amphistylida; 13: Stauracontida; 14: Hexacontida; 15: Actinommida; 16: Cromyosphaerida; 17: Cromyostylida; 18: Staurocromyda; 19: Hexacromyida; 20: Cromyommida; 21: Caryosphaerida; 22: Caryostylida; 23: Staurocaryda; 24: Hexacaryda; 25: Caryommida; 26: Plegmosphaerida; 27: Spongostylida; 28: Staurodorida; 29: Hexadorida; 30: Spongiommida.
Figure 14. Successive stages of growth of polycystine skeletons. From Petrushevskaya (1962, 1967).