Figure 1. Outline location map of New Zealand showing the fossil brachiopod locality in the Wanganui Basin on the North Island and the Recent brachiopod locality investigated on the Otago Peninsula of the South Island.
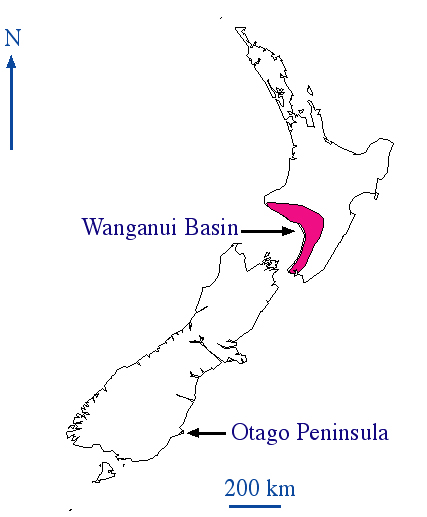
Figure 2. The locality that yielded the coloured fossil brachiopods close to the mouth of the Wairoa River, Wanganui Basin, North Island, New Zealand. The irregular erosional base of the conglomeratic layer containing the fossils is very obvious. The crowbar is 550 mm in length.
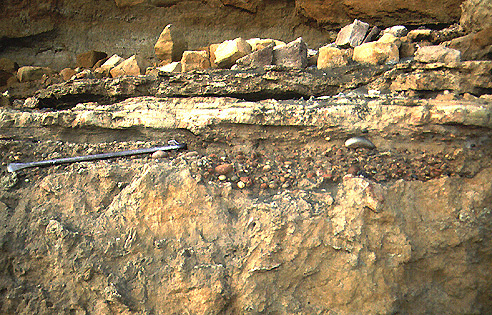
Figure 3. Ventral valve of fossil Calloria inconspicua showing concentric colouration that becomes most pronounced at growth lines. The specimen (GLAHM 101979) is 16.0 mm long and 14.5 mm wide.
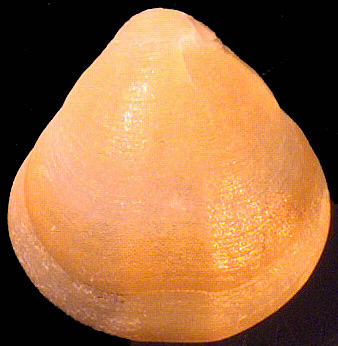
Figure 4. Incomplete ventral valve of Calloria inconspicua showing shell colouration. The specimen (GLAHM 101980) is 17.0 mm long and 15.1 mm wide.
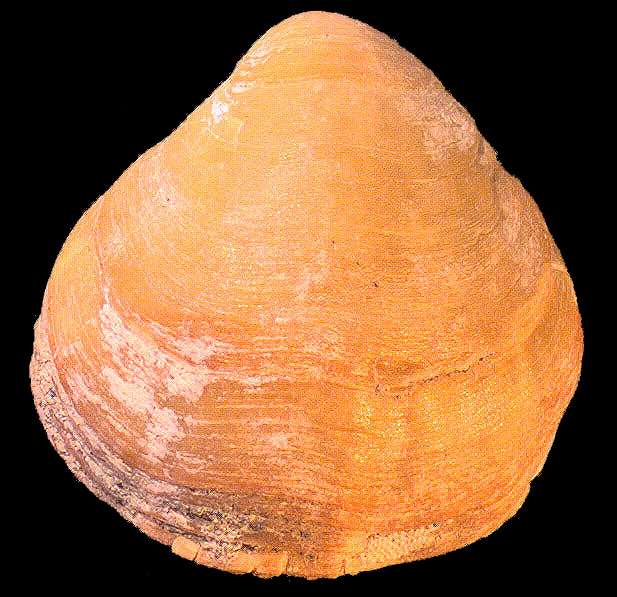
Figure 5. Ventral valve of Calloria inconspicua showing conspicuous concentric colour banding. The specimen (GLAHM 101970) is 13.3 mm long and 12.1 mm wide.
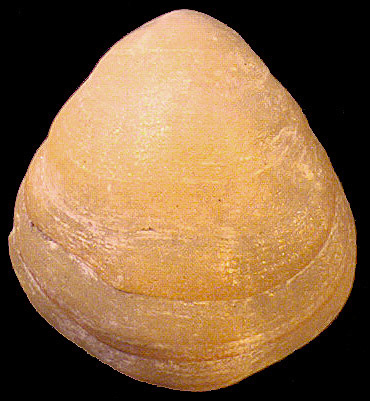
Figure 6. Complete dorsal and ventral valves of Terebratella sanguinea showing shell colouration. The specimen (GLAHM 101978) is 18.0 mm long and 18.1 mm wide.
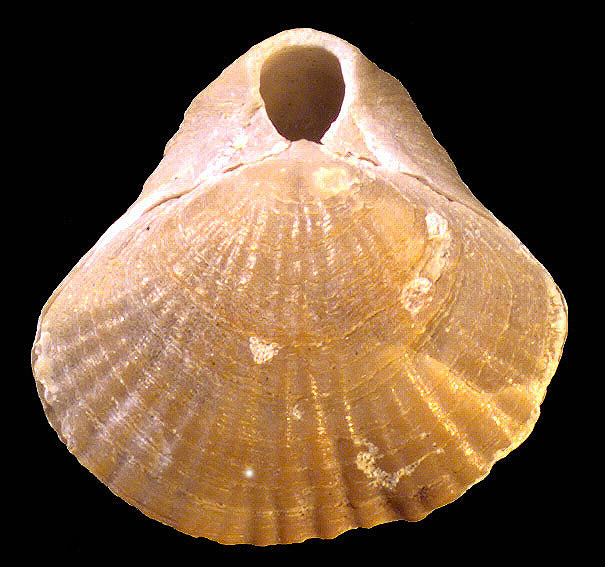
Figure 7. In situ specimen of Chalmys sp, showing preservation of original shell colouration. The scale bar is 50mm long.
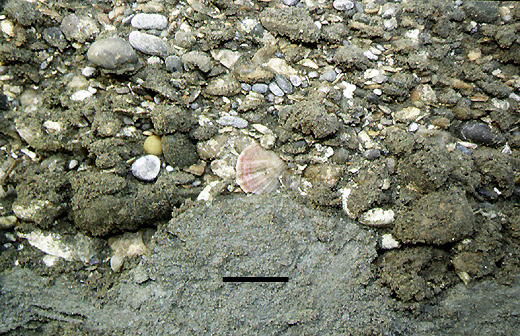
Figure 8. Pie chart showing the percentage of coloured and non-coloured fossil shells of Calloria inconspicua exposed at the sediment surface in the Wanganui Basin.
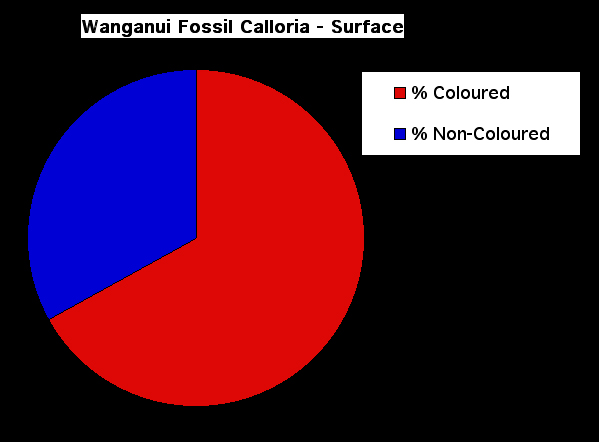
Figure 9. Pie chart showing the percentage of coloured and non-coloured fossil shells of Calloria inconspicua exposed by excavations beneath the sediment surface in the Wanganui Basin.
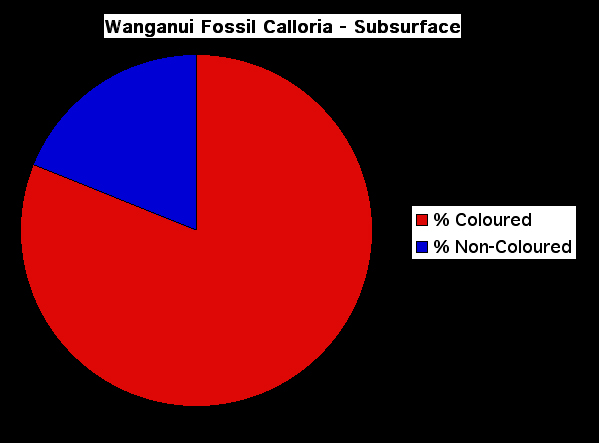
Figure 10. Comparison of the amino acid composition of the shells Recent and fossil representatives of Calloria inconspicua. The protocol for the extraction and analysis of intracrystalline amino acids from fossils is described in full in Curry et al. 1991. In this case the amino acid data were obtained in replicate following manual hydrolysis using an ABI 420H Amino Acid Analyser. Letters on the horizontal axis refer to the different amino acids (see below for key), and the data are presented in mole percentages. For most amino acids the relative proportions found in fossil shells has declined. The exceptions are Glycine and Alanine, which are more abundant in the fossil; the relative proportion of these small amino acids increases in fossils because they are formed by the breakdown of other less stable amino acids (which is common in fossils – see Curry et al. 1991).
D/N = Aspartagine/Aspartic acid, E/Q = Glutamine/Glutamic acid, S = Serine, G = Glycine, R = Arginine, T = Threonine, A = Alanine, P = Proline, Y = Tyrosine, V = Valine, I = Isoleucine, L = Leucine, F = Phenylalanine, K = Lysine.
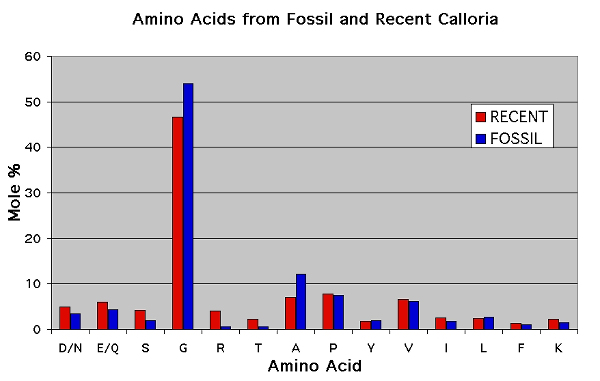
Figure 11. Pie chart showing the percentage of coloured and non-coloured Recent and sub-fossil shells of Calloria inconspicua exposed at the sediment surface in the Portobello Cave.
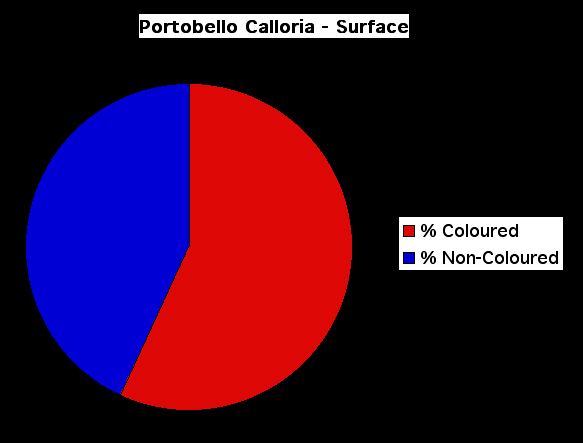
Figure 12. Pie chart showing the percentage of coloured and non-coloured Recent and sub-fossil shells of Calloria inconspicua exposed by excavation of the top 50 mm of the sediment surface in the Portobello Cave.
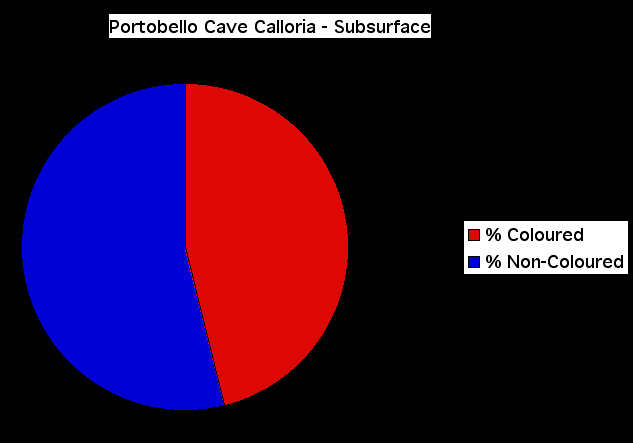
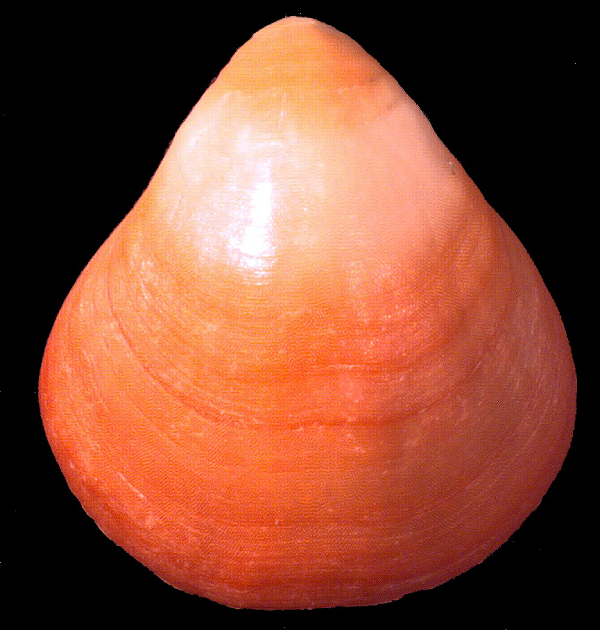
Figure 13. Recent specimen of Calloria inconspicua showing the characteristic strong red colouration. The specimen, which is 16.2 mm long and 14.1 mm wide, also shows a pale area of shell posteriorly corresponding to the early stage of growth when rates of shell deposition are greatest. Growth-lines, especially those situated anteriorly, show the strongest colouration, as in the fossil shells.