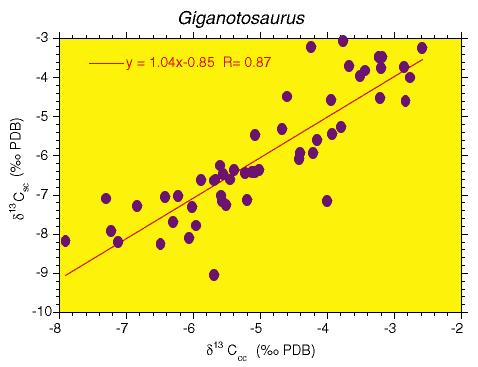
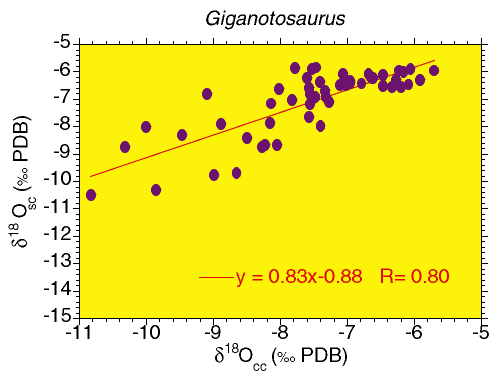
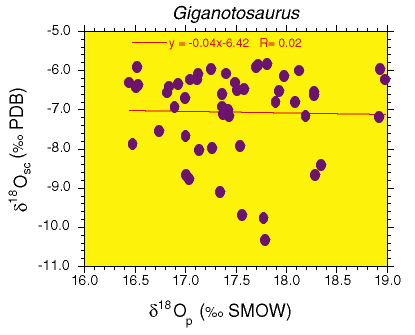
Figure 1.1-3. Carbon isotopic values of structural bone apatite carbonate (δ13Csc) vs carbon values of the calcite cements (δ13Ccc). 1.2. Oxygen isotopic values of structural bone apatite carbonate (δ18Osc) vs oxygen values of the calcite cements (δ18Occ). 1.3. Oxygen isotopic values of structural bone apatite carbonate (δ18Osc) vs oxygen values of the bone phosphate (δ18Op). Knowing the carbonate oxygen isotopic values have been diagenetically altered, the lack of covariation between the bone phosphate and carbonate indicates preservation of the phosphate signal.


Figure 2. Plot of δ18O values for each bone sampling site in Giganotosaurus. Horizontal line represents the limit of core body δ18O values to show trends of regional heterothermy.

Figure 3. Temperature differences between skeletal elements and temperature variabilities within individual bones are plotted. Mean interbone temperature differences are shown in blue. Temperatures represent degrees colder than the bone with the most negative mean isotopic value (caudal #4). Vertebrae are all within 0.6°C of each other. Intrabone temperature variability is represented in brown/tan. Bars represent the range of temperature variation within the skeletal element. Homeothermic endotherms will have less than 4°C core temperature variability and (depending upon climate) increasing variability in the limbs and shell body. The core body (represented by the cervical and dorsal centra show 2-3°C temperature variability, while the ribs, limbs and tail vertebrae show temperature variabilities of 2.5-5.8°C. Skeletal elements on the vertical axis are arranged from anterior (bottom) to posterior (top), vertebrae (blue), ribs (green), pubis (black), and limbs (red).

Figure 4. Field metabolic rate plotted vs. body size. Field metabolic regressions of Nagy (1987) for modern animals extended to dinosaurian body sizes. A hypothetical dinosaurian regression is placed midway between the eutherian and lizard regression lines. Note that the avian regression line intersects the dinosaurian regression line between 6000-8000 kg. The yellow box and red box represent the method of comparing body sizes of individuals with equivalent metabolic rates. Thus, an 8000 kg animal with an intermediate metabolic rate (yellow) would have the same metabolic requirements of a 1000 kg eutherian mammal whereas an 8000 kg reptilian ectotherm (red) would have the same metabolic requirements as a 200 kg mammal.


