

 The Cenozoic deep sea microfossil record: Explorations of the DSDP/ODP sample set using the NEPTUNE database
Article number: 2(2):a13
Copyright Paleontological Society, 22 October 1999
https://doi.org/10.26879/99013
Author biography
Plain-language and multi-lingual abstracts
PDF version
Submission: 5 April 1999. Acceptance: 7 October 1999
ABSTRACT
For 30 years the Deep Sea Drilling Project (DSDP) and the Ocean Drilling Program (ODP) have been drilling the ocean floors and retrieving sediment cores. This study presents a relational micropaleontological and stratigraphic database, Neptune, where a selection of the published studies made on these sediments is available. The selected sites and their stratigraphic extent represent a statistically reproducible subset of the whole DSDP and ODP data set as of 1995 (up to Leg 135). Cenozoic sediments from 165 globally distributed holes were dated with age/depth plots using biochronology of four marine plankton groups (diatoms, nannofossils, foraminifera, and radiolarians). Each hole’s location is available with paleogeographic coordinates. A taxonomic revision of the 8000+ reported species names was also made. The database is searchable and a variety of routines are available. Data can be exported to produce age range charts, geographic distribution maps, and occurrence charts.
A rigorous evaluation of the database potentials and limitations is presented together with a summary of the published studies that have been carried on with the data. These include stratigraphic studies (diachrony of Neogene plankton, hiati distribution in Cenozoic sediments) and evolution studies (cladogenesis and evolution of one foraminiferal lineage). Unpublished data on macroevolutionary patterns (species longevity and richness, speciation and extinction rates) are presented as example of Neptune’s potential for paleobiological research. Finally, some suggestions are presented as to how Neptune can be more fully exploited through the addition of sedimentologic and isotopic data. A variety of critical sedimentologic and paleoceanographic questions could be addressed with this extended database.
Cinzia Spencer-Cervato, Eidgenössische Technische Hochschule, Geologisches Institut, ETH Zentrum, 8092 Zurich, Switzerland. cinzia_spencer@hotmail.com
[Mailing address: P.O. Box 23, 1312 Slependen, Norway]
KEY WORDS: Cenozoic, relational database, plankton, evolution, age models, DSDP, ODP
Final citation: Spencer-Cervato, Cinzia. 1999. The Cenozoic deep sea microfossil record: Explorations of the DSDP/ODP sample set using the NEPTUNE database. Palaeontologia Electronica, 2(2):a13, https://doi.org/10.26879/99013
palaeo-electronica.org/content/2-2-neptune
Copyright: October 1999 Paleontological Society.
This is an open access article distributed under the terms of Attribution-NonCommercial-ShareAlike 4.0 International (CC BY-NC-SA 4.0), which permits users to copy and redistribute the material in any medium or format, provided it is not used for commercial purposes and the original author and source are credited, with indications if any changes are made.
creativecommons.org/licenses/by-nc-sa/4.0/
1. INTRODUCTION: THE SCOPE OF THE DATABASE AND ORIGINAL PLANNING
Last year (1998) marked the 30th anniversary of the first Deep Sea Drilling Project (DSDP) cruise and the collection of the first cores. The handful of scientists who conceived and initiated this gigantic enterprise in the early 1960s probably did not expect this international project to spur as many controversies and theories on the history of the Earth as it indeed did. At that time, Plate Tectonics, the fundamental theory that unifies most if not all of our geological (and not only geological) knowledge, was still just a controversial hypothesis accepted by only a few scientists. JOIDES (Joint Oceanographic Institute for Deep Earth Science), the program that initiated the DSDP and later the Ocean Drilling Program (ODP), deserves a lot of the credit for the collection and study of the evidence that today practically makes plate tectonics a widely accepted ‘truth’.
As a side effect of the wealth of knowledge acquired in these 30 years, scientists have produced an enormous amount of data, so large that I am not aware of any recent estimate after the one done for the first ten years of research (Revelle 1981). Up to recently, all results were first published in reports (also known as ‘blue books’). This procedure made most of the raw data available from a centralized and easily accessible printed source. In addition, JOIDES published a CD-ROM containing much of the data produced from the some 1000 holes during the progress of DSDP in electronic format. However, this multitude of data makes sense only to a limited number of scientists that have been involved in their production, and nobody has a concrete overview of what is available. Moreover, the competitiveness of the recent research climate does not encourage the re-evaluation of older data, but leads instead to the production of more new data.
With this background, a group of biostratigraphers at the ETH Zürich initiated the Neptune project in 1990. The group included some veterans from DSDP (Jean-Pierre Beckmann, Katharina von Salis Perch-Nielsen, Hans Thierstein), one participant of the more recent ODP cruises (Dave Lazarus), and some newcomers (Milena Biolzi, Jörg Bollmann, Heinz Hilbrecht, and myself). The project was funded by the Swiss National Science Foundation. The project was, in its initial stages, conceived and led by Dave Lazarus (Lazarus 1994; Lazarus et al. 1995a), while in the later, scientific analysis phase, the effort was carried out by this author (Spencer-Cervato et al. 1993, 1994; Spencer-Cervato and Thierstein 1997; Spencer-Cervato 1998).
The scope of the Neptune project was to evaluate and organize the existing DSDP and ODP data into a relational database that would be accessible to the research community. First, we planned to ‘rescue’ and compile the micropaleontological information. This information could be used first to establish an updated chronology for selected sites. The micropaleontological data themselves were then to be used for various studies of evolution. The established chronology would also be used to obtain age control on sedimentological and geochemical data.
This database would be substantially different from a mere compilation of existing data, as was assembled in the DSDP CD-ROM. The main difference would be in the ‘quality control’ of the data to be included. Suitable sites would be selected, based on criteria dictated by our experience in biostratigraphy and deep-sea drilling. We decided to limit the number of sites in the database to give preference to an accurate selection and analysis of the data available for each site. We initially planned to include some 100 holes, but this number has been substantially increased in a later phase of the project. The second innovative approach was represented by the search options. The data in the DSDP CD-ROM are not searchable, but are available as a series of gigantic tables with listings of data. As potential end users, we recognized the necessity to create links between the different data sets (e.g., by hole, by age, by geographic location, by fossil group) to optimize the research applications of the database.
In the next chapters, I will provide a description of what is in the Neptune database and how it got there. I will also discuss what we would have liked to do, and why we did not get to it. Some of the published (and in progress) applications of Neptune will be discussed in a separate chapter. I will conclude with some suggestions on possible additions and how Neptune can be used as a tool available to the research community.
2. THE CONCEPTION OF NEPTUNE AS A STEPPING STONE TOWARD THE MICROPALEONTOLOGIST'S DREAM OF THE IDEAL WORLD
2.1. Stratigraphic and geographic coverage
Marine sediments provide more or less continuous, laterally extensive and correlatable geological archives. The first choice that we made was to limit the database to deep-sea sediments, thereby excluding land sections. Hence the name given by D. Lazarus to the database: Neptune, the Roman god of the sea. The largest amount of data on deep-sea sediments come from ocean drilling, and we began our work by systematically searching through the Initial Reports of the Deep Sea Drilling Project (DSDP) and the Initial and the Proceedings of the Ocean Drilling Program, Scientific Results. Based on a variety of criteria, we rated the holes drilled by DSDP and by ODP up to Leg 135 (the latest leg available in 1995, when I expanded the database to the whole Cenozoic). Ratings were given for each fossil group separately. No rating meant that biostratigraphy was not available, a rating of ‘M’ (medium) indicated the presence of biostratigraphy limited to a few markers and often the absence of detailed range charts. A rating of ‘H’ (high) was used for detailed biostratigraphic reports with extensive range charts. Comments on core recovery, preservation, etc. were also added at this point. Given our long-range goal of using the data for a micropaleontological database, we selected to include in Neptune mainly holes that were marked as high or medium priority for more than one biostratigraphic group. Other hole selection criteria included good core recovery, relatively continuous coring, the length of the stratigraphic interval covered, as well as good microfossil preservation. The recognition of magnetostratigraphy, which could be used for further age control, was also determinant in the selection.
To date, Neptune includes stratigraphic data for the whole Cenozoic (last 65 million years). Several reports are available on Cretaceous sediments and some on Jurassic sediments. However, the K/T boundary represents a major stratigraphic boundary that marks a dramatic faunal and floral assemblage turnover. I feel, therefore, justified in the choice of limiting the coverage to the Cenozoic. At the other end of the spectrum, upper Pleistocene and Holocene sediments are not well represented in DSDP and ODP reports and, therefore, in Neptune. This is mainly due to the limited resolution of marine biostratigraphy for recent sediments, the relatively coarse sampling used in most reports and to loss of the upper few meters of sediments in early coring work.
 Final additions or changes to the list of holes were done after plotting the geographic location of the selected holes. We aimed to have a broad geographic coverage and at least one complete section for each biogeographic province (Figure 2.1). The coverage of shelf to abyssal sediments was equally considered: the range of water depths of the sediment/water interface represents a statistically representative subset of all the holes drilled by DSDP and ODP as of 1995 (Spencer-Cervato 1998). However, shallow water (shallower than 1000 m) sediments are underrepresented in the DSDP and ODP collection and are, therefore, underrepresented also in Neptune. In total, we did include 165 holes (Table 2.1). More holes would have been desirable and we have possibly excluded holes of considerable importance. This was due to time limitations and the project’s goals of creating a ‘micropaleontological database’.
2.2. Chronology
The next step consisted in establishing an internally consistent chronology for the selected holes. Because magnetostratigraphic data were available only for some of the holes, biochronology represented the best and often the only way to provide an age model for the holes. Biochronology provides a series of ‘calibrated events’ which essentially mark the first and last appearance of biostratigraphic markers (taxa). Ideally, these events have been correlated in several locations to an independent stratigraphic method, like magnetostratigraphy or oxygen isotope stratigraphy. These scales have in turn been calibrated to absolute chronology in millions of years through complex procedures. The magnetostratigraphic scale used initially for Neptune was Berggren et al. (1985). We subsequently updated our chronology to Berggren et al. (1995b), which is based on Cande and Kent’s magnetostratigraphy (1992, 1995). Berggren et al.’s chronology was chosen because it is the most updated and most comprehensive time scale published to date - it includes biochronological data for several hundred Cenozoic events. Oxygen isotope stratigraphy (in turn calibrated to a magnetostratigraphic scale) was used for only a few of the calibrated events used in Neptune.
Through this two-step approach, numerical ages in million of years (Ma) are given to biostratigraphic events. We assumed that these events are geologically instantaneous and occur simultaneously throughout a given region of the globe (i.e., are globally synchronous and at least regionally widespread, and not dependent on local environment or sediment facies). Berggren et al. (1985) and its recent updates (Berggren et al., 1995a, b) were the source of biochronological events for planktic foraminifera and calcareous nannoplankton. Various regional calibrations were used for siliceous plankton (for radiolarians: Hays and Opdyke 1967; Hays 1970; Theyer et al. 1978; Johnson and Nigrini 1985; Sanfilippo et al. 1985; Goll and Bjørklund 1989; Nigrini 1991; Harwood et al. 1992; Caulet 1991; for diatoms: Barron 1981, 1985a, b; Berggren et al. 1985; Fenner 1984; Koizumi and Tanimura 1985; Gersonde and Burckle 1990; Mikkelsen 1990; and Harwood and Maruyama 1992). Paleogene siliceous plankton biochronology is less well established than the one for the Neogene, so most of the events used were biozonation boundary markers.
Published biochronological events were used to construct the chronology of each hole. Templates were assembled with all the events that we found in the cited references (Table 2.2). These templates (ASCII files to be used in MS Excel) contained the description of the event, an identification code, and the age interval of the calibration. An excerpt from one of these files is shown in Table 2.3.
2.3. Taxonomy
The articles published in the DSDP and ODP reports are an immense source of evolutionary and biostratigraphic data. Although we were aware of many discrepancies in the subjective nature of taxa and taxonomic names (e.g., Gradstein et al. 1985), we assumed that these factors would be manageable by use of simple synonymy lists in our study. A very extensive taxonomic literature is available for marine plankton, and taxa and nomenclature are quite well defined among the most common microfossil groups. This can be used to reasonably standardize taxonomic usage. Thus if taxon Ab is called Ab by one author but Bb by another, we could standardize the data by creating an equivalence Bb = Ab in the database. Moreover, the holes that we selected had been extensively studied for biostratigraphy and some of them represented classical micropaleontological studies. We, however, had to assume that taxon names in all the selected holes were uniformly used, in other words, that taxon Ab described in Hole 289 was identical to taxon Ab described in Hole 747A. More than 8800 taxon names have been used in the selected holes.
2.4. Biostratigraphy
Most micropaleontological studies are limited to one or perhaps two fossil groups. Biostratigraphic studies in DSDP and ODP reports include diatoms, radiolarians, calcareous nannoplankton, planktic and benthic foraminifera, dinoflagellates, silicoflagellates. We decided to consider only planktic organisms and out of the several groups described in the Reports, we selected the four groups that are most abundant in deep-sea sediments, most regularly described in the biostratigraphic literature, and for which extensive event calibration is available: diatoms, radiolarians, calcareous nannoplankton and planktic foraminifera. This selection includes two siliceous (diatoms and radiolarians) and two calcareous (nannoplankton and foraminifera) plankton groups, and at the same time two phytoplankton (diatoms and nannoplankton) and two zooplankton (radiolarians and foraminifera) groups. This approach has several advantages: it would allow us to compare evolutionary trends in multiple groups, but mainly it allowed us to have a better biochronological control on the age models. Planktic foraminifera are probably the most used microfossils for biostratigraphy, and with this approach we were able to compare their resolution and accuracy to the other groups.
The templates were filled in with actual occurrences of the events for each hole. We went through the published range charts or lists of markers and located the events present in the templates. The list of references to the individual reports is given in Table 2.4. Each event was normally recorded as occurring between two samples within the stratigraphic section. Samples were either recorded as meters below seafloor (mbsf) or as actual sample names, in core-section-interval within section in centimeter format. The sample names were then automatically translated into mbsf by the plotting software. No systematic attempt was made to search the general literature for additional stratigraphic data, although biostratigraphic data for some critical holes (e.g., DSDP 558 and 563) were extracted from charts published outside the DSDP reports. The creation of biostratigraphic files from the templates was initially subdivided among the project participants. In the later phase of the project, I was solely responsible for this task. This eliminated some of the discrepancies in the event identification due to subjective interpretations of range charts in terms of First Occurrence (FO) and Last Occurrence (LO).
The first and last occurrence of a taxon were identified when the taxon was not recorded in two or more samples above or below the first or last recorded occurrence. Because the precision of the actual FO or LO depends on the sample spacing, we recorded each event as the stratigraphic interval between the two samples bracketing the event.
Paleomagnetic stratigraphy was recorded as a set of paleomagnetic polarity interval identifications, as given by the original author. In some cases, it became necessary to revise the original identification scheme to achieve an optimal fit between biostratigraphy and paleomagnetic polarity patterns. However, this was usually apparent only when the events were plotted.
The biostratigraphic files prepared for each group were pasted together and used in the construction of age models. There is a varietyare several of methods available to process stratigraphic event data, including Shaw’s plots (Shaw 1964) and Probabilistic Stratigraphy (Hay 1972). However, the most used method of stratigraphic correlation for deep-sea sediments is the age vs. depth plot method. A plot is made of the depth occurrences of previously age-calibrated events in each hole and a line is drawn to correlate depth to age. Although various curve-fitting methods can be used, we have chosen to manually fit a series of straight line segments of varying slopes to the data.
To handle the large volume of data plotting and analysis we used a special-purpose, age-depth plotting program written by Lazarus (1992). The program, written for Macintosh computers, reads the stratigraphic data files and produces an age- vs. versus-depth scatter plot of the data points. The program allows us to draw a line of correlation through the points interactively on the computer screen. Automatic correlation methods were attempted but proven unreliable because they were too easily affected by data outliersdata outliers too easily affected them. The manual construction of the line of correlation allows us to take into consideration recovery gaps and changes in preservation or lithology that may affect the reliability of the age vs. depth plot. The age models are thus subjective and, with a few exceptions, the scatter of data allows for two or more possible interpretations. The use of two or more biostratigraphic groups was intended to minimize the bias introduced by an a priori selection of ‘good’ or ‘bad’ events.
Age models were initially constructed by several project participants. To eliminate discrepancies in the selection of the line of correlation due to subjective preferences, all Neogene DSDP age models were subsequently revised by Dave Lazarus (Lazarus et al. 1995a) and later by myself (after the addition of Paleogene data and ODP holes, and the update of the chronology). A personal rating of the quality of the age models is given in Table 2.1. Although the results of all these efforts still do not guarantee that the age models are optimally reliable, I hope that they represent a far more consistent and updated data set than available prior to the beginning of the project.
The established chronology provided age control on the 30,000 samples described in the DSDP and ODP reports for the selected holes. Information on the micropaleontological content of these samples is available as range charts. These charts give information on the presence or absence of a taxon, and usually describe its abundance. Properly formatted MS Excel range charts were either extracted from the DSDP CD-ROM by the Neptune database program, typed by us, or provided directly from ODP (Table 2.4). These were then imported into Neptune and represent the bulk of data available. We planned to use this information for various studies (species occurrence patterns, longevity and diversity, identification of temporal distribution of biogeographic provinces) which are described in Chapter 4.
The age/depth plots and the age models (text files) are given in the Appendix A. The stratigraphic data files used to construct the age vs. depth plots, are not published here because of space considerations and the complexity of having such a large number of files and links. They are, however, available from the author.
3. The Realisaion of NEPTUNE - The Real World is Worse Than We Thought
3.1. Stratigraphic and geographic coverage
The geographic distribution of the 165 holes included in Neptune is uneven. In some areas there is a very detailed coverage, like for example in some parts of the Antarctic Ocean (Figure 2.1). On the other hand, no holes from the central north and southeastern Pacific Ocean are present in Neptune. (Holes from ODP Leg 145 now provide a transect across the north Pacific.) The mid- and high latitudes in the southern hemisphere and the tropical regions of the Atlantic Ocean are also not well represented. This is due in part to the uneven coverage of DSDP and ODP cruises and in part to the selection made for Neptune, which preferentially included holes with good biostratigraphy.
Each year, ODP organizes five to six drilling cruises which result in as many published Scientific Results. Although not all cruises retrieve micropaleontologically significant material, many of them provide a detailed biostratigraphy and data relevant to the scopes of Neptune. The present geographic coverage of holes in Neptune has been last updated in 1995 (Leg 135). Since then more than twenty-five volumes of Scientific Results have been published. From the beginning of the project, we were faced with the need to maintain a balance between keeping up with the new data produced by ODP and the need to analyze the data already in Neptune for biostratigraphic or micropaleontological studies. At present, I have decided to keep Neptune at its current, acceptable but not optimal, size in order to complete some of the studies that we had planned. If it will be decided to update Neptune in the future, it will be necessary to:
- select suitable holes from Leg 136 onward, and for the selected holes:
- compile biostratigraphic files and construct age models;
- import the core depth file and the age model file for each hole;
- download from ODP the available range charts;
- format the range chart files to make them compatible with Neptune;
- import the range chart file;
- update the species name list with the new names eventually present in the range charts.
 Another limitation of the database is given by the often incomplete often-incomplete recovery of sediments (Figure 3.1). Before the advent of hydraulic piston coring, few continuously recovered sections were available. Core recovery has drastically improved in the more recent ODP holes but sediment loss at core breaks is still common even in continuously cored sections (Farrell and Janecek 1991).
In addition, there is an uneven distribution in the temporal coverage of the sections. Whilst Plio-Pleistocene sections are very well represented in Neptune (as they are in ODP holes overall), the detail of stratigraphic coverage decreases for older time periods, as naturally expected from the drilling procedure (Figure 3.2, Spencer-Cervato 1998). This might be interpreted as a need to recover more Miocene and older sections, but this pattern actually reflects the number of studied sections and not simply the recovered sections.  Therefore, I believe that the problem does not lie only in the ‘quantity’ of older sections drilled, but also in the ‘quality’ of their stratigraphy. The reliability of the stratigraphy provided for a section depends strongly on the availability of good calibrations, and these are currently available mainly for Neogene sediments. Figure 3.2 also shows that the number of well-studied sections does not decrease gradually and regularly with age, but shows peaks (around 2 Ma) and plateaus (e.g., between 20 and 32 Ma). This likely reflects the relative, unequal attention given to the Cenozoic stratigraphy through the history of DSDP and ODP.
3.2. Chronology
For the database, we have chosen to use a comprehensive biochronology based on deep-sea sections, therefore not considering land sections, which represent the type localities where stratigraphic series were first described. This may represent a limitation in the achieved biochronological calibration. The precision of the ages determined with the age models depends on various factors, some subjective and nonquantifiable, and some, like sample spacing, accuracy of biostratigraphic calibration, or core recovery, that can be quantified. A conservative estimate of the age model precision of 0.36 m.y. was determined for Neogene sediments (Spencer-Cervato et al. 1994). For Paleogene sediments it is about 0.66 m.y. (twice the average sample spacing).
Another important factor is the quality of the age model. The Neogene DSDP age/depth plots that we have published so far (Spencer-Cervato et al. 1993; Lazarus et al. 1995a) are a good example of the range of reliability of the line of correlation. The subjective ranking given in Table 2.2 varies from very poor or poor (wide scatter of events, straight line of correlation drawn across the middle of the cloud), to moderate (some scatter of a limited number of events, various possible lines of correlation), to good or excellent (40% of the holes: very good agreement of the event ages, abundant events to constrain the line of correlation, good agreement between magnetostratigraphy and biostratigraphy). Several factors can cause the scatter of events observed in most age/depth plots: reworking, downhole contamination, incorrect entry in the biostratigraphy file, typos in the range charts, diachrony of the calibrated event, , and sample spacing. Whilst most of these causes can be easily double-checked, diachrony is quite difficult to assess. The assumption of ‘globally synchronous events’ which is at the base of biochronology is validly established only for some selected, well documented events (e.g., Hays and Shackleton 1976; Thierstein et al. 1977; Backman and Shackleton 1983; Wei 1993; Spencer-Cervato et al. 1994). It is likely that more complete data collection and documentation would lead to the identification of more globally synchronous events. But in most cases, a calibration is valid only for the more or less restricted biogeographic province where it is done, and only a few events are truly globally synchronous, within the precision of the method adopted for calibration. The need for localized calibrations has long been known for siliceous plankton stratigraphy, but it is not widely accepted by biostratigraphers using calcareous plankton. To minimize this factor, we intentionally used multiple regional calibrations for diatoms and radiolarians. Even with this approach, the scatter is sometimes too large to provide a reliable line of correlation. For nannofossils and foraminifera only one general (low latitude) calibration is available (Berggren et al. 1985, 1995a, b). The advantage of this calibration is that it is based on several sites, while most of the regional calibrations are based only on one hole. An estimate of the diachrony/synchrony of Neogene events was done with a subset of the holes currently present in Neptune (Spencer-Cervato et al. 1994). This study indicated that calcareous nannofossils provide the most reliable biostratigraphic events, as they are mostly cosmopolitan and, if diachronous, the age margin is relatively small.
 Very few sections are actually continuous, and long stratigraphic gaps are common (Spencer-Cervato 1998) (Figure 3.3). Two-thirds of the selected holes contain at least one hiatus, and on average they each contain three hiati of various lengths (Figure 2.1). The presence of these hiati results in artificially older or younger ages for the samples adjacent to the gap. This does not allow one to automatically (‘blindly’) search the database for e.g.,such information as species ages, but requires that every output is be checked and compared with the age models.
The final and probably most necessary improvement of the chronology of Neptune is given by the life-timelifetime of the biochronology selected for the age model calibration. We initially based the age models on Berggren et al. (1985). An updated magnetostratigraphy was published later (Cande and Kent 1992) but it did not provide the combination of biochronology and magnetostratigraphy available from Berggren et al.'s (1985) work. We thus decided to continue using Berggren et al. (1985) throughout the first phase of the project (DSDP Neogene sediments). However, ten years after the first biochronology compilation, a new updated biochronology was published (Berggren et al. 1995b) and the chronology of Neptune became suddenly outdated. The iterations to update Neptune’s chronology were greatly helped by additional programming of Neptune by Dave Lazarus and an auxiliary computer program (not part of Neptune and written ad hoc by Bernhard Brabec) which created a correlation function between the old and the new master biochronology. This function was applied to all age model files and new revised age models were created. . Then, all biostratigraphy files were updated using a ‘find - replace’ routine with lookup tables (i.e.: if code in column 3 is equal to xYwz, replace age in column 4 with corresponding value in lookup table). While we could directly use the new calibrations for calcareous plankton as lookup tables, it was necessary to recalibrate to the new time scale all regional templates used for siliceous plankton events. Finally, before the new age models could be imported into Neptune, all the age/depth plots were redone by myself and eventually adjusted to fit the new event ages.
3.3. Taxonomy
Among the other reasons mentioned above, if a bio-event recorded in a specific hole plots far outside the area where the line of correlation can be drawn, it could be due to its taxonomic identification. Many authors have put together the hundreds of range charts that were used for Neptune and not all agree in the detailed taxonomic identification of all the 8800+ taxa included in Neptune. Indeed, taxonomic identification is subjective. The time pressure under which biostratigraphers are during a leg is also an important limiting factor in the number of species described in a range chart, which is often limited to biostratigraphic markers. The extent to which this taxonomic problem has affected the data in Neptune can be judged by experts in particular cases but cannot be easily quantified.
Starting from the biostratigraphy filesbiostratigraphic records assembled for the chronology, we assumed that the taxon associated with one event and described in the range chart was the one we were looking for. Further, we needed to consider the occurrence of synonyms. It sometimes happens that the name used by one author for a taxon corresponds either to a different taxon according to another author, or that a different name is used by a second author for this specific taxon (synonymy). For example, the foraminifer species Globorotalia truncatulinoides has been also called Truncorotalia truncatulinoides. To account for this, we have used the literature, personal experience and extensive consultation with taxonomic experts to identify valid taxon names.  Three thousand of the 8810 names listed in Neptune (Figure 3.4) are considered valid (i.e., are legal names in the framework of the ICZN and ICBN, and are known to be real to at least one of the experts). Synonyms to these valid names were then identified (with the corresponding valid name). They constitute 31% of the total number of names. In several cases we could not unequivocally identify a specific name and marked it as ‘unknown’ (15% of all names). Only 43 names (0.5%) were considered invalid. This information is available in the ‘Species Names’ table of Neptune. The synonymizsation is subjective (the initials of the person who identified each species name is also given in the ‘Species Names’ table) and the names list does not at all pretend to be a thorough or complete taxonomic revision of marine plankton. It merely represents a working table that gives us a first approximation of plankton taxonomy. A ‘real’ taxonomic database would need complete taxonomic descriptions (with history) for each taxon and a series of images to illustrate them. Cathy Nigrini, Jean-Pierre Caulet, and Dave Lazarus are currently working on a detailed taxonomic database for radiolarians, but it is well beyond the scopes of Neptune to even attempt anything like this for all groups.The taxonomic list also needs continuous update: every time a new hole is added to Neptune, the biostratigraphic range charts carry with them new names, sometimes several ones. These need to be added to the ‘Species Names’ list and identified as valid or not.
3.4. Biostratigraphy
There is an uneven distribution in the number of reports by plankton group in Neptune. Over 60% of the 225 articles from which data for Neptune have been extracted (Table 2.4) are on calcareous plankton, almost equally distributed between nannofossils and foraminifera.  Radiolarians follow with about 21% and diatoms trail with only 16%. At the same time, biostratigraphic work on siliceous plankton is underrepresented in Paleogene sections, and most often limited to the Oligocene and younger sections (Figure 3.5). This unevenness represents a bias for evolution studies where we would like to compare calcareous and siliceous plankton occurrences. Whether this distribution represents the average abundance of fossil plankton in deep-sea deposits or is instead the reflection of staffing decisions by DSDP and ODP is yet to be determined.
One of the limitations of Neptune as a comprehensive micropaleontological database is given by our decision to include only four plankton groups. The DSDP and ODP Reports include many articles on benthic foraminifera, silicoflagellates, dinoflagellates as well as palynology. At the moment, there are no plans to include their occurrence data in the database, which in itself would not be a huge task.
4. RESEARCH PROJECTS CARRIED OUT WITH NEPTUNE, WHAT THEY TOLD US, AND RECOMMENDATIONS FOR THE FUTURE
4.1. The database structure and search capabilities: a tool to find out what we do or don’t know
 The Neptune database currently provides rapid retrieval of age information on 165 DSDP and ODP holes; taxonomically corrected species lists and other taxonomic information for calcareous nannofossils, planktic foraminifera, diatoms and radiolarians for the entire Cenozoic; paleogeographic location of the 165 holes (paleolatitude and paleolongitude); extensive distributional data for these fossil groups (e.g., biogeographic occurrence information, computerized microfossil range charts) (Figure 4.1). The design and implementation of the database software have been described in Lazarus (1994) and in an unpublished guide (Lazarus, personal commun., 1996). These will be used for this description, with the updates of the data tables based on the present status of the database (after the most recent upgrade).
4.1.1. Overview of database structure. Neptune is designed as a relational database. Macintosh computers and 4th Dimension™ database software (4D) are used to run the database (Lazarus 1994). The database is implemented as several relational tables that contain (as of February 1998) close to 500,000 records.
Import procedures for range chart data as well as search procedures are available. The search procedures can locate all reported occurrences of any taxon or combination of taxa, automatically identifying occurrences recorded under synonymous names. Searches can also be used to locate other relevant information, such as general hole information, sample age, species occurrences, etc. Commercial mapping software (e.g., Atlas™) is used to plot locations of species occurrences, using a Neptune-generated plotting data file with latitude and longitude. A ‘composite age range chart’ program can also be used with an appropriately formatted file generated by a Neptune search (Lazarus 1994).
 Neptune was created as a relational database where the data are separated into simple tables, with relational links between the tables. The structure of the database is shown in Figure 4.2. Five data tables hold the primary data: stratigraphic occurrence data for taxa (‘Bug Data’ table); taxonomic data on species’ names (‘Taxonomy’); biogeographic data on species’ occurrences (‘Taxa by Hole’); geologic age information (‘Age Models’); and paleogeographic information (‘Geographic Info’). Paleo-water depths are available for selected samples and have been published (Spencer-Cervato 1998). As this information is not available for all samples, it is not currently included in Neptune.
The database maintains a strict separation between the primary observational data (occurrences of named taxa at specific depths in holes) and the interpreted meaning of the data (i.e., the species to which the name belongs - ‘Taxonomy’ - or the age of the section at a specific depth - ‘Age Models’). These tables can be in fact modified repeatedly, but the observations remain constant (Lazarus 1994).
The stratigraphic occurrence data form the core of the database (over 380,000 records of ‘Bug Data’). A typical range chart is decomposed into a minimum of one species occurrence in one sample. Further data separation is achieved by putting all information about samples and species into separate tables (‘Sample Data’ and ‘Taxonomy’). Samples and species are represented in the ‘Bug Data’ table only by internal codes, linked to the more detailed records in other tables.
4.1.1.1. Species names (‘Taxonomy’ table). All names in the database are identified by a separate entry in this table. Each occurrence, including misspellings and questionable names (e.g., A. deflandrei?), is given as a separate entry. Each is identified by up to three words (genus, species, subspecies or qualifier). The qualifier is generally used to identify questionable entries, marked with the letter ‘Q’. Each entry is uniquely identified by a ‘Taxon code’, a combination of nine characters originally given by DSDP. This code is central to the functioning of the database, as it provides links to the other tables. The first five characters are letters, all upper case. The first letter identifies the fossil group (D for Diatoms, N for Nannofossils, etc.). The next four letters are characteristic of the genus. The last four characters are numbers and give the species number in the genus. DSDP started with 0010 and incremented by units of 10 for each new species name. ODP does not use codes to identify species names. Thus, we created new codes for new species names that occur in ODP range charts. To avoid any overlap, we have used the same 5 letters to identify the group and the genus, but started with 5010 to number the new species (DSDP never had numbers higher than 2500).
Every entry has other information attached to it. The Status (or validity) field is a single uppercase letter which states that the name is V-alid, a S-ynonym to another name (with corresponding taxon code entered in the ‘synonymous to’ field), I-nvalid, Q-uestionable, or U-nknown. A G is used to indicate a genus-level name. Every name has also an author code (initials of person responsible for the entries in the Status field) and a date (mm/dd/yy). Comments of any length are also entered in the ‘Comments’ field.
Additional species’ records are available in the ‘Species by Hole’ table which comes directly from the DSDP data set. The current table, reformatted from the original data set to save space, contains simply a Taxon Code and a Hole field.
4.1.1.2. Age Models and Hole summary data (‘Age Models’ and ‘Hole Data’ tables). The ‘Age Models’ table contains the age model developed for each hole with range chart available in the database. The age model was constructed by a broken line composed of straight segments, which can be horizontal in the case of hiati. The extremes of the segments are identified by age and depth and entered in the corresponding field, next to the ‘Hole’ field. To keep track of which age model is being used in the database, each age model’s time of creation date stamp is entered automatically in the ‘Hole Data’ table (‘Age model version’). This latter table contains a variety of information, including latitude and longitude, water depth, ocean basin, hole length and recovery, etc. Holes that have an age model (and therefore range chart data) have an entry in the ‘Age Model version’ field and a ranking for each fossil group (originally used to select holes).
4.1.1.3. Sample Info (‘Sample Data’ table). Most of the fields in this table are created directly from computer files or by Neptune. Each sample described in each range chart is identified by a unique digital code and is specific for one fossil group. This means that, if in one sample (identified as depth in a hole (mbsf), but also in three separate fields as core-section-depth interval format - grouped in Figure 4.2 under ‘Sample Name’) both diatoms and radiolarians (‘Taxonomic Group’ field) were described, this sample would be described twice in Neptune, each time with a different ‘Sample Code’. The age of the sample is derived from the ‘Age Model’ table through a relational link. If available, information on the preservation and abundance of the specific fossil group in that sample is also given.
4.1.1.4. Paleogeographic data (‘Geographic Info’ table). With the addition of Paleogene range charts, I considered it necessary to locate species occurrences in their appropriate paleogeographic position. For this purpose, I used a PC-based program kindly provided by Alan Smith (Cambridge University) which uses finite rotations. The program is based on published reconstruction data (Euler rotations and their ages) used to move a given site relative to Africa and then reposition that site in paleomagnetic coordinates (Smith, personal commun., 1997). The input file contained present latitude and longitude: paleolatitudes and paleolongitudes were determined for each hole at 5 m.y. intervals. This approximation was necessary to simplify the entry of these data into Neptune, but I believe that it does not significantly affect the already approximated estimate of paleolatitude and paleolongitude made by the finite rotations program. These paleogeographic data, with hole and age, were imported into a separate table (‘Geographic Info’) and the Sample Code used to link it to other tables.
4.1.2. Importing data into Neptune (range charts and age models). Data can be imported into Neptune by the ‘administrator’ (this function is not available in the ‘user’ mode or with the runtime version of 4D). Most of the DSDP range charts were imported directly from the DSDP CD-ROM data, but ODP data need to be imported as individual spreadsheet format files. Each procedure creates automatically new sample records for each sample in the range chart data (‘Sample Data’) and new ‘Bug Data’ records for each non blank cell of occurrence data in the range chart. No ages are assigned in this procedure and all sample ages are set at zero. Only when the age model is imported, a corresponding age is recorded in the age field of the ‘Sample Data’.
Each range chart file needs to hold data for one hole and one fossil group only. Each sample must be entered in one row in a ‘leg-hole-core-section-first depth-second depth’ format (e.g., 113-689-B-2H-1-115-116). These data are automatically entered in the corresponding fields in the ‘Sample Data’ table. The depth in mbsf is derived from the ‘Core Data’ table, where the core depth files for each hole are imported as soon as a hole is selected. Species names must be entered as Species Codes (9 characters, e.g., DACTI0020). Every species code present in the spreadsheet must be already available in the ‘Taxonomy’ table. The ‘import from spreadsheet’ procedure in Neptune automatically checks each DSDP Code in the spreadsheet and if it encounters a code that is not present in the ‘Taxonomy’ table, the procedure aborts.
Age information is present in Neptune in two forms. The ‘Age Model’ table actually holds all the line of correlations (age models) for each hole. Age for samples are calculated from the line of correlations and stored as calculated fields in the ‘Sample Data’ table. This calculation is done only once, when the age model is read into the database, and is automatic. Only one age model can be imported at a time. To update an existing age model, it is sufficient to read in the new file and the old ages will be automatically replaced by ages based on the new line of correlation.
4.1.3. Report capabilities and external graphics. Data can be extracted from the database in a variety of ways. The results can be then saved as export files, that can eventually be used with other programs. Procedures that search for taxa, in either the ‘Bug Data’ table of stratigraphic occurrence information, or in the ‘Taxa by Hole’ table of biogeographic information, create lists of Taxon Codes (from ‘Taxonomy’) to search for. These lists include the taxonomic name/s requested by the user, but are supplemented by lists of synonyms to these names. Users can edit these lists to fine-tune searches.
 In addition to export formats for statistics and spreadsheet packages (usually in ASCII format), the database exports data in formats specific for two types of graphic data display. Data on the location of specific DSDP/ODP sites can be plotted in a map form using Atlas™ (WTC Scientific). The most recent version of this program for Macintosh computers does not run reliably on PowerPCs and the use of the PC IBM-compatible version (which can use the same cross-platform file) is recommended. A custom application creates graphic displays of occurrence data for taxa, plotted by age and hole (‘Age Range Charts’, Lazarus 1994) (Figure 4.3).
 4.1.4. Searching the database. The simplest way to search Neptune is by using the built-in 4D ‘Search Editor’ (under the ‘Select’ menu). Any of the tables previously described (Species Names, Hole Info etc.) can be selected from the list in the small window that automatically appears when Neptune is started. This shows a window with all the records in that table. The ‘Search Editor’ function displays a dialogue window which shows the fields available in the table. Only fields in bold can be selected and additional search criteria (equal to, contains, less than etc.) added. The results of the search are displayed in a few seconds (Figure 4.4).
 More complex procedures, such as a ‘Bug Data’ search, allow to locate range chart data about one or more taxa. These predetermined procedures can be selected with the ‘Execute Procedure’ function under the ‘Special’ menu (Figure 4.5). The ‘Bug Data Search’ procedure first shows a search editor window for ‘Species Names’ and waits for a taxon entry. This can be formulated as ‘Species - is equal to - name’ or done directly with DSDP codes (Figure 4.6). This procedure locates all taxa matching the entered criteria, as well as other taxa identified in the database as synonyms for any of these. The user can then select one or all of the identified taxon names and click the ‘done’ button at the bottom of the window (Figure 4.7). The procedure then searches the ‘Bug Data’ table to locate all records for this list of taxa. This search is done using indices, and only takes a few seconds (Figure 4.8).
  The procedure informs the user via a dialogue box how many records have been found, and then presents the search editor window a second time. At this point the user can enter any other criteria, such as only samples with ages greater than 0 (i.e., holes with age models), or from holes from a specific geographic location (Figure 4.9). The 'search in selection' box (lower left corner) is automatically marked allowing to search only among the already identified occurrences (and not the whole database!). The user should then click 'ok' to proceed. The procedure will refine the selection according to these secondary criteria, and present the user with a list (Figure 4.10). This list can also be edited to refine the selection. Lastly, the user clicks 'done' to exit the procedure. The selected records can then be printed, exported to disc, or summarized in a report.
 A search procedure is also available to the automatic search for the ages of all samples recording several taxa given in a list (and their synonyms). This ‘Batch Search’ (‘BugDataSearchBat’) allows for the automatic operation of the series of procedures described above (Species name selection, identification of synonyms, bug data search, restriction to holes with age models, sorting of samples by age). It produces one separate output file for each name, as well as a cumulative file. This procedure was used to obtain species longevity data (described below). Alternatively, samples can be sorted by latitude and longitude to obtain ranges of geographic distribution of taxa through time (e.g., to identify cosmopolitan or endemic taxa).
4.2. Paleontological research based on Neptune: plankton evolution
 In this and in the next section (Figure 4.3), I am presenting a summary of published paleontological and stratigraphic research conducted with Neptune, as well as some unpublished data on macroevolution. Neptune’s potential for paleontological research has been, so far, only marginally exploited. In spite of the limitations outlined in Chapter 3, the database provides the opportunity for large-scale macroevolutionary studies that could go well beyond presently available studies (e.g., Jablonski 1993; Kammer et al. 1997). The age control and time resolution, combined with the taxonomic information at species level on four distinct plankton groups, make Neptune a high quality data set.
Currently, the two studies we published on evolution were focused on the evolution of one foraminifer species and were based on Plio-Pleistocene sediments, which are represented in a large number of holes in Neptune (Lazarus et al. 1995b; Spencer-Cervato and Thierstein 1997).  The goal of these studies was to document patterns of evolution of a new species (the planktic foraminifer, Globorotalia truncatulinoides) from its ancestors and to identify speciation and migration in distinct biogeographic provinces by using the tests’ morphometry. In addition, we attempted to determine the environmental conditions (water depth, thermal structure of water column) at the time of speciation or immigration with stable isotope geochemistry. Whether changes in these environmental conditions were a determinant factor in the speciation or migration, even after these detailed studies, remains still speculative.
For these studies, Neptune was used in the selection of sites by identifying the occurrences by hole and FADs/LADs (first appearance datum/last appearance datum) of the species and its ancestors. An age range chart was produced from the search for all G. truncatulinoides and related species occurrences (Figure 4.3).  This was used to identify the oldest first occurrences and to have an overview of the age distribution, which shows a distinct diachrony (Figure 4.11). This search lead to the selection of suitable DSDP and ODP sites from which samples were requested. The samples were then analyzed morphometrically and isotopically to determine patterns of evolution (in this case, cladogenesis or phylogenetic branching) and species migration (Lazarus et al. 1995b; Spencer-Cervato and Thierstein 1997).
The earliest first occurrences are found in several sites in the southwest Pacific. Gradual cladogenesis was documented in this region during the late Pliocene in sympatric or parapatric populations (Lazarus et al. 1995b). Based on qualitative observations, similar but younger, gradual transitions had been reported from other areas of the world’s oceans. Therefore, the hypothesis arose that this gradual evolutionary branching might have occurred in response to changing environments at different times in different ocean areas. To evaluate this hypothesis, we studied the morphological transitions of the three taxa, using image analytical techniques, in several deep-sea sections from various areas, identified with Neptune (Spencer-Cervato and Thierstein 1997). The morphometric analyses showed that G. truncatulinoides evolved between 2.8-2.3 Ma sympatrically in large populations from its ancestor G. crassaformis in the southwest Pacific. Differentiated morphotypes of G. truncatulinoides subsequently immigrated into the Indian and Atlantic Oceans between 2.3 and 1.9 Ma. Our morphometric data show these younger appearances outside the southwest Pacific to be punctuated, and representing migration events (Spencer-Cervato and Thierstein 1997).
One of the most crucial, yet elusive issues in evolution is the role played by the environment in the appearance of a new species or its extinction. Planktic foraminifera are ideally suited for these studies because of the large populations, widespread occurrence of tests in marine sediments, relatively large size that allows for detailed identification with traditional microscopic techniques, abundance of information on living populations and their habitats, conceivably rapid colonization of biogeographic provinces under suitable conditions, and the possibility to reconstruct these conditions (e.g., water depth, temperature, nutrients) with stable isotope geochemistry.
Globorotalia truncatulinoides is an ideal species for the study of the environmental conditions at the time of speciation. We hypothesized that the global cooling of surface waters, coinciding with the northern hemisphere glaciation, led to the formation of oceanographic barriers that could have retarded the expansion of G. truncatulinoides up to 2.3 Ma. At this time, a relative warming and subsequent transgression could have spurred the migration from the southwest Pacific into the Indian Ocean, possibly through the Indonesian passage. A direct link between the speciation and surface water changes linked to the northern hemisphere glaciation has not been proven so far and seems unlikely. In fact, stable isotope data in G. truncatulinoides and its ancestors indicate that the three species’ depth habitat preferences remained unchanged through the speciation and migration of G. truncatulinoides and that all three species were dominantly deep-dwellers, in agreement with their present environmental preferences (Spencer-Cervato and Thierstein 1997).
One of the original goals of the Neptune project was to perform macroevolutionary studies. Macroevolution is a major area of paleontology that developed during the 1970s and 1980s, inspired by the apparent success of the taxic approach to evolutionary patterns (Smith 1994). Macroevolution covers various concepts and processes. These studies differ from the previously described, ‘microevolutionary’ ones - which concentrated on the heritable variations of a population composed of one species and its immediate ancestors - mainly in the scale. Macroevolution studies large-scale patterns of diversification and extinction arising from processes active at or above the species level (Smith 1994 and citations therein). Some workers have instead defined macroevolution as the extrapolation of microevolutionary processes into geological time (e.g., Levinton 1988). Smith (1994, Chapter 4) presents a comprehensive review of macroevolutionary concepts and theories.
Existing studies mainly consider fossil records of marine invertebrates in high hierarchical groupings (orders, families) with low stratigraphic age resolution (e.g., Jablonski 1993) from punctual, geographically restricted sources. Amongst the various causes of artifacts in macroevolutionary patterns, sampling resolution seems to be an important biasing factor (e.g., Alroy 1998). The chronological control of Neptune and its large amount of paleontological data with taxonomic accuracy at species level, combined with its comparably high sampling resolution (on average, 185 k.y. for the Neogene (Spencer-Cervato et al. 1994) and 330 k.y. for the Paleogene) holds promise for potentially significant contributions to this field of paleontology. Because the quality of the results of macroevolutionary studies is strongly dependent on a sound basis of chronology and taxonomy, we have first exploited the stratigraphic data set (see Section 4.3) and revised the taxonomy of the paleontological records (Section 3.3). We have thus left the study of macroevolutionary patterns in marine plankton to the final phase of the project.
I am presenting here some examples of data searches conducted with Neptune to answer some typical paleobiological questions. They cover the overall longevity and speciation/extinction distribution of Cenozoic marine plankton. I am purposely leaving the discussion and interpretation of these data to an absolute minimum. My goal is in fact to show what type of data can be obtained from the database and the potential of Neptune for paleobiological research.
To optimize the diverse paleontological data set in Neptune, the analyses have been conducted separately for the four plankton groups and the results interpreted in terms of similarities or differences among the groups. The data presented here are based on more than 1400 valid species names (Table 4.1), and include the occurrences of their synonyms. The output of every species’ search consisted of their oldest first appearance and their youngest last appearance. Every result was checked to eliminate false entries caused by, for example, occurrences near hiati, typos, occurrences reported in one single sample, etc. Species that were reported only in one hole were not considered to eliminate the bias of single geographic data points. Finally, one table was produced for each group including the species name, the number of times it had been reported in a sample, the location (paleolatitude and paleolongitude) and age of its first appearance, and the location and age of its last occurrence. From these ages, the species’ longevity was calculated.
- What is the distribution of the longevity of plankton species? Are there substantial differences or similarities among the four plankton groups?
 Figure 4.12 shows the species’ longevity distribution of the four groups with a 1 m.y. resolution. Comparing the four groups, three simple observations can be made: (1) all groups show an asymmetric, unimodal distribution, with a mode around 7 m.y. (diatoms and radiolarians), 14 m.y. (foraminifera) and 19 m.y. (nannofossils), and a tail towards higher longevity values; (2) the median for all distributions is around 10 m.y., except for diatoms, where it is around 7 m.y. - comparing these values with the mode, the peak of the distribution of diatoms is narrower and has a higher symmetry than the other groups; (3) a few phytoplankton species (diatoms and nannofossils) are very longevous (more than 40 m.y.), whilst zooplankton species (foraminifera and radiolarians) live all less than 43 m.y. These observations point to similarities between phyto- or zooplankton in one case, and between siliceous or calcareous plankton in another. However, they also show that diatoms are quite distinct from the other groups.
- What is the average species’ longevity? Are there substantial differences between extinct and extant species’ longevities?
Table 4.2 shows the average longevity (and standard deviations) of both extant and extinct plankton species. It is noticeable that the longevity of extinct species is consistently shorter than the one of extant species. This could be due to the different sizes of the populations considered (less than 30% of the species are extant), which might also explain the larger standard deviations of extant species’ longevity. Alternatively, this could be the effect of differential preservation. Or it could be caused by the artificial boundary set at the beginning of the Cenozoic - the data might include species originated in the Mesozoic, giving them a shorter-than-real longevity. However, only a very small number of species (e.g., the extant nannofossils Braarudosphera bigelowii and Scapholithus fossilis, the extinct nannofossil Placozygus sigmoides; Perch-Nielsen 1985) are reported also from the Mesozoic. Statistically, they should not significantly affect the data set.
For demographic reasons, one would expect a gradually decreasing longevity instead of the asymmetrical peaks shown in Figure 4.12. Is this lower-than-expected number of short-lived species an artifact of the analysis or a real signal? On the other hand, the differences seen in the longevity data could be real, suggesting for example that species which evolved in the Neogene (the majority of the extant species) are more likely to live longer. One can only speculate on the cause of this, such as larger surface water temperature gradients linked to growth of ice caps in polar regions? However, the Neogene climate mode, characterized by abrupt shifts from glacials to interglacials and vice versa, would seem to provide stressful environmental conditions that intuitively should increase species turnover, i.e., shorter longevities. This question requires further analyses (e.g., longevity plots at selected critical times) before a viable hypothesis can be formulated.
To help answer the various open hypotheses on species’ longevities, an important factor that should be considered is the geographic distribution of species throughout their duration. This parameter allows to identify endemic versus cosmopolitan species and is an important factor in ecological studies. By comparing this parameter with species longevity, one would test if a species restricted to a narrow geographic region is more likely to survive longer than a globally widespread species, or vice versa.
- Are there periods in the Cenozoic with a high concentration of species’ appearances or extinctions? Are there geographically defined speciation centers or survival refugia?
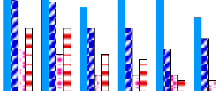
 Appearance and extinction rates were calculated for the four groups to eliminate the bias of the sample size (Wei and Kennett 1983). The rates are calculated as the ratio between the number of extinctions or appearances and the total diversity (number of species) in each 1 m.y. time slice. The Cenozoic appearance rates are shown in Figure 4.13. Appearances are widespread throughout the Cenozoic and no specific time interval is characterized by anomalously high appearance rates, with the exception of the Paleocene. The graphs show that diatom, radiolarian and foraminifer species appeared all during the Cenozoic, with 100% peaks in the Paleocene, while only 50% of the nannofossil species present in the first million year of the Cenozoic appeared then - the remaining 50% existed already in the Mesozoic (see above for some examples). The apparent late appearance of radiolarians in the early Cenozoic is probably an artifact of the data set: no radiolarian reports are available for the Paleocene (Figure 3.5). Average appearance rates are less than 10% and only rarely reach 30%, and are characterized by short fluctuations with a somewhat random frequency. In some instances (e.g., at 61 Ma, 35 Ma, 10 Ma), peaks of appearances in one group correspond to peaks in other groups, but no consistent pattern is apparent.
Extinction rate values are much lower than appearance rates and show a more random distribution (Figure 4.14). Diatoms show a distinct peak in extinctions at the Paleocene/Eocene boundary which is not clearly reproduced in the other groups. On the other hand, radiolarians, nannofossils and foraminifera show a minor peak around the Oligocene/Miocene boundary (25-22 Ma), while all groups (with the exception of radiolarians) show exceptionally high extinctions in the past 3 m.y.
 It is interesting to notice that these trends do not correspond to peaks in appearances (Figure 4.13), but there seems to be a time lapse of a couple of million years between the peaks in extinctions and appearances as the two curves are mostly out of phase. The increase in extinctions in the last 5-7 Ma might be related to the onset of highly variable environmental conditions, which apparently did not cause a corresponding increase in the rate of species’ appearances.
Speciation centers and survival refugia are discrete geographic regions with high concentrations of appearances or extinctions. These are often associated with particularly favorable or stressed environmental conditions and may be limited by biogeographic or oceanographic boundaries (e.g., Jablonski 1993). One simple way to identify these regions is by plotting the latitude of the location of the earliest first appearance or the latest last appearance (Figure 4.15).  The latitudinal distribution of FADs (and of LADs, not shown here, but with an identical pattern to FADs) is clearly different in siliceous and calcareous plankton. Appearances and extinctions of diatom and radiolarian species are concentrated in three belts, around the equator and at mid- to high northern and southern latitudes respectively. These belts are bound by well established nutrient boundaries, like e.g., the polar front. This pattern also reflects the present distribution of siliceous plankton in marine sediments (e.g., Leinen et al. 1986), suggesting that the environmental preferences of these organisms did not change through time. A different scenario is presented by calcareous plankton groups, whose appearances (and extinctions) are more uniformly distributed throughout the latitudinal range.
- How did plankton diversity change through time? How do the patterns for the four plankton groups compare?
Even with the limitations summarized in Chapter 3, I attempted to estimate the distribution of plankton species’ diversity during the Cenozoic. This ‘partial’ diversity, limited mainly to occurrences of biostratigraphic markers and biased by the low number of extensive range charts published for DSDP and ODP holes, is still a very comprehensive estimate, even though not a ‘real’ diversity. I present here some preliminary results based on the data included in Neptune.
 The total species richness for the four plankton groups was calculated at one million-year intervals. To eliminate the bias of the uneven distribution of the number of sections in Neptune (progressively more sections in younger times, Figure 3.2), I have normalized the diversity by dividing it by the total number of sections in each time interval. The results are shown in Figure 4.16. The normalized diversity patterns shown by siliceous plankton are quite similar and clearly distinct from what is shown by calcareous plankton. The two distinct patterns shown by the siliceous and calcareous plankton groups are exactly out of phase, with diatoms and radiolarians showing maximum diversity in the Oligocene to Recent, when nannofossils and foraminifera show their minimum values. Both diatoms and radiolarians show a gradual increase in diversity peaking around the Eocene/Oligocene boundary, followed by a relatively stable plateau during the Neogene. Diatoms also show a peak of diversity in the late Paleocene, when radiolarians are not reported. Diversity of nannofossils and foraminifera, instead, peaked during the early to middle Eocene, decreased in the late Eocene, and has remained more of less constant since the Oligocene.
While it is possible that much of the general variability is due to taphonomy, several further speculations could be made on these patterns. However, potential biases would have to be examined first. For example, what is the lithology of the sections in Neptune through time? Are siliceous sediments more common in the Neogene, thereby explaining the higher siliceous plankton diversity? And how do the absolute normalized values compare? The highest values are recorded in nannofossils while the lowest ones are given for diatoms. The number of valid species names in the two groups is almost identical (Table 4.1), but nannofossil names (valid and non valid) are overall slightly more abundant than diatom names in Neptune (Figure 3.4).  However, foraminifera and radiolarian names are the most abundant ones of the four groups, while their normalized diversity is intermediate between diatoms’ and nannofossils’ diversity. Is there a consistent bias in the published range charts, with more reports available on siliceous plankton than on calcareous plankton in the Neogene? The number of reports on Paleogene sections (Figure 3.5) shows a relatively lower number of reports on siliceous groups than on calcareous groups. The high correlation shown between diatoms’ and radiolarians’ species richness (and to a lesser extent foraminifera) and the total number of sections available for each time interval (Figure 4.17) suggests that absolute values of species diversity are strongly biased by the size of the data set (i.e., more species are described when more sections, and therefore reports, are available). On the other hand, the species richness of nannofossils shows a complex polynomial correlation with the number of sections but a completely random linear correlation (R2 = 0.07). This may be due to the fact that the correlation is made with the total number of sections and not with the number of sections that contain nannofossil stratigraphy. For nannofossils and foraminifera the latter may be the significant parameter which would perhaps show a higher correlation with the species richness, similarly to the one shown for siliceous plankton.
Finally, how strong is the bias caused by the dominant presence of stratigraphic markers in the reports? Siliceous plankton biostratigraphy is better developed for Neogene sediments than it is for the Paleogene, while it is more uniform for calcareous plankton groups. One approach to this question would be to separate the species included in the distribution into stratigraphic markers, other common taxa and rare taxa, and see if the diversity patterns remain the same or change substantially.
These are only some of the factors that one must consider before a feasible interpretation of these trends can be formulated, and some of these require the addition of data to Neptune which are not currently available (e.g., distribution of siliceous versus calcareous sediments). But however preliminary and partial, these results are still quite encouraging and represent a more detailed data set than what is available from the paleobiological literature.
4.2.1. Availability of relational databases for the paleontological community: the ODP database JANUS versus Neptune. At present, the ODP database, JANUS, which is currently available onboard the JOIDES Resolution and through the WWW, does not represent a viable substitute for Neptune. I must point out, however, that JANUS is very new and that the import of data has just begun. My experience with JANUS is limited to a superficial browsing through ODP’s database WWW site, which provided me with the following information. Site data (water depth, coordinates, length drilled, length recovered, etc.), physical properties (e.g., GRAPE, magnetic susceptibility), and chemical results (e.g., carbonate content) represent the bulk of the database and are available for most ODP Legs. Age model and paleontological information are part of the database structure, but (as of March 1998) are given only for a handful of sites. There is one general grouping (‘Paleontology’) which is divided into four searchable tables: Age Model, Paleontological Investigation, Range Table, and Species Information. Age Model information is currently (as of March 1998) available only for one hole in Leg 105 and consists of two points, the top of the drilled section and the bottom. ODP is probably planning to progressively add more detailed age model data for all ODP sites.
I used a simple, predetermined query to search the database for paleontological information and I only obtained very preliminary information, such as the name/s of the paleontologist/s who did the shipboard study, the depth in meters below seafloor of the samples analyzed, their relative stratigraphic position (e.g., middle Eocene), and the abundance and preservation of the microfossil group. As this information was available only from Leg 171 onward, legs for which no reports are published as yet, I do not know if it is planned to add more detailed paleontological information (e.g., the range charts that are available in Neptune) from the Scientific Results, once they become available.
Very basic taxonomic information is also available. For example, the search for ‘Globorotalia truncatulinoides’ resulted in the name of the author who named the species (d’Orbigny), when the species was first described (1839), and the stratigraphic interval it is found in (Neogene).
I finally attempted to develop a customized ‘Power Query’ to search JANUS but I did not succeed. No instructions were given on how to select the various items present in the relational tables and the query routine was neither user-friendly nor intuitive.
While JANUS is undoubtedly a very valuable resource for site information and shipboard results (mainly physical properties), the preliminary search of the paleontological content of JANUS suggests that Neptune is still clearly a more valuable source of paleontological information. Although I do not see how JANUS and Neptune could be easily integrated, the two databases certainly complement each other. As shown in the studies outlined above (Lazarus et al. 1995b; Spencer-Cervato and Thierstein 1997), Neptune can be extremely helpful to biostratigraphers during ODP cruises, for example for the identification of the taxa previously recorded in a specific region during a certain time interval, thereby restricting the field of species identification to likely occurrences.
4.3. Stratigraphic research with Neptune: diachrony and hiati distribution. The field where Neptune’s potential has been already quite thoroughly exploited is stratigraphy. The chronology of Neptune’s holes has been revised several times and even if the quality of age models is quite varied (Table 2.1), it still represents the most complete and reliable data set available for stratigraphic studies. Two major groups of information have been derived from this data set, the first directly applicable to biostratigraphy, the second of a stratigraphic and paleoceanographic significance.
 The goal for the first group of studies (Spencer-Cervato et al. 1993; 1994) was to determine the reliability of biostratigraphic markers, in terms of their regional versus global significance and of their synchrony or diachrony. As mentioned in Chapter 3, siliceous biostratigraphy is based on several regional calibrations of events, whilst calcareous biostratigraphy relies on a single, mainly low-latitude calibration (Berggren et al. 1995a, b). The use of the latter approach (one calibration for all holes, irrelative of their biogeographic location) implies a global synchrony of biostratigraphic events, that has actually been demonstrated only in very few cases. The first study (Spencer-Cervato et al. 1993) was aimed to calibrate several Neogene radiolarian events in the north Pacific and to study the degree of diachrony within this biogeographic region (Figure 4.18). The projected ages of radiolarian first and last occurrences derived from the line of correlation of age/depth plots from the North Pacific have been computed from twelve North Pacific sites, and 28 radiolarian events have thereby been newly cross-calibrated to North Pacific diatom and other stratigraphy. Several of the North Pacific radiolarian events are older than in previously published equatorial Pacific calibrations (Johnson and Nigrini 1985) (Figure 4.18), and some may be diachronous within the North Pacific. We hypothesized that these patterns may be due to complex latitudinal patterns of clinal variation in morphotypes within lineages, or to migration events from the North Pacific towards the Equator.
 The second, more comprehensive study (Spencer-Cervato et al. 1994) evaluated the synchrony and diachrony of 124 commonly used Neogene biostratigraphic events in 35 globally distributed DSDP and ODP holes. Global mean age estimates based on combined biostratigraphy and magnetostratigraphy were calculated for each event. The ages’ standard deviations were used as an estimate of synchrony/diachrony. Average standard deviations for event ages by fossil group are: calcareous nannofossil first appearance datums (FADs): 0.57 m.y. (21 events), calcareous nannofossil last appearance datums (LADs): 0.60 m.y. (25 events), diatom FADs: 0.57 m.y. (7 events), diatom LADs: 0.85 m.y. (14 events), planktic foraminifera FADs: 0.88 m.y. (22 events), foraminifera LADs: 0.68 m.y. (16 events), radiolarian FADs: 0.30 m.y. (9 events), radiolarian LADs: 0.31 m.y. (10 events). 53 of the 124 events can be considered synchronous, within the resolution of the method (± two average sample spacings, i.e., 360 k.y.). The remaining diachronous events were analyzed for true patterns of diachrony and other biases. Generally, diachrony is more frequent among cosmopolitan than among endemic taxa (Figure 4.19). Also, the precision of age calibrations decreases with increasing age. Some diachrony patterns may be due to investigator bias (see examples shown in Spencer-Cervato et al. 1994), but in general they appear to be, at least in part, real phenomena. Thus, they could provide opportunities for exploration of paleobiological processes (see for example the study on G. truncatulinoides described above, Spencer-Cervato and Thierstein 1997).
A similar study of diachrony was not attempted for Paleogene events and is not recommended either. The age control on the chronology of Paleogene sediments is poorer than what is available for Neogene sediments. Moreover, fewer sections were analyzed for magnetostratigraphy, which provides the independent control on the age models selected for the Neogene study described above. I expect that the patterns of diachrony that could be obtained for Paleogene events would be largely biased by the data set and, therefore, would not provide a scientifically sound basis for further studies.
The chronology of the 165 holes in Neptune was the subject of the third stratigraphic study originated from Neptune. It was mentioned in Chapter 3 that continuous stratigraphic sequences were very rare and that most age models were characterized by hiati. Hiati are commonly recognized in shelf sediments, but regional deep-sea hiati have also been extensively studied (e.g., Keller and Barron 1983). The reason for the interest in the timing and geographic distribution of hiati lies in the processes that cause them. A hiatus is a stratigraphic gap caused by erosion, dissolution, corrosion, nondeposition, rate of sediment supply versus dissolution (corrosion) of sediments (controlled by fluctuations in the calcite compensation depth - CCD), or shallow to deep water sediment fractionation (Berger 1970). Several studies have interpreted the occurrence of deep-water hiati in terms of changes in deep water circulation and corrosiveness (e.g., Keller and Barron 1987). Other studies have focused on the occurrence of hiati in continental shelf sediments and some authors have interpreted them within a framework of sea-level fluctuations (e.g., Vail et al. 1977; Haq et al. 1987).
For this study (Spencer-Cervato 1998) I have identified ‘hiatus events’ during the Cenozoic, based on the occurrence of individual hiati both in shelf and deep-sea sediments. The goal of the study was to test if there is a causal link between sea-level fluctuations (and climate change) and global occurrences of hiati, which are linked to oceanic circulation through a variety of complex processes. I initially attempted to reproduce the ‘global eustatic sea-level curve’ of Haq et al. (1987) with a curve of hiati distribution. This sea-level curve was constructed by the Exxon Exploration Group and is based on proprietary seismic data collected mainly on the eastern Atlantic passive continental margin. This curve has been a source of controversy since its publication, mainly because scientists had failed to reproduce it and because it was difficult to find physical mechanisms that could cause rapid sea-level fluctuations of more than 250 m, such as the ones implied in the curve. Drilling off New Jersey during ODP Leg 150X has recovered stratigraphic sequences which contain gaps that can be correlated to the ones used to construct the sea-level curve. These results (e.g., Miller et al., 1996) seem to have sedated the debates on the reliability of the sea-level curve, but the dispute on the magnitude of the fluctuations is still unresolved.
 Compared to previous compilations of hiatus distribution in the DSDP stratigraphic record (e.g., Moore et al., 1978), the curve that I have obtained (Figure 4.20c) has a better resolution (0.5 m.y.), contains more recent holes with better recovery, and is based on a more reliable and updated biochronology. Other studies (e.g., Keller and Barron 1983; Ramsay et al. 1994) instead focused on specific regions, e.g., the Indian or the Atlantic Ocean, while my study (Spencer-Cervato 1998) is of global extent.
To help in the interpretation of the record of hiati, I have estimated the paleo-water depth at which the hiati occurred and constructed three individual curves for shallow (0-2000 m), intermediate (2000-3000 m) and deep (> 3000 m) water (Figure 4.21). The curves show that the Paleogene is characterized by few, several million-years long hiati, while the Neogene is punctuated by short, frequent hiati events (Figure 4.20), occurring nearly synchronously in shallow and deep water sediments. The most significant Cenozoic hiatus event spans most of the Paleocene. Epoch boundaries are characterized by peaks in deepwater hiati possibly caused by an increased circulation of corrosive bottom water and sediment dissolution.  The Plio-Pleistocene is characterized by a gradual decrease in the frequency of hiati. This could be caused by several factors, including the better recovery of younger sediments and therefore a lower chance of recording artificial hiati. Alternatively, this can indicate that sediment erosion and corrosion is time dependent and thus that there has been insufficient time to create hiati in the youngest sections. However, this smooth drop can also be an artifact of the time interval chosen for this analysis, which masks the high-frequency cycles of Quaternary glacio-eustatic sea level change possibly characterized by short (<0.5 m.y.) hiati, not recorded in this study.
Although some speculations were advanced on the causes of these hiatus events, their regional significance and possible causes will be the topic of future, more detailed studies. Among these, of particular interest would be the geographic distribution of hiati within ocean basins (e.g., latitudinal distribution of hiati versus latitudinal distribution of DSDP and ODP holes in the database and western versus eastern margins to identify the temporal evolution of oceanic gyre circulation) and their comparison to detailed isotopic records of deepwater circulation (e.g., Wright and Miller 1993). The depth distribution of hiati in mid-ocean and aseismic ridge sites versus continental shelf and slope sites must be also analyzed separately. These areas should be affected differently by sea level changes.
In summary, Neptune’s data have been used for five published studies of plankton evolution and stratigraphy. While the stratigraphic studies provide a quite complete overview of the potential of Neptune, the study of plankton evolution has so far been limited to biostratigraphic applications. The analysis of plankton longevity and diversity has been shown here as raw data. This is the field where Neptune’s data still have much to offer to the paleontological community. In the following section, I will explore the possibility of expanding Neptune beyond the paleontological field and will suggest possible future avenues of research based on this database.
4.4. Potential additional data for Neptune for sedimentological and paleoceanographic research
In my opinion, the potential of Neptune for future research extends considerably beyond analyses of micropaleontological data. Neptune’s chronology and relatively large number of holes are its greatest assets and they should be properly exploited. A significant step forward would be represented by the addition of sedimentological data, which would open up a whole new range of research possibilities. The expansion of Neptune would benefit the research community by providing interdisciplinary links and correlations that are at present rarely possible to scientists working on ODP material. Time pressure and poor funding force ODP-participating scientists to limit their post-cruise research to very limited, mainly isolated goals (James D. Wright, personal commun., 1998). Once their duty as sedimentologists or micropaleontologists is fulfilled and their report is submitted, scientists move quickly to the next ‘hot’ research topic, and the potential for correlations between data sets and large-scale research studies is left largely untouched. In this scenario, the opportunities provided by Neptune’s chronology and paleontological data would be greatly enhanced by other data that would allow to make large-scale, interdisciplinary (e.g., modeling) studies, or at least would provide an easily accessible source of a large amount of quality data from which to start such studies. Only very few of these studies based on deep-sea sediments are available at present (e.g., Delaney and Boyle 1988).
Among the data that should be included in Neptune, and that are consistently available at least for the more recent ODP holes, are: lithology (percentage carbonate, percentage silica); organic carbon content; physical properties (e.g., bulk density, grain density, porosity); and grain-size distribution. The field of paleoceanography would be the primary beneficiary of the combination of the existing paleontological and chronological data in Neptune with sedimentological information and physical properties data. I will mention here only a couple of the several, current research questions that are debated in the paleoceanographic community and that could be addressed with these additional data.
During the middle Miocene, important changes occurred in the climate of the Earth, an important step toward the establishment of cold polar climates and the modern climate mode characterized by glacial and interglacial cycles. These changes are documented in the oxygen isotope records (e.g., Miller et al. 1987; Figure 4.20e), and indicate the onset of a progressive global cooling. It is not yet known what causes the abrupt shifts in climate mode that the Earth has experienced in the last million years, even though some recent evidence (Zachos et al. 1997) suggest that these shifts might have characterized the earth’s climate already since the Oligocene. It is, therefore, obvious why so many studies have focused on middle Miocene sediments and have led to the formulation of various hypotheses. Several hypotheses have linked climate changes to large-scale deepwater circulation (e.g., Shackleton et al. 1983), but the causal relationship between middle Miocene changes in deepwater circulation and the establishment of a permanent ice sheet in eastern Antarctica, is still uncertain (e.g., Kennett and Barker 1990).
Keller and Barron (1983) proposed that a "silica switch" occurred between the Atlantic and Pacific Ocean in the middle Miocene, around 15 Ma and contemporary to the δ18O increase. Based on the relative abundance of siliceous sediments in nine tropical Atlantic sites, they suggested that prior to 15 Ma, Atlantic sediments were silica-rich, but that after that time, silica sedimentation switched to the Pacific Ocean. Predominantly carbonatic sediments have apparently been accumulating in the Atlantic since then. This switch would have been caused by the initiation of the Northern Component Water (NCW) circulation in the north Atlantic. However, Wright et al. (1992) have raised some concerns on the selection of data on which Keller and Barron (1983) based their hypothesis, and argue that NCW’s production began earlier (around 19 Ma) and had actually shut down during the 15 Ma δ18O event. Wright et al. (1992) propose that the middle Miocene δ18O increase does not correlate with deepwater circulation changes and does not represent the transition from an ice-free to an ice-house world, but is part of two or three glacial/interglacial cycles.
How could Neptune help solve this controversy? The cause of disagreement in the interpretations is the data on which Keller and Barron (1983) based their hypothesis. The possibility of modeling the results of a larger number of chronologically well constrained holes in the Atlantic and Pacific Oceans would give the ‘middle Miocene controversy’ a strong, potentially unbiased basis of data. The data that would be needed are the concentrations of carbonate and opal. These data have not been incorporated in Neptune yet, because data from different holes are potentially incompatible, due to the different methods used in their collection.
Since the beginning of the DSDP project, carbonate concentration has been a routine analysis performed on the sediments. Biogenic opal data are also available for DSDP holes, but only in the more recent ODP holes has it been estimated analytically. It would be conceptually simple to add a new table to Neptune, which would include the sample number, percentage carbonate and percentage opal. This table would be linked to the Sample Data table, which would provide an age estimate for each sample. In reality, this task is far from being trivial. The main reason for this is due to the analytical methodology used to determine the concentration of carbonate and opal. During DSDP, several different methods were used, giving results that are not comparable to each other. Routinely, percentage carbonate and opal have been estimated from smear slides, a method that has a maximum accuracy of ±10% (Hsü, Montadert et al. 1978). These data are highly subjective and not useful for rigorous quantitative studies. Keller and Barron (1983) used these counts for their "silica switch" hypothesis, on sites where the biosiliceous component was actually minimal and easily affected by dissolution of diatoms, the primary components of siliceous productivity (Wright et al. 1992). Quantitative analytical measurements of carbonate and opal would be required to map the distribution of these carbonatic and siliceous sediments in the entire ocean basins and to test the "silica switch" hypothesis.
The shipboard-based ‘carbonate bomb’ method (Müller and Gastner 1971) has been used relatively early in the DSDP on a few selected samples to provide a control on the smear slide estimates. The accuracy of this method, the most common analytical method used during DSDP cruises, is between 1 and 5%, lower for carbonate-rich sediments. In some instances, other shorebase methods (e.g., the LECO method; Hsü, Montadert et al. 1978) were compared to the results of the ‘carbonate bomb’ method and systematic differences observed. In more recent ODP Legs, a shipboard Coulometer is used to determine percent carbonate (and percent organic carbon)(e.g., Leg 121), with a precision of approx. 1%. I am not aware of a study that compares this method to the previous methods. The silica content has been quantitatively analyzed only for some ODP holes, using X-Rayx-ray fluorescence and the normative equation of Leinen (1977) (e.g., Littke et al. 1991) or, more recently, a single-step alkaline extraction method (Mortlock and Froelich 1989). The precision of the latter method is ±4%. The carbonate bomb, LECO and Coulometer estimates for carbonate and the X-ray fluorescence and alkaline extraction estimates of opal content from holes where sampling frequency is sufficient (e.g., one sample every 0.5 m.y.), could be selectively incorporated into Neptune. Some of these data are available for ODP holes from the JANUS database, but they would probably need to be added manually for the DSDP holes.
These same lithological data, combined with the paleo-water depth estimates of Spencer-Cervato (1998) (not yet included in Neptune but available at the NOAA-WDCA for Paleoclimatology Data Contr. Series #97-030: ftp://ftp.ngdc.noaa.gov/paleo/paleocean/by_contributor/spencer-cervato1998/) could be used to reconstruct the depth fluctuations of the Calcite Compensation Depth (CCD) during the Cenozoic, for which the curve by van Andel (1975) is still being used. The very smooth fluctuations of the CCD curve of van Andel (1975) do not agree with the abrupt changes that have been recently shown to characterize the earth’s climate and ocean systems in the Cenozoic. This is probably caused by the low resolution of stratigraphic studies in the 1970s. The better resolution (around 0.5 m.y. or better) of the Neptune data would allow us to refine the curve and to make it more compatible with, for example, the isotopic data currently being produced.
I briefly mentioned earlier the importance of deepwater circulation reconstruction for the understanding of the climate/ocean systems. Sediment accumulation rates and dissolution profiles can be reconstructed from physical property data and grain-size distributions, all data that are routinely produced onboard ship and that could be quite easily added to Neptune. Recent studies (Zachos et al. 1997) use a record of percent coarse fraction to demonstrate that glacial/interglacial cycles existed as far back as the late Oligocene. This parameter, combined with a high resolution δ18O record from ODP Leg 154 (Ceara Rise - south Atlantic), shows a 40-k.y. periodicity, indicating a high-latitude orbital control on ice volume and temperature. This isotopic record suggests that there is an orbital control on deepwater circulation, which had not yet been shown so early probably because of the low resolution of previous studies and the paucity of deep-sea sections with high sedimentation rates and a long stratigraphic record, like the ones recovered by Leg 154 on the Ceara Rise.
The trend for future paleoceanographic studies is toward high (tens of thousands of years) resolution studies. Is Neptune ready for these studies? The answer is: not yet. The chronology of Neptune, its biggest strength and the most updated record available, is based on biostratigraphy and magnetostratigraphy, which provide an accuracy on the order of hundreds of thousands of years, at best. Oxygen isotope stratigraphy is currently the only means to obtain a better age resolution than this for Neogene sediments. Results from ODP Leg 154 provide the longest and most complete isotopic record for the whole Neogene which extends into the Oligocene (Weedon et al. 1997). A calibration of the sporadic isotopic records available for DSDP holes and the more common records from ODP holes to this recent isotopic calibration would allow us to refine the (mainly) late Neogene chronological resolution for some of the sites in Neptune. My biggest concern about this calibration is that correlations with standard isotopic records are still done by ‘wiggle matching’. Because the absolute isotopic values vary depending on the foraminifer species or sediment fraction used to obtain the record, the shape of the curve (which remains substantially the same) is used for the correlation. I am not aware of any comprehensive study that has carefully pinpointed and tabulated some of the ages of the 200+ (the total number is actually unknown: some 140 are recognized only in the Plio-Pleistocene) isotopic stages to magnetostratigraphy beyond the late Miocene (Hodell et al. 1994). This would provide fixed reference points for stratigraphic interpretations. ‘Eye-balled’ graphic correlation is, in my opinion, too inaccurate for the type of studies that it is used for (unless one can actually count back all stages starting from the Holocene) and greatly reduces the potential resolution of isotope stratigraphy.
5. A MORE REALISTIC ASSESSMENT: NEPTUNE AS A TOOL IN SUPPORT OF DATA IMPROVEMENT
Eight years after the first planning meetings at the ETH, I have finally achieved a balance between the initial expectations/dreams and the realization of what Neptune really is and its limitations. I have described the scopes, accomplishments, and drawbacks of this project in the previous chapters and now it is time to answer the question: what next? What is the future of Neptune? In the previous chapters, I tried to convey that Neptune is not a sufficient data set to base several (biostratigraphic) publications on, but mainly a tool to make collecting new data more focused and more efficient. And this is the legacy of this project to the research community.
The chronology of the Neogene sediments of some 100 DSDP holes was published as an Ocean Drilling Program Technical Note (Lazarus et al. 1995a) and is currently available through the WWW site of the NOAA- National Geographic Data Center (NGDC) (http://www.ngdc.noaa.gov/mgg/geology/lazarus.html). The age models for these sites were based on Berggren et al. (1985). The updated models (to Berggren et al. 1995a, b) extended to the whole Cenozoic, as well as additional ODP holes, are published here in graphic form and as text files in the Appendix A. At the same time, a link to them will be deposited at the widely used archival site of the NGDC.
At present, the database is accessible through the author, at the ETH Zürich, and at the Natural History Museum in Basel, Switzerland. It is still unclear how the whole database with its search options will be made accessible to the community. Among the options discussed are a CD-ROM (which would, however, require the relatively expensive 4th Dimension® program to run) and a server at the Micropaleontological Reference Center (MRC) in Basel. The optimal solution for this second option would be an interactive WWW site that could be remotely accessible world-wide. Recently, the program NetLink/4D™ has been made available on the market. This program apparently makes databases searchable through the Internet (Lazarus, personal commun., 1998). However, I have not seen nor tried the program yet and do not know how user-friendly it is. However, I suspect that the large size of Neptune would make even the simplest searches very slow and time consuming through the Internet. A more modest, but immediately feasible alternative, would be to have one person at the MRC in charge of the use of Neptune.  Requests for searches could be e-mailed to the MRC and the results (in print or as computer files) mailed to the requester. Among the various possibilities, searches for presence/absence and location or number of occurrence of single or multiple taxa would require only a few minutes. This search would also provide information on the taxonomic validity of the taxa and the lists of synonyms. A more extensive search would distinguish between stratigraphically and thematically well and poorly covered intervals. The identification of significant gaps in the biostratigraphic record (e.g., Paleogene biochronology of siliceous microfossils and revisitation of suitable Paleogene sediments for detailed biostratigraphy) (Figure 5.1) would be the basis for the logical, objective planning of future research. It could spur clearly aimed detailed micropaleontological studies, instead of random studies that generate a lot of repetition and overlap (e.g., Moore 1972).
Considering that Neptune contains selected, good quality holes, it is still notable how small the number of useful holes (well cored, well analyzed and well documented with modern biochronological methods and modern taxonomy) has remained. An enormous amount of re-analysis of older sections could be quite profitable. Figure 5.1 indicates that a lot can still be done on sections older than the late Miocene, especially on siliceous plankton groups.  New coring needed to fill the existing coverage gaps could be identified with three dimensional (latitude vs. longitude vs. time) maps of the oceans produced with Neptune. Another way to identify stratigraphic coverage gaps is given by the rate of success in recovering drilled sections (Figure 5.2). This curve indicates that the early and middle Eocene, as well as large parts of the Miocene, have been less well recovered than e.g., the Plio-Pleistocene or the Eocene/Oligocene boundary. This might be one of the causes of the poor Eocene biochronology for certain plankton groups. Recent ODP Legs (e.g., 171B) have recovered long Eocene sections: these should be studied in detail to cover this recovery gap.
These are just a couple of examples of the utility of Neptune in designing goal-oriented studies aimed to obtain a complete picture of the oceans’ history during the Cenozoic, necessary for a better understanding of the complex processes that control the Earth systems. This approach would, however, require the change in nature of the DSDP and ODP projects from ‘leg oriented’ to ‘overview oriented’, which in my opinion is a more effective investment of resources. This step would certainly represent the most valuable contribution of Neptune to the geological community.
ACKNOWLEDGEMENTS
I would like to thank J.-P. Beckmann, M. Biolzi, J. Bollmann, H. Hilbrecht, and K. von Salis Perch-Nielsen for their contribution to the Neptune project, and H.R. Thierstein for his continuous support to this project and years of encouragement. D.B. Lazarus, who initiated the project, designed and programmed the database, taught me much of what I know about ODP and biostratigraphy. Reviews and comments by H.R. Thierstein, J.A. McKenzie and two anonymous reviewers have greatly improved the manuscript. A special thanks goes to D.A. Spencer, who never ceased to remind me to write this work and for his constant support. Several other people have been involved in the taxonomic part of this project: J.-P. Caulet, J. Fenner, C. Nigrini, and C. Sancetta worked on preparing synonymy lists. C. Nigrini and A. Sanfilippo kindly provided their unpublished radiolarian range charts and revised Paleogene biozonations. A. Smith’s help and suggestions with the paleogeographic reconstruction is gratefully acknowledged. He kindly made available the unpublished program that was used for the paleoposition calculations. B. Brabec and K. Ragoonaden generously provided me with their computational expertise. A. Vit helped in the compilation of biostratigraphic files. M. Rakesh and the ODP Paleontological Archive staff made available the spreadsheet files of ODP range charts. The editors of Palaeontologia Electronica, Tim Patterson and Norm MacLeod, and three anonymous reviewers are gratefully acknowledged for their comments. Jennifer Rumford, PE’s technical editor, has been a great help in sorting out the challenge presented by the formatting the 200+ figures and tables. Finally, I would like to acknowledge my baby daughter, Francesca Louise Spencer, for patiently letting me spend long hours in front of the computer writing this synthesis when I was supposed to rest while expecting her. This work is dedicated to you and to your dad.
REFERENCES
Abbott, W. H. 1987. Diatom Occurrences, Deep Sea Drilling Project Sites 612 and 613. In: Poag, C. W., Watts, A. B. (Eds.). Initial Reports of the Deep Sea Drilling Project, 95:417-418. Washington: U. S. Government Printing Office.
Abelmann, A. 1990. Oligocene to Middle Miocene Radiolarian Stratigraphy of Southern High Latitudes from Leg 113, Sites 689 and 690, Maud Rise. In: Barker, P. F., Kennett, J. P. (Eds.). Proceedings of the Ocean Drilling Program, Scientific Results, 113:675-708. College Station, TX: Ocean Drilling Program.
Abelmann, A. 1992. Early to mid-Miocene radiolarian stratigraphy of the Kerguelen Plateau (ODP Leg 120). In S. W. Wise & R. Schlich (Eds.), Proceedings of the Ocean Drilling Program, Scientific Results, 120:757-784. College Station, TX: Ocean Drilling Program.
Aksu, A. E., and Kaminski, M.A. 1989. Neogene and Quaternary Planktonic Foraminifer Biostratigraphy and Biochronology in Baffin Bay and the Labrador Sea. In: Srivastava, S. P., Arthur, M.A., Clement, B. (Eds.). Proceedings of the Ocean Drilling Program, Scientific Results, 105:287-304. College Station, TX: Ocean Drilling Program.
Alexandrovich, J. M. 1992. Radiolarians from Sites 794, 795, 796, and 797, Japan Sea. In: Pisciotto, K. A., Ingle, J. C. (Eds.). Proceedings of the Ocean Drilling Program, Scientific Results, 127:291-307. College Station, TX: Ocean Drilling Program.
Alroy, J. 1998. Diachrony of mammalian appearance events: Implications for biochronology. Geology, 26:23-26.
Applegate, J. L., and Wise, S. W., Jr. 1987. Eocene Calcareous Nannofossils, Deep Sea Drilling Project Site 605, Upper Continental Rise off New Jersey, U.S.A. In: van Hinte, J. E., Wise, S. W., Jr. (Eds.). Initial Reports of the Deep Sea Drilling Project, 93:685-698. Washington: U.S. Government Printing Office.
Aubry, M.-P. 1992. Paleogene Calcareous Nannofossils from the Kerguelen Plateau, Leg 120. In: Wise, S. W., Schlich, R. (Eds.). Proceedings of the Ocean Drilling Program, Scientific Results, 120:471-491. College Station, TX: Ocean Drilling Program.
Backman, J. 1984. Cenozoic calcareous nannofossil biostratigraphy from the northeastern Atlantic Ocean - Deep Sea Drilling Project Leg 81. In D. G. Roberts & D. Schnitker (Eds.), Initial Reports of the Deep Sea Drilling Project, 81:403-428. Washington: U. S. Government Printing Office.
Baldauf, J. G. 1985. A high resolution Late Miocene-Pliocene diatom biostratigraphy for the eastern Equatorial Pacific. In L. Mayer & F. Theyer (Eds.), Initial Reports of the Deep Sea Drilling Project, 85:457-476. Washington: U. S. Government Printing Office.
Baldauf, J. G. 1987. Diatom biostratigraphy of the middle- and high-latitude North Atlantic Ocean, Deep Sea Drilling Project Leg 94. In W. F. Ruddiman & R. B. Kidd (Eds.), Initial Reports of the Deep Sea Drilling Project, 94:729-762. Washington: U. S. Government Printing Office.
Baldauf, J. G., and Barron, J. A. 1991. Diatom Biostratigraphy: Kerguelen Plateau and Prydz Bay Regions of the Southern Ocean. In: Barron, J., Larsen, B. (Eds.). Proceedings of the Ocean Drilling Program, Scientific Results, 119:547-598. College Station, TX: Ocean Drilling Program.
Baldauf, J. G., and Monjanel, A. -L. 1989. An Oligocene Diatom Biostratigraphy for the Labrador Sea: DSDP Site 112 and Hole 647A. In: Srivastava, S. P., Arthur, M.A., Clement, B. (Eds.). Proceedings of the Ocean Drilling Program, Scientific Results, 105:323-347. College Station, TX: Ocean Drilling Program.
Baldauf, J.G. 1984. Cenozoic diatom biostratigraphy and paleoceanography of the Rockall Plateau region, north Atlantic, Deep Sea Drilling Project Leg 81. In D. G. Roberts & D. Schnitker (Eds.), Initial Reports of the Deep Sea Drilling Project, 81:439-478. Washington: U. S. Government Printing Office.
Barron, J. A. 1981. Late Cenozoic diatom biostratigraphy and paleoceanography of the middle-latitude eastern North Pacific, Deep Sea Drilling Project Leg 63. In R. S. Yeats & B. U. Haq (Eds.), Initial Reports of the Deep Sea Drilling Project, 63:507-538. Washington: U. S. Government Printing Office.
Barron, J. A. 1985a. Late Eocene to Holocene diatom biostratigraphy of the equatorial Pacific Ocean, Deep Sea Drilling Project Leg 85. In L. Mayer & F. Theyer (Eds.), Initial Reports of the Deep Sea Drilling Project, 85:413-457. Washington: U. S. Government Printing Office.
Barron, J. A. 1985b. Miocene to Holocene planktic diatoms. In H. M. Bolli,J. B. Saunders, & K. Perch-Nielsen (Eds.), Plankton Stratigraphy, 763-809. Cambridge University Press.
Barton, C. E., and Bloemendal, J. 1986. Paleomagnetism of sediments collected during Leg 90, Southwest Pacific. In J. P. Kennett & C. C. von der Borch (Eds.), Intitial Reports of the Deep Sea Drilling Project, 90:1273-1316. Washington: U. S. Government Printing Office.
Backmann, J. and N.J. Shackleton 1983. Quantitative biochronology of Pliocene and early Pleistocene calcareous nannoplankton from the Atlantic, Indian and Pacific Oceans, Mar. Micropaleont, 8:141-170.
Beckmann, J. P. 1972. The Foraminifera and some associated microfossils of Sites 135 to 144. In D. E. Hayes & A. C. Pimm (Eds.), Initial Reports of the Deep Sea Drilling Project, 14:389-420. Washington: U. S. Government Printing Office.
Berger, W.H. 1970. Biogenous deep-sea sediments: fractionation by deep-sea circulation. Geol. Soc. Am. Bull., 81:1385-1402.
Berggren, W. A. 1992. Neogene Planktonic Foraminifer Magnetobiostratigraphy of the Southern Kerguelen Plateau ( Sites 747, 748, and 751). In: Wise, S. W., Schlich, R. (Eds.). Proceedings of the Ocean Drilling Program, Scientific Results, 120:631-647. College Station, TX: Ocean Drilling Program.
Berggren, W. A. 1992. Paleogene Planktonic Foraminifer Magnetobiostratigraphy of the Southern Kerguelen Plateau (Sites 747-749). In: Wise, S. W., Schlich, R. (Eds.). Proceedings of the Ocean Drilling Program, Scientific Results, 120:551-568. College Station, TX: Ocean Drilling Program.
Berggren, W. A., Aubry, M. P., and Hamilton, N. 1983. Neogene Magnetobiostratigraphy of the Deep Sea Drilling Project Site 516 ( Rio Grande Rise, South Atlantic). In: Barker, P. F., Carlson, R. L., Johnson, D. A. (Eds.). Initial Reports of the Deep Sea Drilling Project, 72:675-713. Washington: U. S. Government Printing Office.
Berggren, W. A., Hamilton, N., Johnson, D. A., Pujol, C., Weiss, W., Cepek, P., and Gombos, A. M. Jr. 1983. Magnetobiostratigraphy of the Deep Sea Drilling Project Leg 72, Sites 515-518, Rio Grande Rise (South Atlantic). In: Barker, P. F., Carlson, R. L., Johnson, D. A. (Eds.). Initial Reports of the Deep Sea Drilling Project, 72:939-948. Washington: U. S. Government Printing Office.
Berggren, W. A., Kent, D. V., Flynn, J. J., and Van Couvering, J. A. 1985. Cenozoic geochronology. Geological Society of America Bulletin, 96:1407-1418.
Berggren, W.A., Lohmann, G.P., Poore, R.P. 1974. Shore Laboratory Report on Cenozoic Planktonic Foraminifera: Leg 22. In: von der Borch, C. C., Sclater, J. G. (Eds.). Initial Reports of the Deep Sea Drilling Project, 22:635-655. Washington: U. S. Government Printing Office.
Berggren, W.A., F.J. Hilgen, C.C. Langereis, D.V. Kent, J.D. Obradovich, I. Raffi, M. Raymo, and N.J. Shackleton 1995a. Late Neogene chronology: New perspectives in high-resolution stratigraphy. Geol. Soc. Am. Bulletin, 107:1272-1287.
Berggren, W.A., D.V. Kent, C.C. Swisher, and M.P. Aubry 1995b. A revised Cenozoic geochronology and chronostratigraphy, In: Geochronology, Time Scales and Global Stratigraphic Correlations: A unified temporal framework for an historical geology, edited by Berggren, W.A., Kent, D.V., and Hardenbol, J., SEPM Special Volume, 54:129-212.
Blechshmidt, G. 1979. Biostratigraphy of Calcareous Nannofossils: Leg 47B, Deep Sea Drilling Project. In: Sibuet, J.-C., Ryan, W.B.F. (Eds.). Initial Reports of the Deep Sea Drilling Project, 47:327-360. Washington: U. S. Government Printing Office.
Bleil, U. 1985. The magnetostratigraphy of northwest Pacific sediments, Deep Sea Drilling Project Leg 86. In G. R. Heath & L. H. Burkle (Eds.), Initial Reports of the Deep Sea Drilling Project, 86:441-458. Washington: U. S. Government Printing Office.
Boersma, A. 1977. Cenozoic Planktonic Foraminifera- DSDP Leg 39 (South Atlantic). In: Supko, P.R., Perch-Nielsen, K. (Eds.). Initial Reports of the Deep Sea Drilling Project, 39:567-590. Washington: U. S. Government Printing Office.
Boersma, A. 1984. Cretaceous-Tertiary planktonic foraminifers from the southeastern Atlantic, Walvis Ridge area, Deep Sea Drilling Project Leg 74. In T. C. Moore Jr. & P. D. Rabinowitz (Eds.), Initial Reports of the Deep Sea Drilling Project, 74:501-523. Washington: U. S. Government Printing Office.
Boltovskoy, E. 1974. Neogene planktonic foraminifera of the Indian Ocean (DSDP, Leg 26). In T. A. Davies & B. P. Luyendyk (Eds.), Initial Reports of the Deep Sea Drilling Project, 26:675-742. Washington: U. S. Government Printing Office.
Brönnimann, P., and Resig, J. 1971. A Neogene globigerinacean biochronologic time-scale of the southwestern Pacific. In E. L. Winterer (Ed.), Initial Reports of the Deep Sea Drilling Project, 7:1235-1470. Washington: U. S. Government Printing Office.
Brunner, C. A. 1992. Paleoenvironment and Biostratigraphy of Foraminifers at Sites 794, 795, 796, and 797 in the Japan Sea. In: Pisciotto, K. A., Ingle, J. C. (Eds.). Proceedings of the Ocean Drilling Program, Scientific Results, 127:187-224. College Station, TX: Ocean Drilling Program.
Bukry, D. 1973. Low-latitude coccolith biostratigraphic zonation. In N. T. Edgar & J. B. Saunders (Eds.), Initial Reports of the Deep Sea Drilling Project, 13:685-704. Washington: U. S. Government Printing Office.
Bukry, D. 1978. Cenozoic coccolith and silicoflagellate stratigraphy, offshore northwest Africa, Deep Sea Drilling Project, Leg 41. In Y. Lancelot & E. Seibold (Eds.), Initial Reports of the Deep Sea Drilling Project, 41:689-708. Washington: U. S. Government Printing Office.
Bukry, D. 1985. Mid-Atlantic Ridge Coccolith and Silicoflagellate Biostratigraphy, Deep Sea Drilling Project Sites 558 and 563. In: Bougault, H., Cande, S. C. (Eds.). Initial Reports of the Deep Sea Drilling Project, 82:591-603. Washington: U. S. Government Printing Office.
Bukry, D., and Foster, J.H. 1973. Silicoflagellate and Diatom Stratigraphy, Leg 16, Deep Sea Drilling Project. In: van Andel, T.H. & Heath, G.R. (Eds.).Initial Reports of the Deep Sea Drilling Project, 16:747-813. Washington: U. S. Government Printing Office.
Burns, D. A. 1975. Nannofossil biostratigraphy for Antarctic sediments, Leg 28, Deep Sea Drilling Project. In D. E. Hayes & L. A. Frakes (Eds.), Initial Reports of the Deep Sea Drilling Project, 28:589-598. Washington: U. S. Government Printing Office.
Cande, S. C., and Kent, D. V. 1992. A new geomagnetic polarity time scale for the Late Cretaceous and Cenozoic. Journal of Geophysical Research, 97:13,917-13,951.
Cande, S.C. and Kent, D.V. 1995. Revised calibration of the geomagnetic polarity timescale for the Late Cretaceous and Cenozoic. Journal of Geophysical Research, 100:6093-6095.
Canninga, G., Zijderveld, J. D. A., and van Hinte, J. E. 1987. Late Cenozoic magnetostratigraphy of Deep Sea Drilling Project Hole 603C, Leg 93, on the North American continental rise off Cape Hatteras. In J. E. van Hinte & S. W. Wise (Eds.), Initial Reports of the Deep Sea Drilling Project, 93:839-848. Washington: U. S. Government Printing Office.
Caulet, J. P. 1986. Radiolarians from the southwest Pacific. In J. P. Kennett & C. C. von der Borch (Eds.), Initial Reports of the Deep Sea Drilling Project, 90:835-861. Washington: U. S. Government Printing Office.
Caulet, J. P. 1991. Radiolarians from the Kerguelen Plateau, Leg 119. In: Barron, J., Larsen, B. (Eds.). Proceedings of the Ocean Drilling Program, Scientific Results, 119:513-542. College Station, TX: Ocean Drilling Program.
Chaisson, W. P., and Leckie, R. M. 1993. High-resolution Neogene Planktonic Foraminifer Biostratigraphy of Site 806, Ontong Java Plateau (Western Equatorial Pacific). In: Berger, W. H., Kroenke, L. W. (Eds.). Proceedings of the Ocean Drilling Program, Scientific Results, 130:137-178. College Station, TX: Ocean Drilling Program.
Chen, P. H. 1975. Antarctic radiolaria. In Initial Reports of the Deep Sea Drilling Project, 28:437-513. Washington: U. S. Government Printing Office.
Ciampo, G. 1992. Late Miocene (CN9B subzone) to Holocene calcareous nannofossils from the western and northwestern Pacific Ocean, Leg 125. In: P. Fryer, J.A. Pearce, & Stokking, L.B. (Eds.) Proceedings of the Ocean Drilling Program Scientific Results, 125:15-41. College Station, TX: Ocean Drilling Program.
Ciesielski, P. F. 1983. The Neogene and Quaternary diatom biostratigraphy of subantarctic sediments, Deep Sea Drilling Project Leg 71. In W. J. Ludwig & V. A. Krasheninnikov (Eds.), Initial Reports of the Deep Sea Drilling Project, 71:635-666. Washington: U. S. Government Printing Office.
Ciesielski, P. F. 1986. Middle Miocene to Quaternary diatom biostratigraphy of Deep Sea Drilling Project Site 594, Chatham Rise, southwest Pacific. In J. P. Kennett & C. C. von der Borch (Eds.), Initial Reports of the Deep Sea Drilling Project, 90:863-886. Washington: U. S. Government Printing Office.
Clement, B. M., and Robinson, F. 1987. The magnetostratigraphy of Leg 94 sediments. In W. F. Ruddiman & R. B. Kidd (Eds.), Initial Reports of the Deep Sea Drilling Project, 94:635-650. Washington: U. S. Government Printing Office.
Clement, B. M., Hall, F. J., and Jarrard, R. D. 1989. The Magnetostratigraphy of Ocean Drilling Program Leg 105 Sediments. In: Srivastava, S. P., Arthur, M.A., Clement, B. (Eds.). Proceedings of the Ocean Drilling Program, Scientific Results, 105:583-595. College Station, TX: Ocean Drilling Program.
Crux, J.A. 1991. Calcareous nannofossils recovered by Leg 114 in the subantarctic South Atlantic Ocean. In P.F. Ciesielski, Y. Kristoffersen, et al. (Eds.), Proceedings of the Ocean Drilling Program, Scientific Results, 114:155-177. College Station, TX: Ocean Drilling Program.
Delaney, M.L., and Boyle, E.A. 1988. Tertiary paleoceanic chemical variability: unintended consequences of simple geochemical models. Paleoceanography, 3:137-156.
Dinkelmann, M.G. 1973. Radiolarian Straitigraphy: Leg 16., Deep Sea Drilling Project. In: van Andel, T.H. & Heath, G.R. (Eds.).Initial Reports of the Deep Sea Drilling Project, 16:747-813. Washington: U. S. Government Printing Office.
Echols, R. J. 1973. Foraminifera, Leg 19 Deep Sea Drilling Project. In J. S. Creager & D. W. Scholl (Eds.), Initial Reports of the Deep Sea Drilling Project, 19:721-737. Washington: U. S. Government Printing Office.
Edwards, A. R., and Perch-Nielsen, K. 1975. Calcareous nannofossils from the southern southwest Pacific, Deep Sea Drilling Project, Leg 29. In J. P. Kennett & R. E. Houtz (Eds.), Initial Reports of the Deep Sea Drilling Project, 29:469-540. Washington: U. S. Government Printing Office.
Ellis, C. H. 1975. Calcareous nannofossil biostratigraphy - Leg 31, DSDP. In D. E. Karig & J. C. Ingle Jr. (Eds.), Initial Reports of the Deep Sea Drilling Project, 31:655-676. Washington: U. S. Government Printing Office.
Ellis, C. H. 1982. Calcareous nannoplankton biostratigraphy - Deep Sea Drilling Project Leg 60. In D. M. Hussong & S. Uyeda (Eds.), Initial Reports of the Deep Sea Drilling Project, 60:507-536. Washington: U. S. Government Printing Office.
Farrell, J.W. and T.R. Janecek 1991. Late Neogene paleoceanography and paleoclimatology of the northeast Indian Ocean (Site 758). Proceedings of the Ocean Drilling Program, Scientific Results, 121:297-355, College Station TX.
Fenner, J. 1978. Cenozoic Diatom Biostratigraphy of the Equatorial and Southern Atlantic Ocean. In: Supko, P.R., Perch-Nielsen, K. (Eds.). Initial Reports of the Deep Sea Drilling Project, 39 supplement: 491-624. Washington: U. S. Government Printing Office.
Fenner, J. 1984. Eocene-Oligocene planktic diatom stratigraphy in the low latitudes and the high southern latitudes. Micropaleontology, 30:319-342.
Fenner, J. 1991. Taxonomy, stratigraphy, and paleoceanographic implications of Paleocene diatoms. In P.F. Ciesielski, Y. Kristoffersen, et al. (Eds.), Proceedings of the Ocean Drilling Program, Scientific Results, 114:123-154. College Station, TX: Ocean Drilling Program.
Fenner, J., and Mikkelsen, N. 1990. Eocene-Oligocene Diatoms in the Western Indian Ocean: Taxonomy, Stratigraphy, and Paleoecology. In: Duncan, R. A., Backman, J., Peterson, L. C. (Eds.). Proceedings of the Ocean Drilling Program, Scientific Results, 115:395-409. College Station, TX: Ocean Drilling Program.
Firth, J. V. 1989. Eocene and Oligocene Calcareous Nannofossils from the Labrador Sea, ODP Leg 105. In: Srivastava, S. P., Arthur, M.A., Clement, B. (Eds.). Proceedings of the Ocean Drilling Program, Scientific Results, 105:263-286. College Station, TX: Ocean Drilling Program.
Galbrun, B. 1992. Magnetostratigraphy of Upper Cretaceous and Lower Tertiary Sediments, Sites 761 and 762, Exmouth Plateau, Northwest Australia. In: von Rad, U., Haq, B. U. (Eds.). Proceedings of the Ocean Drilling Program, Scientific Results, 122:699-716. College Station, TX: Ocean Drilling Program.
Gartner, S., and Chow, J. 1985. Calcareous nannofossil biostratigraphy, Deep Sea Drilling Project Leg 85, eastern Equatorial Pacific. In L. Mayer & F. Theyer (Eds.), Initial Reports of the Deep Sea Drilling Project, 85:609-620. Washington: U. S. Government Printing Office.
Gartner, S., Jr. 1973. Calcareous nannofossil age determinations, Deep Sea Drilling Project, Leg 13. In W. B. F. Ryan & K. J. Hsü (Eds.), Initial Reports of the Deep Sea Drilling Project, 13:822-828. Washington: U. S. Government Printing Office.
Gartner, S., Jr. 1974. Nannofossil Biostratigraphy, Leg 22, Deep Sea Drilling Project. In: von der Borch, C. C., Sclater, J. G. (Eds.). Initial Reports of the Deep Sea Drilling Project, 22:577-599. Washington: U. S. Government Printing Office.
Gartner, S., Wei, W., and Shyu, J. P. 1994. Neogene Calcareous Nannofossil Biostratigraphy at ODP Sites 812 through 818. In: McKenzie, J. A., Davies, J. A. (Eds.). Proceedings of the Ocean Drilling Program, Scientific Results, 133:3-18. College Station, TX: Ocean Drilling Program.
Gersonde, R., and Burckle, L. 1990. Neogene diatom biostratigraphy of ODP Leg 113, Weddell Sea (Antarctic Ocean). In P. Barker, J. P. Kennett, et al. (Eds.), Proceedings of the Ocean Drilling Program, Scientific Results, 113:761-790. College Station, TX: Ocean Drilling Program.
Gersonde, R., and Burckle, L. H., 1990. Neogene Diatom Biostratigraphy of ODP Leg 113, Weddell Sea (Antartic Ocean). In: Barker, P. F., Kennett, J. P. (Eds.). Proceedings of the Ocean Drilling Program, Scientific Results, 113:761-789. College Station, TX: Ocean Drilling Program.
Goll, R. M., and Bjørklund, K. R. 1989. A new radiolarian biostratigraphy of Norwegian Sea sediments: ODP Leg 104. In O. Eldholm,J. Thiede, & E. Taylor (Eds.), Proceedings of the Ocean Drilling Program, Scientific Results, 104:697-738. College Station, TX: Ocean Drilling Program.
Gombos, A. M. Jr. 1983. Survey of Diatoms in the Upper Oligocene and Lower Miocene in Holes 515B and 516F. In: Barker, P. F., Carlson, R. L., Johnson, D. A. (Eds.). Initial Reports of the Deep Sea Drilling Project, 72:793-804. Washington: U. S. Government Printing Office.
Gombos, A. M. Jr., and Ciesielski, P. F. 1983. Late Eocene to Early Miocene Diatoms from the Southwest Atlantic. In: Ludwig, W. J., Krasheninnikov, V. A. (Eds.). Initial Reports of the Deep Sea Drilling Project, 71:583-634. Washington: U. S. Government Printing Office.
Gombos, A. M., Jr. 1987. Middle Eocene Diatoms from the North Atlantic, Deep Sea Drilling Project Site 605. In: van Hinte, J. E., Wise, S. W., Jr. (Eds.). Initial Reports of the Deep Sea Drilling Project, 93:793-814. Washington: U. S. Government Printing Office.
Gombos, A.M., Jr. 1984. Late Paleocene diatoms in the Cape Basin. In K. J. Hsü & J. L. LaBrecque (Eds.), Initial Reports of the Deep Sea Drilling Project, 73:495-511. Washington: U. S. Government Printing Office.
Gradstein, F.,, Agterberg, F.P., Brower, and Schwarzacher, W. 1985. Quantitative Stratigraphy, Reidel-Unesco Publ.
Hailwood, E.A., and Clement, B.M. 1991. Magnetostrtatigraphy of Sites 699 and 700, East Georgia Basin. In P.F. Ciesielski, Y. Kristoffersen, et al. (Eds.), Proceedings of the Ocean Drilling Program, Scientific Results, 114:337-357. College Station, TX: Ocean Drilling Program.
Hailwood, E.A., and Clement, B.M. 1991. Magnetostrtatigraphy of Sites 703 and 704, Meteor Rise, southeastern South Atlantic. In P.F. Ciesielski, Y. Kristoffersen, et al. (Eds.), Proceedings of the Ocean Drilling Program, Scientific Results, 114:367-386. College Station, TX: Ocean Drilling Program.
Hamano, Y., Krumsiek, K. A. O., Vigliotti, L., and Wippern, J. J. M. 1992. Pliocene-Pleistocene Magnetostratigraphy of Sediment Cores from the Japan Sea. In: Pisciotto, K. A., Ingle, J. C. (Eds.). Proceedings of the Ocean Drilling Program, Scientific Results, 127:969-982. College Station, TX: Ocean Drilling Program.
Haq, B.U., J. Hardenbol, and P.R. Vail 1987. Chronology of fluctuating sea levels since the Triassic (250 million years ago to present). Science, 235:1156-1167.
Harper, H. E., Jr. 1980. Diatom biostratigraphy of Sites 434, 435, and 436, northwestern Pacific, Leg 56, Deep Sea Drilling Project. In Scientific Party, Initial Reports of the Deep Sea Drilling Project, 56, 57 pt. 2:633-640. Washington: U. S. Government Printing Office.
Harper, H. E., Jr. 1982. Diatom biostratigraphy of Sites 495, 496, and 497, Deep Sea Drilling Project Leg 67. In J. Aubouin & R. von Huene (Eds.), Initial Reports of the Deep Sea Drilling Project, 67:447-454. Washington: U. S. Government Printing Office.
Harwood, D. M., and Maruyama, T. 1992. Middle Eocene to PeistocenePleistocene diatom biostratigraphy of Southern Ocean sediments from the Kerguelen Plateau, Leg 120. In S. W. Wise & R. Schlich (Eds.), Proceedings of the Ocean Drilling Program, Scientific Results, 120:683-733. College Station, TX: Ocean Drilling Program.
Harwood, D., Lazarus, D. B., Aubry, M., Berggren, W. A., Heider, F., Inokuchi, H., and Maruyama, T. 1992. Neogene stratigraphic synthesis, ODP Leg 120. In W. Wise, R. Schlich,S. O'Connell, et al. (Eds.), Proceedings of the Ocean Drilling Program, Scientific Results, 120:1031-1052. College Station, TX: Ocean Drilling Program.
Hay, W.W. 1972. Probabilistic stratigraphy, Eclogae Geol. Helv., 65:255-266.
Hayashida, A. and Bloemendal, J. 1991. Magnetostratigraphy of ODP Leg 117 sediments from the Owen Ridge and the Oman Margin, western Arabian Sea. In: W.L. Prell and N. Niitsuma (Eds.), Proceedings of the Ocean Drilling Program Scientific Results, 117:161-179. College Station, TX: Ocean Drilling Program.
Hays, J. D. 1970. Stratigraphy and evolutionary trends of radiolaria in North Pacific deep-sea sediments. In Geological Society of America Memoirs, 126:185-218. Geological Society of America.
Hays, J. D., and Opdyke, N. D. 1967. Antarctic radiolaria, magnetic reversals, and climate change. Science, 158:1001-1011.
Hays, J.D., and N.J. Shackleton 1976. Globally synchronous extinction of the radiolarian Stylatractus universus, Geology, 4:649-652.
Heath, G. R., Rea, D. H., and Levi, S. 1985. Paleomagnetism and accumulation rates of sediments at Sites 576 and 578, Deep Sea Drilling Project Leg 86, Western North Pacific. In G. R. Heath & L. H. Burkle (Eds.), Initial Reports of the Deep Sea Drilling Project, 86:459-502. Washington: U. S. Government Printing Office.
Heider, F., Leitner, B., and Inokuchi, H. 1992. High Southern Latitude Magnetostratigraphy and Rock Magnetic Properties of Sediments from Sites 748 and 750, Leg 120. In: Wise, S. W., Schlich, R. (Eds.). Proceedings of the Ocean Drilling Program, Scientific Results, 120:225-245. College Station, TX: Ocean Drilling Program.
Heiman, M.E. 1981. Oligocene to Quaternary Foraminifers from the Philippine Sea, Deep Sea Drilling Project Leg 59. In: Kroenke, L., Scott, R. (Eds.). Initial Reports of the Deep Sea Drilling Project, 59:567-579. Washington: U. S. Government Printing Office.
Heiman, M.E., Frerichs, W.E., Vincent, E. 1974. Paleogene Planktonic Foraminifera from the Western Tropical Indian Ocean, Deep Sea Drilling Project, Leg 24. In: Fisher, R.L., Bruce, E.T. (Eds.). Initial Reports of the Deep Sea Drilling Project, 22:851-857. Washington: U. S. Government Printing Office.
Hodell, D.A., Benson, R.H., Kent, D.V., Boersma, A., and Rakic-El Bied, K. 1994. Magnetostratigraphic, biostratigraphic, and stable isotope biostratigraphy of an upper Miocene drill core from the Salé Briqueterie (northwestern Morocco): A high-resolution chronology for the Messinian stage. Paleoceanography, 9:835-856.
Holdsworth, B. K. 1975. Cenozoic Radiolaria biostratigraphy: Leg 30: tropical and equatorial Pacific. In J. E. Andrews & G. Packham (Eds.), Initial Reports of the Deep Sea Drilling Project, 30:499-538. Washington: U. S. Government Printing Office.
Hsü, K.J., Montadert, L., et al. 1978. Introduction and explanatory notes. Initial Reports of the Deep Sea Drilling Project, 42/1:3-26. Washington: U. S. Government Printing Office.
Huber, B. T. 1991. Paleogene and Early Neogene Planktonic Foaraminifer Biostratigraphy of Sites 738 and 744, Kerguelen Plateau ( Southern Indian Ocean). In: Barron, J., Larsen, B. (Eds.). Proceedings of the Ocean Drilling Program, Scientific Results, 119:427-449. College Station, TX: Ocean Drilling Program.
Huddlestun, P. F. 1984. Planktonic foraminiferal biostratigraphy, Deep Sea Drilling Project Leg 81. In D. G. Roberts & D. Schnitker (Eds.), Initial Reports of the Deep Sea Drilling Project, 81:429-438. Washington: U. S. Government Printing Office.
Ingle, J. C., Jr. 1973. Neogene foraminifera from the northeastern Pacific Ocean, Leg 18, Deep Sea Drilling Project. In L. D. Kulm & R. von Huene (Eds.), Initial Reports of the Deep Sea Drilling Project, 18:517-567. Washington: U. S. Government Printing Office.
Inokuchi, H., and Heider, F. 1992. Magnetostratigraphy of sediments from Sites 748 and 750, Leg 120. In: Wise, S. W., Schlich, R. (Eds.). Proceedings of the Ocean Drilling Program, Scientific Results, 120:247-253. College Station, TX: Ocean Drilling Program.
Jablonski, D. 1993. The tropics as a source of evolutionary novelty through geological time. Nature, 364:142-144.
Jenkins, D. G. 1975. Cenozoic planktonic foraminiferal biostratigraphy of the southwestern Pacific and Tasman Sea - DSDP Leg 29. In J. P. Kennett & R. E. Houtz (Eds.), Initial Reports of the Deep Sea Drilling Project, 29:449-468. Washington: U. S. Government Printing Office.
Jenkins, D. G. 1978. Neogene planktonic foraminifers from DSDP Leg 40 Sites 360 and 362 in the southeastern Atlantic. In H. M. Bolli & W. B. F. Ryan (Eds.), Initial Reports of the Deep Sea Drilling Project, 40:723-740. Washington: U. S. Government Printing Office.
Jenkins, D. G. 1987. Middle Eocene to Miocene Planktonic Foraminifers from Deep Sea Drilling Project Sites 608 and 610, Northeastern Atlantic. In: Ruddiman, W. F., Kidd, R. B., Thomas, E. (Eds.). Initial Reports of the Deep Sea Drilling Project, 94:605-611. Washington: U. S. Government Printing Office.
Jenkins, D. G., and Srinivasan, M. S. 1986. Cenozoic planktonic foraminifers from the Equator to the Sub-Antarctic of the Southwest Pacific. In J. P. Kennett & C. C. von der Borch (Eds.), Initial Reports of the Deep Sea Drilling Project, 90:795-834. Washington: U. S. Government Printing Office.
Jiang, M.-J., and Gartner, S. 1984. Neogene and Quaternary calcareous nannofossil biostratigraphy of the Walvis Ridge. In T. C. Moore Jr. & P. D. Rabinowitz (Eds.), Initial Reports of the Deep Sea Drilling Project, 74:561-598. Washington: U. S. Government Printing Office.
Johnson, D. A. 1974. Radiolaria from the eastern Indian Ocean, DSDP Leg 22. In C. C. von der Borch & J. G. Sclater (Eds.), Initial Reports of the Deep Sea Drilling Project, 22:521-576. Washington: U. S. Government Printing Office.
Johnson, D. A. 1976. Cenozoic radiolarians from the central Pacific, DSDP Leg 33. In S. O. Schlanger & E. D. Jackson (Eds.), Initial Reports of the Deep Sea Drilling Project, 33:425-438. Washington: U. S. Government Printing Office.
Johnson, D. A. 1978. Cenozoic radiolaria from the eastern tropical Atlantic, DSDP, Leg 41. In Y. Lancelot & E. Seibold (Eds.), Initial Reports of the Deep Sea Drilling Project, 41:763-790. Washington: U. S. Government Printing Office.
Johnson, D. A. 1990. Radiolarian Biostratigraphy in the Central Indian Ocean, Leg 115. In: Duncan, R. A., Backman, J., Peterson, L. C. (Eds.). Proceedings of the Ocean Drilling Program, Scientific Results, 115:395-409. College Station, TX: Ocean Drilling Program.
Johnson, D. A., and Nigrini, C. A. 1985. Synchronous and time-transgressive Neogene radiolarian datum levels in the equatorial Indian and Pacific Oceans. Marine Micropaleontology, 9:489-523.
Jousé, A. P., Kazarina, G. K., and Mukhina, V. V. 1982. Distribution of Diatoms in Pliocene and Pleistocene Deposits from the Middle America Trench Off Guatemala. In: Aubouin, J., von Huene, R. (Eds.). Initial Reports of the Deep Sea Drilling Project, 67:455- 471. Washington: U. S. Government Printing Office.
Kammer, Baumiller, and Ausich 1997. Species longevity as a function of niche breadth: Evidence from fossil crinoids. Geology, 25:219-222.
Kaneps, A. G. 1973. Cenozoic planktonic Foraminifera from the eastern equatorial Pacific, Leg 16, Deep Sea Drilling Project. In T. H. van Andel & G. R. Heath (Eds.), Initial Reports of the Deep Sea Drilling Project, 16:713-746. Washington: U. S. Government Printing Office.
Kaneps, A. G. 1975. Cenozoic planktonic foraminifera from Antarctic deep-sea sediments. In D. E. Hayes & L. A. Frakes (Eds.), Initial Reports of the Deep Sea Drilling Project, 28:573-584. Washington: U. S. Government Printing Office.
Keating, B. H., and Sakai, H. 1991. Magnetostratigraphic Studies of Sediments from Site 744, Southern Kerguelen Plateau. In: Barron, J., Larsen, B. (Eds.). Proceedings of the Ocean Drilling Program, Scientific Results, 119:771-794. College Station, TX: Ocean Drilling Program.
Keigwin, L. D., Jr. 1982. Neogene planktonic foraminifers from Deep Sea Drilling Project Sites 502 and 503. In W. L. Prell & J. V. Gardner (Eds.), Initial Reports of the Deep Sea Drilling Project, 68:269-288. Washington: U. S. Government Printing Office.
Keller, G. 1980. Planktonic foraminiferal biostratigraphy and paleoceanography of the Japan Trench, Leg 57, Deep Sea Drilling Project. In Scientific Party, Initial Reports of the Deep Sea Drilling Project, 56, 57 pt. 2:809-834. Washington: U. S. Government Printing Office.
Keller, G. and J.A. Barron 1983. Paleoceanographic implications of Miocene deep-sea hiatuses. Geological Society of America Bulletin, 94:590-613.
Keller, G. and J.A. Barron 1987. Paleodepth distribution of Neogene deep-sea hiatuses. Paleoceanography, 2:697-713.
Kennett, J.P., and Barker, P.F. 1990. Latest Cretaceous to Cenozoic climate and oceanographic developments in the Weddell Sea, Antarctica: An ocean-drilling perspective. Proc. Ocean Drill. Program, Sci. Results, 113:937-960.
Kent, D. V., and Spariosu, D. J. 1982. Magnetostratigraphy of Caribbian Site 502 hydraulic piston cores. In W. L. Prell & J. V. Gardner (Eds.), Initial Reports of the Deep Sea Drilling Project, 68:419-434. Washington: U. S. Government Printing Office.
Kent, D. V., and Spariosu, D. J. 1982. Magnetostratigraphy of equatorial Pacific Site 503 hydraulic piston cores. In W. L. Prell & J. V. Gardner (Eds.), Initial Reports of the Deep Sea Drilling Project, 68:435-440. Washington: U. S. Government Printing Office.
Kling, S. A. 1973. Radiolaria from the eastern North Pacific, Deep Sea Drilling Project, Leg 18. In L. D. Kulm & R. von Huene (Eds.), Initial Reports of the Deep Sea Drilling Project, 18:617-672. Washington: U. S. Government Printing Office.
Kling, S. A. 1982. Radiolarians from the Mariana Trough and Trench region: Deep Sea Drilling Project Leg 60. In D. M. Hussong & S. Uyeda (Eds.), Initial Reports of the Deep Sea Drilling Project, 60:537-556. Washington: U. S. Government Printing Office.
Knuttel, S., Russell, M. D., Jr., and Firth, J. V. 1989. Neogene Calcareous Nannofossils from ODP Leg 105: Implications for Pleistocene Paleoceanographic Trends. In: Srivastava, S. P., Arthur, M.A., Clement, B. (Eds.). Proceedings of the Ocean Drilling Program, Scientific Results, 105:245-262. College Station, TX: Ocean Drilling Program.
Knüttel, S. 1986. Calcareous nannofossil biostratigraphy of the central East Pacific Rise, Deep Sea Drilling Project Leg 92: evidence for downslope transport of sediments. In M. Leinen & D. K. Rea (Eds.), Initial Reports of the Deep Sea Drilling Project, 92:255-290. Washington: U. S. Government Printing Office.
Koizumi, I. 1973. The late Cenozoic diatoms of Sites 183-193, Leg 19 Deep Sea Drilling Project. In J. S. Creager & D. W. Scholl (Eds.), Initial Reports of the Deep Sea Drilling Project, 19:805-856. Washington: U. S. Government Printing Office.
Koizumi, I. 1975. Neogene diatoms from the western margin of the Pacific Ocean, Leg 31, Deep Sea Drilling Project. In D. E. Karig & J. C. Ingle Jr. (Eds.), Initial Reports of the Deep Sea Drilling Project, 31:779-820. Washington: U. S. Government Printing Office.
Koizumi, I. 1980. Neogene diatoms from the Emperor Seamount chain, Leg 55, Deep Sea Drilling Project. In E. D. Jackson & I. Koizumi (Eds.), Initial Reports of the Deep Sea Drilling Project, 55:387-408. Washington: U. S. Government Printing Office.
Koizumi, I. 1992. Diatom Biostratigraphy of the Japan Sea: Leg 127. In: Pisciotto, K. A., Ingle, J. C. (Eds.). Proceedings of the Ocean Drilling Program, Scientific Results, 127:249-289. College Station, TX: Ocean Drilling Program.
Koizumi, I., and Tanimura, Y. 1985. Neogene diatom biostratigraphy of the middle latitude western North Pacific, Deep Sea Drilling Project Leg 86. In G. R. Heath & L. H. Burkle (Eds.), Initial Reports of the Deep Sea Drilling Project, 86:269-300. Washington: U. S. Government Printing Office.
Krasheninnikov, V. A., and Basov, I. A. 1983. Cenozoic planktonic foraminifers of the Falkland Plateau and Argentine Basin, Deep Sea Drilling Project Leg 71. In W. J. Ludwig & V. A. Krasheninnikov (Eds.), Initial Reports of the Deep Sea Drilling Project, 71:821-858. Washington: U. S. Government Printing Office.
Krasheninnikov, V. A., and Pflaumann, U. 1978. Zonal stratigraphy and planktonic foraminifers of Paleogene deposits of the Atlantic Ocean to the west off Africa (Deep Sea Drlling Project, Leg 41). In Y. Lancelot & E. Seibold (Eds.), Initial Reports of the Deep Sea Drilling Project, 41:581-611. Washington: U. S. Government Printing Office.
Krasheninnikov, V. A., and Pflaumann, U. 1978. Zonal stratigraphy of Neogene deposits of the eastern part of the Atlantic Ocean by means of planktonic foraminifers, Leg 41, Deep Sea Drilling Project. In Y. Lancelot & E. Seibold (Eds.), Initial Reports of the Deep Sea Drilling Project, 41:613-658. Washington: U. S. Government Printing Office.
Kroon, D. 1994. Some Planktonic Foraminiferal Datum Levels During the Last 10.4 Ma, Leg 133. In: McKenzie, J. A., Davies, J. A. (Eds.). Proceedings of the Ocean Drilling Program, Scientific Results, 133:787-790. College Station, TX: Ocean Drilling Program.
Krumsiek, K., and Roberts, D. G. 1984. Paleomagnetics of Tertiary sediments from the southwest Rockall Plateau, Deep Sea Drilling Project Leg 81. In D. G. Roberts & D. Schnitker (Eds.), Initial Reports of the Deep Sea Drilling Project, 81:837-854. Washington: U. S. Government Printing Office.
Labracherie, M. 1985. Quaternary radiolarians from the Equatorial Pacific, Deep Sea Drilling Project Leg 85. In L. Mayer & F. Theyer (Eds.), Initial Reports of the Deep Sea Drilling Project, 85:499-510. Washington: U. S. Government Printing Office.
Lang, T. H., and Watkins, D. K. 1984. Cenozoic Calcareous Nannofossils from the Deep Sea Drilling Project Leg 77, Southeast Gulf of Mexico. In: Buffler, R. T., Schlager, W. (Eds.). Initial Reports of the Deep Sea Drilling Project, 77:629-648. Washington: U. S. Government Printing Office.
Lang, T.H., and Wise, S. W., Jr. 1987. Neogene and Paleocene-Maestrichtian Calcareous Nannofossil Stratigraphy, Deep Sea Drilling Project Sites 604 and 605, Upper Continental Rise off New Jersey: Sedimentation Rates, Hiatuses, and Correlations with Seismic Stratigraphy. In: van Hinte, J. E., Wise, S. W., Jr. (Eds.). Initial Reports of the Deep Sea Drilling Project, 93:661-683. Washington: U. S. Government Printing Office.
Lazarus, D. B. 1990. Middle Miocene to Recent Radiolarians from the Weddell Sea, AntarticaAntarctica, ODP Leg 113. In: Barker, P. F., Kennett, J. P. (Eds.). Proceedings of the Ocean Drilling Program, Scientific Results, 113:709-728. College Station, TX: Ocean Drilling Program.
Lazarus, D. B. 1992. Age Depth Plot and Age Maker: age depth modelling [stet] on the Macintosh series of computers. Geobyte, 71:7-13.
Lazarus, D. B. 1992b. Antarctic Neogene radiolarians from the Kerguelen Plateau, ODP Legs 119 and 120. In S. W. Wise & R. Schlich (Eds.), Proceedings of the Ocean Drilling Program, Scientific Results, 120:785-810. College Station, TX: Ocean Drilling Program.
Lazarus, D. B. 1994. The Neptune Project - developing a large relational database of marine microfossil data on a personal computer. Mathematical Geology 26:817-832.
Lazarus, D., C. Spencer-Cervato, M. Pika-Biolzi, J.P. Beckmann, K. von Salis, K., H. Hilbrecht, and H.R. Thierstein 1995a. Revised chronology of Neogene DSDP Holes from the World Ocean. Ocean Drilling Program Technical Note No. 24, 312 pp.
Lazarus, D. B., Hilbrecht, H., and Spencer-Cervato, C. 1995b. Speciation and phyletic change in Globorotalia truncatulinoides (planktonic foraminifera). Paleobiology 21:28-51.
Lazarus, D., and Pallant, A. 1989. Oligocene and Neogene Radiolarians from the Labrador Sea: ODP Leg 105. In: Srivastava, S. P., Arthur, M.A., Clement, B. (Eds.). Proceedings of the Ocean Drilling Program, Scientific Results, 105:349-380. College Station, TX: Ocean Drilling Program.
Leckie, R. M., Farnham, C., and Schmidt, M. G. 1993. Oligocene Planktonic Foraminifer Biostratigraphy of Hole 803D (Ontong Java Plateau) and Hole 628A (Little Bahama Bank), and Comparison with the Southern High Latitudes. In: Berger, W. H., Kroenke, L. W. (Eds.). Proceedings of the Ocean Drilling Program, Scientific Results, 130:113-136. College Station, TX: Ocean Drilling Program.
Leinen, M. 1977. A normative calculation technique for determining opal in deep-sea sediments. Geoch. Cosmoch. Acta, 41:671-676.
Leinen, M., Cwienk, D., Heath, G.R., Biscaye, P.E., Kolla, V., Thiede, J., and Dauphin, J.P. 1986. Distribution of biogenic silica and quartz in recent deep-sea sediments. Geology, 14:199-203.
Levinton, J. 1988. Genetics, Paleontology and Macroevolution. Cambridge University Press, Cambridge.
Ling, H. Y. 1973. Radiolaria: Leg 19 of the Deep Sea Drilling Project. In J. S. Creager & D. W. Scholl (Eds.), Initial Reports of the Deep Sea Drilling Project, 19:777-798. Washington: U. S. Government Printing Office.
Ling, H. Y. 1979. Radiolarians from the west flank of the Reykjanes Ridge, Deep Sea Drilling Project Leg 49. In B. P. Luyendyk & J. R. Cann (Eds.), Initial Reports of the Deep Sea Drilling Project, 49:583-588. Washington: U. S. Government Printing Office.
Ling, H. Y. 1980. Radiolarians from the Emperor Seamounts of the northwest Pacific: Leg 55 of the Deep Sea Drilling Project. In E. D. Jackson & I. Koizumi (Eds.), Initial Reports of the Deep Sea Drilling Project, 55:365-374. Washington: U. S. Government Printing Office.
Ling, H.Y. 1975 . Radiolaria: Leg 31 of the Deep Sea Drilling Project. In: Karig, D.E., Ingle, J.C., Jr. (Eds.) Initial Reports of the Deep Sea Drilling Project, 31:703-761. Washington: U. S. Government Printing Office.
Littke, R., Fourtanier, E., Thurow, J., and Taylor, E. 1991. Silica diagenesis and its effects on lithification of Broken Ridge deposits, central Indian Ocean. In J. Weissel, J. Peirce, et al. (Eds.), Proceedings of the Ocean Drilling Program, Scientific Results, 121:261-272. College Station, TX: Ocean Drilling Program.
Lohman, W. H. 1986. Calcareous nannoplankton biostratigraphy of the southern Coral Sea, Tasman Sea, and southwestern Pacific Ocean, Deep Sea Drilling Project Leg 90: Neogene and Quaternary. In J. P. Kennett & C. C. von der Borch (Eds.), Initial Reports of the Deep Sea Drilling Project, Leg 90, 90:763-793. Washington: U. S. Government Printing Office.
Ma'alouleh, K., and Moullade, M. 1987. Biostratigraphic and paleoenvironmental study of Neogene and Quaternary planktonic foraminifers from the lower continental rise of the New Jersey margin (western North Atlantic), Deep Sea Drilling Project Leg 93, Site 603. In J. E. van Hinte & S. W. Wise (Eds.), Initial Reports of the Deep Sea Drilling Project, 93:481-492. Washington: U. S. Government Printing Office.
Madile, M., and Monechi, S. 1991. Late Eocene to early Oligocene calcareous nannofossil assemblages from Sites 699 and 703, subantarctic South Atlantic Ocean. In P.F. Ciesielski, Y. Kristoffersen, et al. (Eds.), Proceedings of the Ocean Drilling Program, Scientific Results, 114:179-192. College Station, TX: Ocean Drilling Program.
Manivit, H. 1989. Calcareous nannofossil biostratigraphy of Leg 108 sediments. In: W. Ruddiman & M. Sarnthein (Eds.). Proceedings of the Ocean Drilling Program Scientific Results, 108:35-69. College Station, TX: Ocean Drilling Program.
Martini, E. 1976. Cretaceous to Recent calcareous nannoplankton from the central Pacific Ocean (DSDP Leg 33). In S. O. Schlanger & E. D. Jackson (Eds.), Initial Reports of the Deep Sea Drilling Project, 33:439-450. Washington: U. S. Government Printing Office.
Martini, E. 1979. Calcareous nannoplankton and silicoflagellate biostratigraphy at Reykjanes Ridge, northeastern North Atlantic (DSDP Leg 49, Sites 407 and 409). In B. P. Luyendyk & J. R. Cann (Eds.), Initial Reports of the Deep Sea Drilling Project, 49:533-549. Washington: U. S. Government Printing Office.
Martini, E. 1981. OligocenetoOligocene to Recent Calcareous Nannoplankton from the Philippine Sea, Deep Sea Drilling Project Leg 59. In: Kroenke, L., Scott, R. (Eds.). Initial Reports of the Deep Sea Drilling Project, 59:547-565. Washington: U. S. Government Printing Office.
Martini, E. 1986. Paleogene Calcareous Nannoplankton from the Southwest Pacific Ocean, Deep Sea Drilling Project Leg 90. In: Kennett, J. P., von der Borch, C. C. (Eds.). Initial Reports of the Deep Sea Drilling Project, 90:747-761. Washington: U. S. Government Printing Office.
Martini, E., and Worsley, T. 1971. Tertiary calcareous nannoplankton from the western equatorial Pacific. In E. L. Winterer (Ed.), Initial Reports of the Deep Sea Drilling Project, 7:1471-1508. Washington: U. S. Government Printing Office.
McCollum, D. W. 1975. Diatom stratigraphy of the Southern Ocean. In D. E. Hayes & L. A. Frakes (Eds.), Initial Reports of the Deep Sea Drilling Project, 28:515-572. Washington: U. S. Government Printing Office.
McGowran, B. 1974. Foraminifera. In: von der Borch, C. C., Sclater, J. G. (Eds.). Initial Reports of the Deep Sea Drilling Project, 22:609-627. Washington: U. S. Government Printing Office.
McMillan, K.J. 1982. Radiolarians from the Southern Mexico Active Margin, Deep Sea Drilling Project Leg 66. In: Watkins, J. S., Moore, J. C. (Eds.) Initial Reports ofod the Deep Sea Drilling Project, 66:643-651. Washington: U. S. Government Printing Office.
Mikkelsen, N. 1990. Cenozoic diatom biostratigraphy and paleoceanography of the western equatorial Indian Ocean. In R. A. Duncan, J. Backman, & L. C. Peterson (Eds.), Proceedings of the Ocean Drilling Program, Scientific Results, 115:411-432. College Station, TX: Ocean Drilling Program.
Miller, K. G., and Hart, M. B. 1987. Cenozoic Planktonic Foraminifers and Hiatuses on the New Jersey Slope and Rise: Deep Sea Drilling Project Leg 95, Northwest Atlantic. In: Poag, C. W., Watts, A. B. (Eds.). Initial Reports of the Deep Sea Drilling Project, 95:253-265. Washington: U. S. Government Printing Office.
Miller, K.G., Aubry, M.P., Khan, Melillo, Kent, D.V., and Berggren, W.A. 1985. Oligocene-Miocene biostratigraphy, magnetostratigraphy, and isotopic stratigraphy of the western North Atlantic. Geology, 13:257-261.
Miller, K.G., R.G. Fairbanks, and G.S. Mountain 1987. Tertiary oxygen isotope synthesis, sea level history, and continental margin erosion. Paleoceanography, 2:1-19.
Miller, K.G., Wright, J.D., Van Fossen, and Kent, D.V. 1994. Miocene stable isotopic stratigraphy and magnetostratigraphy of Buff Bay, Jamaica. Geol. Soc. Am. Bull., 106:1605-1620.
Miller, K.G., G.S. Mountain, the Leg 150 Shipboard Party and Members of the New Jersey Coastal Plain Drilling Project 1996. Drilling and dating New Jersey Oligocene-Miocene sequences: ice volume, global sea level and Exxon records. Science, 271:1092-1095.
Milner, G.J. 1992. Middle Eocene to early Oligocene foraminifers from the Izu-Bonin forearc, Hole 786A. In: P. Fryer, J.A. Pearce, & Stokking, L.B. (Eds.) Proceedings of the Ocean Drilling Program Scientific Results, 125:71-90. College Station, TX: Ocean Drilling Program.
Monechi, S. 1985. Campanian to Pleistocene calcareous nannofossil stratigraphy from the northwest Pacific Ocean, Deep Sea Drilling Project Leg 86. In G. R. Heath & L. H. Burkle (Eds.), Initial Reports of the Deep Sea Drilling Project, 86:301-336. Washington: U. S. Government Printing Office.
Moore, T.C., Jr. 1972. DSDP: successes, failures, proposals. Geotimes, 17 (July):27-31.
Moore, T.C. Jr, T.H. Van Andel, C. Sancetta, and N. Pisias 1978. Cenozoic hiatuses in pelagic sediments. Micropaleontology, 24:113-138.
Morley, J. J. 1985. Radiolarians from the Northwest Pacific, Deep Sea Drilling Project Leg 86. In G. R. Heath & L. H. Burckle (Eds.), Initial Reports of the Deep Sea Drilling Project, 86:399-421. Washington: U. S. Government Printing Office.
Mortlock, R.A., and Froelich, P.N. 1989. A simple method for the rapid determination of biogenic opal in pelagic marine sediments. Deep-Sea Res., Part A, 36, 1415-1426.
Müller, C. 1979. Calcareous Nannofossils from the North Atlantic (Leg 48). In: Montadert, L., Roberts, D.G. (Eds.). Initial Reports of the Deep Sea Drilling Project, 48:589-620. Washington: U. S. Government Printing Office.
Müller, C. 1985. Biostratigraphic and paleoenvironmental interpretation of the Goban Spur region based on a study of calcareous nannoplankton. In P. C. Graciansky & C. W. Poag (Eds.), Initial Reports of the Deep Sea Drilling Project, 80:573-600. Washington: U. S. Government Printing Office.
Müller, G., and Gastner, M. 1971. The "Karbonat Bombe", a simple device for the determination of the carbonate content in sediments, soils and other materials. Neues Jahrb. Mineral. Monatsch., 10:466-469.
Muza, J. P., Wise, S. W., and Covington, J. M. 1987. Neogene calcareous nannofossils from Deep Sea Drilling Project Site 603, lower continental rise, western North Atlantic: biostratigraphy and correlations with magnetic and seismic stratigraphy. In J. E. van Hinte & S. W. Wise (Eds.), Initial Reports of the Deep Sea Drilling Project, 93:593-616. Washington: U. S. Government Printing Office.
Muzylöv, N. 1982. Nannoplankton stratigraphy of Leg 67 drill sites. In J. Aubouin & R. von Huene (Eds.), Initial Reports of the Deep Sea Drilling Project, 67:401-425. Washington: U. S. Government Printing Office.
Nigrini, C. 1991. Composition and biostratigraphy of radiolarian assemblages from an area of upwelling (northwestern Arabian Sea, Leg 117). In W. L. Prell & N. Niitsuma (Eds.), Proceedings of the Ocean Drilling Program, Scientific Results, 117:89-126. College Station, TX: Ocean Drilling Program.
Nigrini, C. 1991. Composition and biostratigraphy of radiolarian assemblages from an area of upwelling (northwestern Arabian Sea, Leg 117). In: W.L. Prell and N. Niitsuma (Eds.), Proceedings of the Ocean Drilling Program Scientific Results, 117:89-126. College Station, TX: Ocean Drilling Program.
Nigrini, C. A. 1985. Radiolarian biostratigraphy in the central Equatorial Pacific, Deep Sea Drilling Project Leg 85. In L. Mayer & F. Theyer (Eds.), Initial Reports of the Deep Sea Drilling Project, 85:511-553. Washington: U. S. Government Printing Office.
Nishi, H. and Chaproniere G.C.H. 1994. Eocene-Oligocene subtropical planktonic foraminifera at Site 841. In: J. Hawkins, L. Parson, & J. Allan (Eds.), Proceedings of the Ocean Drilling Program Scientific Results, 135:245-266. College Station, TX: Ocean Drilling Program.
Nishimura, A. 1987. Cenozoic radiolaria in the western North Atlantic, Site 603, Leg 93 of the Deep Sea Drilling Project. In J. E. van Hinte & S. W. Wise (Eds.), Initial Reports of the Deep Sea Drilling Project, 93:685-698. Washington: U. S. Government Printing Office.
Nocchi, M., Amici, E., and Premoli Silva, I. 1991. Planktonic foraminiferal biostratigraphy and paleoenvironmental interpretation of Paleogene faunas from the subantarctic transect, Leg 114. In P.F. Ciesielski, Y. Kristoffersen, et al. (Eds.), Proceedings of the Ocean Drilling Program, Scientific Results, 114:233-279. College Station, TX: Ocean Drilling Program.
Okada, H. 1980. Calcareous Nannofossils from the Deep Sea Drilling Project Sites 442 through 446, Philippine Sea. In: deVries Klein, G., Kobayashi, K. (Eds.). Initial Reports of the Deep Sea Drilling Project, 58:549-585. Washington: U. S. Government Printing Office.
Okada, H. 1990. Quaternary and Paleogene Calcareous Nannofossils, Leg 115. In: Duncan, R. A., Backman, J., Peterson, L. C. (Eds.). Proceedings of the Ocean Drilling Program, Scientific Results, 115:129-174. College Station, TX: Ocean Drilling Program.
Okada, H., and Thierstein, H.R. 1979. Calcareous Nannoplankton- Leg 43, Deep Sea Drilling Project. In: Tucholke, B.E., Vogt, P.R. (Eds.). Initial Reports of the Deep Sea Drilling Project, 43:507-573. Washington: U. S. Government Printing Office.
Palmer, A. A. 1987. Cenozoic Radiolarians from the Deep Sea Drilling Project Sites 612 and 613 (Leg 95, New Jersey Transect) and Atlantic Slope Site ASP 15. In: Poag, C. W., Watts, A. B. (Eds.). Initial Reports of the Deep Sea Drilling Project, 95:339-357. Washington: U. S. Government Printing Office.
Parker, M. E., Clark, M., and Wise, S. W., Jr. 1985. Calcareous Nannofossils of the Deep Sea Drilling Project Sites 558 and 563, North Atlantic Ocean: Biostratigraphy and the Distribution of Oligocene Braarudosphaerids. In: Bougault, H., Cande, S. C. (Eds.). Initial Reports of the Deep Sea Drilling Project, 82:559-589. Washington: U. S. Government Printing Office.
Perch-Nielsen, K. 1977. Albian to Pleistocene Calcareous Nannofossils from the Western South Atlantic, DSDP Leg 39. In: Supko, P.R., Perch-Nielsen, K. (Eds.). Initial Reports of the Deep Sea Drilling Project, 39:699-823. Washington: U. S. Government Printing Office.
Perch-Nielsen, K. 1985. Mesozoic calcareous nannofossils. In: Plankton stratigraphy, edited by Bolli, H.M., Saunders, J.B. & Perch-Nielsen, K., 329-426.
Percival, S. F., Jr. 1984. Late Cretaceous to Pleistocene calcareous nannofossils from the South Atlantic, Deep Sea Drilling Project Leg 73. In K. J. Hsü & J. L. LaBrecque (Eds.), Initial Reports of the Deep Sea Drilling Project, 73:391-424. Washington: U. S. Government Printing Office.
Perembo, R. C. B. 1994. Miocene to Pliocene Planktonic Foraminifers from the North Aoba Basin, Site 832. In: Green, H. G., Collot, J.-Y. (Eds.). Proceedings of the Ocean Drilling Program, Scientific Results, 134:247-263. College Station, TX: Ocean Drilling Program.
Petrushevskaya, M. G. 1975. Cenozoic radiolarians of the Antarctic Deep Sea Drilling Project Leg 29. In J. P. Kennett & R. E. Houtz (Eds.), Initial Reports of the Deep Sea Drilling Project, 29:541-676. Washington: U. S. Government Printing Office.
Pisias, N.G., and Moore, T.C. Jr. 1978. Cenozoic Radiolarians from Deep Sea Drilling Project Leg 40. In: Bolli, H.M., Ryan, W.B.F.(Eds.). Initial Reports of the Deep Sea Drilling Project, 40:845-856. Washington: U. S. Government Printing Office.
Poore, R. Z. 1979. Oligocene through Quaternary planktonic foraminiferal biostratigraphy of the North Atlantic. In B. P. Luyendyk & J. R. Cann (Eds.), Initial Reports of the Deep Sea Drilling Project, 49:447-518. Washington: U. S. Government Printing Office.
Miocene through Quaternary planktonic foraminifers from offshore Southern California and Baja California. In R. S. Yeats & B. U. Haq (Eds.), Initial Reports of the Deep Sea Drilling Project, 63:415-436. Washington: U. S. Government Printing Office.
Poore, R. Z. 1984. Middle Eocene through Quaternary planktonic foraminifers from the southern Angola Basin, Deep Sea Drilling Project Leg 73. In K. J. Hsü & J. L. LaBrecque (Eds.), Initial Reports of the Deep Sea Drilling Project, 73:429-448. Washington: U. S. Government Printing Office.
Pospichal, J. J., and Wise, S. W. 1990. Paleocene to Middle Eocene Calcareous Nannofossils of ODP Sites 689 and 690, Maud Rise, Weddell Sea. In: Barker, P. F., Kennett, J. P. (Eds.). Proceedings of the Ocean Drilling Program, Scientific Results, 113:613-638. College Station, TX: Ocean Drilling Program.
Premoli Silva, I., and Violanti, D. 1981. Cenozoic Planktonic Foraminifer Biostratigraphy of the Deep Sea Drilling Project Hole 462, Nauru Basin (Western Equatorial Pacific), and Distribution of the Pelagic Components. In: Larson, R.L, Schlanger, S.O. (Eds.). Initial Reports of the Deep Sea Drilling Project, 61:397-422. Washington: U. S. Government Printing Office.
Premoli-Silva, I., and Spezzaferri, S. 1990. Paleogene Planktonic Foraminifer Biostratigraphy and Paleoenvironmental Remarks on Paleogene Sediments from Indian Ocean Sites, Leg 115. In: Duncan, R. A., Backman, J., Peterson, L. C. (Eds.). Proceedings of the Ocean Drilling Program, Scientific Results, 115:277-314. College Station, TX: Ocean Drilling Program.
Calcareous Nannofossil and Planktonic Foraminifer Biostratigraphy of Hole 810C (Shatsky Rise, Northwestern Pacific). In: Natland, J. H., Storms, M. A. (Eds.). Proceedings of the Ocean Drilling Program, Scientific Results, 132:15-36. College Station, TX: Ocean Drilling Program.
Proto Decima, F., Medizza, F., and Todesco, L. 1978. SotheasternSoutheastern Atlantic Leg 40 calcareous nannofossils. In H. M. Bolli & W. B. F. Ryan (Eds.), Initial Reports of the Deep Sea Drilling Project, 40:571-634. Washington: U. S. Government Printing Office.
Pujol, C. 1983. Cenozoic planktonic foraminiferal biostratigraphy of the southwestern Atlantic (Rio Grande Rise): Deep Sea Drilling Project Leg 72. In P. F. Barker, R. L. Carlson, & D. A. Johnson (Eds.), Initial Reports of the Deep Sea Drilling Project, 72:623-675. Washington: U. S. Government Printing Office.
Pujol, C., and Duprat, J. 1983. Quaternary Planktonic Foraminifers of the Southwestern Atlantic (Rio Grande Rise), Deep Sea Drilling Project Leg 72. In: Barker, P. F., Carlson, R. L., Johnson, D. A. (Eds.). Initial Reports of the Deep Sea Drilling Project, 72:601-622. Washington: U. S. Government Printing Office.
Pujol, C., and Duprat, J. 1985. Quaternary and Pliocene Planktonic Foraminifers of the North Eastern Atlantic (Goban Spur), Deep Sea Drilling Project Leg 80. In: Graciansky, P. C. de, Poag, C. W. (Eds.). Initial Reports of the Deep Sea Drilling Project, 80:683-723. Washington: U. S. Government Printing Office.
Pujos, A. 1985. Cenozoic nannofossils, central Equatorial Pacific, Deep Sea Drilling Project Leg 85. In L. Mayer & F. Theyer (Eds.), Initial Reports of the Deep Sea Drilling Project, 85:581-608. Washington: U. S. Government Printing Office.
Pujos, A. 1985. Quaternary Nannofossils from Goban Spur, EastrenEastern North Atlantic Ocean, Deep Sea Drilling Project Holes 548 and 549A. In: Graciansky, P. C. de, Poag, C. W. (Eds.). Initial Reports of the Deep Sea Drilling Project, 80:767-792. Washington: U. S. Government Printing Office.
Quinterno, P.J. 1994. Calcareous nannofossil biostratigraphy: Sites 840 (Tonga Ridge) and 841 (Tonga Trench). In: J. Hawkins, L. Parson, & J. Allan (Eds.), Proceedings of the Ocean Drilling Program Scientific Results, 135:267-284. College Station, TX: Ocean Drilling Program.
Rahman, A. 1992. Calcareous Nannofossil Biostratigraphy of Leg 127 in the Japan Sea. In: Pisciotto, K. A., Ingle, J. C. (Eds.). Proceedings of the Ocean Drilling Program, Scientific Results, 127:171-186. College Station, TX: Ocean Drilling Program.
Ramsay, A.T.S., T.J.S. Sykes, and R.B. Kidd 1994. Waxing (and waning) lyrical on hiatuses: Eocene-Quaternary Indian Ocean hiatuses as proxy indicators of water mass production. Paleoceanography, 9:857-877.
Revelle, R. 1981. The past and future of ocean drilling. In ‘The Deep Sea Drilling Project: A decade of progress’, Warme, J.E. et al. (Eds.), SEPM Spec. Publ. 32:1-4.
Reynolds, R. A. 1980. Radiolarians from the western North Pacific, Leg 57, Deep Sea Drilling Project. In Scientific Party, Initial Reports of the Deep Sea Drilling Project, 56, 57 pt. 2:735-770. Washington: U. S. Government Printing Office.
Riedel, W. R., and Sanfilippo, A. 1971. Cenozoic radiolaria from the western tropical Pacific, Leg 7. In E. L. Winterer (Ed.), Initial Reports of the Deep Sea Drilling Project, 7:1529-1672. Washington: U. S. Government Printing Office.
Riedel, W. R., and Westberg, M. J. 1982. Neogene radiolarians from the eastern tropical Pacific and Caribbean, Deep Sea Drilling Project Leg 68. In W. L. Prell & J. V. Gardner (Eds.), Initial Reports of the Deep Sea Drilling Project, 68:289-300. Washington: U. S. Government Printing Office.
Rio, D., Fornaciari, E., and Raffi, I. 1990. Late Oligocene through Early Pleistocene Calcareous Nannofossils from Western Equatorial Indian Ocean (Leg 115). In: Duncan, R. A., Backman, J., Peterson, L. C. (Eds.). Proceedings of the Ocean Drilling Program, Scientific Results, 115:175-235. College Station, TX: Ocean Drilling Program.
Romine, K. 1986. Planktonic foraminifers from Oligocene to Pleistocene sediments, Deep Sea Drilling Project Leg 92. In M. Leinen & D. K. Rea (Eds.), Initial Reports of the Deep Sea Drilling Project, 92:291-298. Washington: U. S. Government Printing Office.
Roth, P. H. 1974. Calcareous nannofossils from the northwestern Indian Ocean, Leg 24. In R. L. Fisher & E. T. Bunce (Eds.), Initial Reports of the Deep Sea Drilling Project, 24:969-994. Washington: U. S. Government Printing Office.
Roth, P. H., and Thierstein, H. R. 1972. Calcareous nannoplankton: Leg XIV of the Deep Sea Drilling Project. In D. E. Hayes & A. C. Pimm (Eds.), Initial Reports of the Deep Sea Drilling Project, 14:421-486. Washington: U. S. Government Printing Office.
Ryan, W. B. F., and Hsü, K. J. (Eds.) 1973. Initial Reports of the Deep Sea Drilling Project. , Leg 13, Washington, D. C.: U. S. Government Printing Office.
Sager, W. W., Polgreen, E., and Rack, F. 1993. Magnetic Polarity Reversal Stratigraphy of Hole 810C, Shatsky Rise, Western Pacific Ocean. In: Natland, J. H., Storms, M. A. (Eds.). Proceedings of the Ocean Drilling Program, Scientific Results, 132:47-55. College Station, TX: Ocean Drilling Program.
Saint-Marc, P. 1987. Biostratigraphic and Paleocene Benthic and Planktonic Foraminifers, Site 605, Deep Sea Drilling Project Leg 93. In: van Hinte, J. E., Wise, S. W., Jr. (Eds.). Initial Reports of the Deep Sea Drilling Project, 93:539-547. Washington: U. S. Government Printing Office.
Saito, T. 1985. Planktonic foraminiferal biostratigraphy of eastern Equatorial Pacific sediments, Deep Sea Drilling Project Leg 85. In L. Mayer & F. Theyer (Eds.), Initial Reports of the Deep Sea Drilling Project, 85:621-654. Washington: U. S. Government Printing Office.
Sakai, H., and Keating, B. H. 1991. Paleomagnetism of Leg 119-Holes 737A, 738C, 742A, 745B, and 746A. In: Barron, J., Larsen, B. (Eds.). Proceedings of the Ocean Drilling Program, Scientific Results, 119:751-770. College Station, TX: Ocean Drilling Program.
Sakai, T. 1980. Radiolarians from Sites 434, 435, and 436, Northwest Pacific, Leg 56, Deep Sea Drilling Project. In Scientific Party, Initial Reports of the Deep Sea Drilling Project, 56, 57, part 2:695-734. Washington: U. S. Government Printing Office.
Salloway, J. C. 1983. Paleomagnetism of sediments from Deep Sea Drilling Project Leg 71. In W. J. Ludwig & V. A. Krasheninnikov (Eds.), Initial Reports of the Deep Sea Drilling Project, 71:1073-1092. Washington: U. S. Government Printing Office.
Sancetta, C. 1982. Diatom biostratigraphy and paleoceanography, Deep Sea Drilling Project Leg 68. In W. L. Prell & J. V. Gardner (Eds.), Initial Reports of the Deep Sea Drilling Project, 68:301-310. Washington: U. S. Government Printing Office.
Sanfilippo, A. and C. Nigrini 1995. Radiolarian stratigraphy across the Oligocene/ Miocene transition. Marine Micropaleontology, 24:239-285.
Sanfilippo, A., and Riedel, W. R. 1974. Radiolaria from the west-central Indian Ocean and Arabian Sea, DSDP Leg 24. In R. L. Fisher & E. T. Bunce (Eds.), Initial Reports of the Deep Sea Drilling Project, 24:997-1037. Washington: U. S. Government Printing Office.
Sanfilippo, A., Westberg, M.J., and Riedel, W.R. 1981. Cenozoic Radiolarians at Site 462, Deep Sea Drilling Project Leg 61, Western Tropical Pacific. In: Larson, R.L, Schlanger, S.O. (Eds.). Initial Reports of the Deep Sea Drilling Project, 61:495-505. Washington: U. S. Government Printing Office.
Sanfilippo, A., M.J. Westberg-Smith, and W.R. Riedel, 1985. Cenozoic radiolaria. In: Plankton stratigraphy, edited by Bolli, H.M., Saunders, J.B. & Perch-Nielsen, K., 631-712.
Sato, T., Kameo, K., and Takayama, T. 1991. Coccolith biostratigraphy of the Arabian Sea. In: W.L. Prell and N. Niitsuma (Eds.), Proceedings of the Ocean Drilling Program Scientific Results, 117:37-54. College Station, TX: Ocean Drilling Program.
Schneider, D. A., and Kent, D. V. 1990. Paleomagnetism of Leg 115 Sediments: Implications for Neogene Magnetostratigraphy and Paleolatitude of the Reunion Hotspot. In: Duncan, R. A., Backman, J., Peterson, L. C. (Eds.). Proceedings of the Ocean Drilling Program, Scientific Results, 115:717-736. College Station, TX: Ocean Drilling Program.
Schrader, H. J. 1973. Cenozoic diatoms from the Northeast Pacific, Leg 18. In L. D. Kulm & R. von Huene (Eds.), Initial Reports of the Deep Sea Drilling Project, 18:673-798. Washington: U. S. Government Printing Office.
Schrader, H. J. 1974. Cenozoic marine planktonic diatom stratigraphy of the tropical Indian Ocean. In R. L. Fisher & E. T. Bunce (Eds.), Initial Reports of the Deep Sea Drilling Project, 24:887-968. Washington: U. S. Government Printing Office.
Schrader, H. J. 1976. Cenozoic planktonic diatom biostratigraphy of the southern Pacific Ocean. In C. D. Hollister & C. Craddock (Eds.), Initial Reports of the Deep Sea Drilling Project, 35:605-672. Washington: U. S. Government Printing Office.
Schrader, H. J. 1979. Opal phytoplankton in DSDP Leg 49 samples. In B. P. Luyendyk & J. R. Cann (Eds.), Initial Reports of the Deep Sea Drilling Project, 49:589-594. Washington: U. S. Government Printing Office.
Schrader, H.J. 1978. Diatoms in DSDP Leg 41 sites. In Y. Lancelot & E. Seibold (Eds.), Initial Reports of the Deep Sea Drilling Project, 41:791-812. Washington: U. S. Government Printing Office.
Shackleton, N.J., Hall, M.A., Line, J., and Chuxi, C. 1983. Carbon isotope data in core V19-30 confirm reduced carbon dioxide in the ice age atmosphere. Nature, 306:319-322.
Shaw, A.B. 1964. Time in stratigraphy. McGraw-Hill, New York.
Shaffer, B. L. 1980. Calcareous-nannofossil biostratigraphy of Japan Trench transect, Deep Sea Drilling Project Leg 57. In Scientific Party, Initial Reports of the Deep Sea Drilling Project, 56, 57 pt. 2:875-886. Washington: U. S. Government Printing Office.
Shafik, S. 1975. Nannofossil biostratigraphy of the southwest Pacific, Deep Sea Drilling Project, Leg 30. In J. E. Andrews & G. Packham (Eds.), Initial Reports of the Deep Sea Drilling Project, 30:549-598. Washington: U. S. Government Printing Office.
Siesser, W. G., and Bralower, T. J. 1992. Cenozoic Calcareous Nannofossil Biostratigraphy on the Exmouth Plateau, Eastern Indian Ocean. In: von Rad, U., Haq, B. U. (Eds.). Proceedings of the Ocean Drilling Program, Scientific Results, 122:601-631. College Station, TX: Ocean Drilling Program.
Sloan, J. 1980. Radiolarians from Sediments of the Philippine Sea, Deep Sea Drilling Project Leg 58. In: deVries Klein, G., Kobayashi, K. (Eds.). Initial Reports of the Deep Sea Drilling Project, 58:587-595. Washington: U. S. Government Printing Office.
Smith, A.B. 1994. Systematics and the fossil record - documenting evoltuionaryevolutionary patterns. Blackwell Scientific Publications, Oxford.
Smith, C.C. and Poore, R.Z. 1984. Upper Maestrichtian and Paleocene planktonic foraminiferal biostratigraphy of the northern Cape Basin, Deep Sea Drilling Project Hole 524. In K. J. Hsü & J. L. LaBrecque (Eds.), Initial Reports of the Deep Sea Drilling Project, 73:449-457. Washington: U. S. Government Printing Office.
Snyder, S. W., and Waters, V. J. 1985. Cenozoic planktonic foraminiferal biostratigraphy of the Goban Spur region, Deep Sea Drilling Project Leg 80. In P. C. Graciansky & C. W. Poag (Eds.), Initial Reports of the Deep Sea Drilling Project, 80:439-472. Washington: U. S. Government Printing Office.
Spaulding, S. 1991. Neogene nannofossil biostratigraphy of Sites 723 through 730, Oman Continental Margin, northwestern Arabian Sea. In: W.L. Prell and N. Niitsuma (Eds.), Proceedings of the Ocean Drilling Program Scientific Results, 117:5-36. College Station, TX: Ocean Drilling Program.
Spaulding, S.A., Bloemendal, J., Hayashida, A., Hermelin, J.O.R., Kameo, K., Kroon, D., Nigrini, C.A., Sato, T., Steens, T.N.F., Takayama, T., and Troelstra, S.R. 1991. Magnetostratigraphic and biostratigraphic synthesis, Leg 117, Arabian Sea. In: W.L. Prell and N. Niitsuma (Eds.), Proceedings of the Ocean Drilling Program Scientific Results, 117:127-145. College Station, TX: Ocean Drilling Program.
Spencer-Cervato, C. 1998. Changing depth distribution of hiatuses during the Cenozoic. Paleoceanography, 13:178-182.
Spencer-Cervato, C., Lazarus, D. B., Beckmann, J. P., Perch-Nielsen, K. v. S., and Biolzi, M. 1993. New calibration of Neogene radiolarian events in the North Pacific. Marine Micropaleontology, 21:261-294.
Spencer-Cervato, C., Thierstein, H. R., Lazarus, D. B., and Beckmann, J. P. 1994. How synchronous are Neogene marine plankton events? Paleoceanography 9:739-763.
Spencer-Cervato, C. and Thierstein, H.R. 1997. First appearance of Globorotalia truncatulinoides: Cladogenesis and immigration. Marine Micropaleontology, 30:267-291.
Spiess, V. 1990. Cenozoic Magnetostratigraphy of Leg 113 Drill Sites, Maud Rise, Weddell Sea, AntarticaAntarctica. In: Barker, P. F., Kennet, J. P. (Eds.). Proceedings of the Ocean Drilling Program, Scientific Results, 113:261-315. College Station, TX: Ocean Drilling Program.
Staerker, T. S. 1994. Calcareous Nannofossil Biostratigraphy: Evidence for Thrust Faulting and Sediment Mixing in the Accretionary Complex of the Central New Hebrides Island Arc. In: Green, H. G., Collot, J.-Y. (Eds.). Proceedings of the Ocean Drilling Program, Scientific Results, 134:179-245. College Station, TX: Ocean Drilling Program.
Steinmetz, J. C. 1979. Calcareous nannofossils from the North Atlantic Ocean, Leg 49, Deep Sea Drilling Project. In B. P. Luyendyk & J. R. Cann (Eds.), Initial Reports of the Deep Sea Drilling Project, 49:519-532. Washington: U. S. Government Printing Office.
Stott, L. D., and Kennett, J. P. 1990. The Paleoceanographic and Paleoclimatic Signature of the Cretaceous/Paleogene Boundary in the Antartic: Stable Isotopic Results from ODP Leg 113. In: Barker, P. F., Kennett, J. P. (Eds.). Proceedings of the Ocean Drilling Program, Scientific Results, 113:829-848. College Station, TX: Ocean Drilling Program.
Stradner, H., and Alram, F. 1982. The Nannofossil Assemblages of the Deep Sea Drilling Project Leg 66, Middle America Trench. In: Watkins, J. S., Moore, J. C. (Eds.) Initial Reports ofd the Deep Sea Drilling Project, 66:589-639. Washington: U. S. Government Printing Office.
Takayama, T. 1980. Calcareous nannofossil biostratigraphy, Leg 55 of the Deep Sea Drilling Project. In E. D. Jackson & I. Koizumi (Eds.), Initial Reports of the Deep Sea Drilling Project, 55:349-364. Washington: U. S. Government Printing Office.
Takayama, T. 1993. Notes on the Neogene Calcareous Nannofossil Biostratigraphy of the Ontong Java Plateau and Size Variation of Reticulofenestra Coccoliths. In: Berger, W. H., Kroenke, L. W. (Eds.). Proceedings of the Ocean Drilling Program, Scientific Results, 130:179-229. College Station, TX: Ocean Drilling Program.
Takayama, T., and Sato, T. 1987. Coccolith biostratigraphy of the North Atlantic Ocean, Deep Sea Drilling Project Leg 94. In W. F. Ruddiman & R. B. Kidd (Eds.), Initial Reports of the Deep Sea Drilling Project, 94:651-702. Washington: U. S. Government Printing Office.
Takayanagi, Y., and Oda, M. 1976. Shore laboratory report on Cenozoic planktonic foraminifera, Leg 33. In S.O. Schlanger & E. D. Jackson (Eds.), Initial Reports of the Deep Sea Drilling Project, 33:451-466. Washington: U. S. Government Printing Office.
Takemura, A. 1992. Radiolarian Paleogene Biostratigraphy in the Southern Indian Ocean, Leg 120. In: Wise, S. W., Schlich, R. (Eds.). Proceedings of the Ocean Drilling Program, Scientific Results, 120:735-756. College Station, TX: Ocean Drilling Program.
Tang, C. 1992. Paleomagnetism of Cenozoic Sediments in Holes 762B and 763A, Central Exmouth Plateau, Northwest Australia. In: von Rad, U., Haq, B. U. (Eds.). Proceedings of the Ocean Drilling Program, Scientific Results, 122:717-733. College Station, TX: Ocean Drilling Program.
Tauxe, L., Tucker, P., Petersen, N. P., and LaBrecque, J. L. 1984. Magnetostratigraphy of Leg 73 sediments. In K. J. Hsü & J. L. LaBrecque (Eds.), Initial Reports of the Deep Sea Drilling Project, 73:609-622. Washington: U. S. Government Printing Office.
Tauxe, L., Valet, J.-P., and Bloemendal, J. 1989. Magnetostratigraphy of Leg 108 advanced hydraulic piston cores. In: W. Ruddiman & M. Sarnthein (Eds.). Proceedings of the Ocean Drilling Program Scientific Results, 108:429-439. College Station, TX: Ocean Drilling Program.
Theyer, F., and Lineberger, P. 1981. Radiolarian Biostratigraphy of the Philippine Sea, Deep Sea DrilingDrilling Project Leg 59. In: Kroenke, L., Scott, R. (Eds.). Initial Reports of the Deep Sea Drilling Project, 59:581-585. Washington: U. S. Government Printing Office.
Theyer, F., Mato, C. Y., and Hammond, S. R. 1978. Paleomagnetic and geochronologic calibration of latest Oligocene to Pliocene radiolarian events, equatorial Pacific. Marine Micropaleontology, 3:377-395.
Thierstein, H. R. 1974. Calcareous nannoplankton - Leg 26, Deep Sea Drilling Project. In T. A. Davies & B. P. Luyendyk (Eds.), Initial Reports of the Deep Sea Drilling Project, 26:619-668. Washington: U. S. Government Printing Office.
Thierstein, H.R., and Manivit, H. 1981. Calcareous-Nannofossil Biostratigraphy, Nauru Basin, Deep Sea Drilling Project Site 462, and Upper Cretaceous Nannofacies. In: Larson, R.L, Schlanger, S.O. (Eds.). Initial Reports of the Deep Sea Drilling Project, 61:475-494. Washington: U. S. Government Printing Office.
Thierstein, H.R., K. Geitzenauer, B. Molfino, and N.J. Shackleton 1977. Global synchroneity of Late Quaternary coccolith datums: Validation by oxygen isotopes, Geology, 5:400-404.
Thompson, P. R. 1980. Foraminifers from Deep Sea Drilling Project Sites 434, 435, and 436, Japan Trench. In Scientific Party, Initial Reports of the Deep Sea Drilling Project, 56, 57 pt. 2:775-808. Washington: U. S. Government Printing Office.
Thompson, P. R. 1982. Foraminifers of the Middle America Trench. In J. Aubouin & R. von Huene (Eds.), Initial Reports of the Deep Sea Drilling Project, 67:351-383. Washington: U. S. Government Printing Office.
Toumarkine, M. 1978. Planktonic Foraminifera Biostratigraphy of the Paleogene of Sites 360 to 364 and the Neogene of Sites 362A, 363, and 364 Leg 40. In: Bolli, H.M., Ryan, W.B.F.(Eds.). Initial Reports of the Deep Sea Drilling Project, 40:679-721. Washington: U. S. Government Printing Office.
Townsend, H. A. 1985. The paleomagnetism of sediments acquired from the Goban Spur on Deep Sea Drilling Project Leg 80. In P. C. Graciansky & C. W. Poag (Eds.), Initial Reports of the Deep Sea Drilling Project, 80:389-414. Washington: U. S. Government Printing Office.
Vail, P.R., R.M. Jr. Mitchum, R.G. Todd, J.M. Widmier, S. Thompson III, J.B. Sangree, J.N. Bubb, and W.G. Hatlelid 1977. Seismic stratigraphy and global sea-level changes. In: Seismic stratigraphy - applications to hydrocarbon exploration, edited by Payton, C.E., Tulsa, American Association of Petroleum Geologists Memoir, 26:49-212.
Valentine, P. C. 1987. Lower Eocene Calcareous Nannofossil Biostratigraphy beneath the Atlantic Slope and Upper Rise off New Jersey- New Zonation based on Deep Sea Drilling Project Sites 612 and 613. In: Poag, C. W., Watts, A. B. (Eds.). Initial Reports of the Deep Sea Drilling Project, 95:359-394. Washington: U. S. Government Printing Office.
van Andel, T.H. 1975. Mesozoic/Cenozoic Calcite Compensation Depth and the global distribution of calcareous sediments. Earth and Planet. Sci. Letters, 26:187-195.
Vincent, E., and Toumarkine, M. 1990. Neogene Planktonic Foraminifers from the Western Tropical Indian Ocean, Leg 115. In: Duncan, R. A., Backman, J., Peterson, L. C. (Eds.). Proceedings of the Ocean Drilling Program, Scientific Results, 115:795-836. College Station, TX: Ocean Drilling Program.
Vincent, E., Frerichs, W. E., and Heiman, M. E. 1974. Neogene planktonic foraminifera from the Gulf of Aden and the western tropical Indian Ocean, Deep Sea Drilling Project, Leg 24. In R. L. Fisher & E. T. Bunce (Eds.), Initial Reports of the Deep Sea Drilling Project, 24:827-850. Washington: U. S. Government Printing Office.
Weaver, F. M. 1983. Cenozoic radiolarians from the Southwest Atlantic, Falkland Plateau region, Deep Sea Drilling Project Leg 71. In W. J. Ludwig & V. A. Krasheninnikov (Eds.), Initial Reports of the Deep Sea Drilling Project, 71:667-686. Washington: U. S. Government Printing Office.
Weaver, F. M. 1983. Cenozoic radiolarians from the southwest Atlantic, Falkland Plateau region, Deep Sea Drilling Project Leg 71. In W. J. Ludwig & V. A. Krasheninnikov (Eds.), Initial Reports of the Deep Sea Drilling Project, 71:667-686. Washington: U. S. Government Printing Office.
Weaver, P. P. E. 1987. Late Miocene to Recent planktonic foraminifers from the North Atlantic: Deep Sea Drilling Project Leg 94. In W. F. Ruddiman & R. B. Kidd (Eds.), Initial Reports of the Deep Sea Drilling Project, 94:703-728. Washington: U. S. Government Printing Office.
Weaver, P.P.E. and Raymo, M.E. 1989. Late Miocene to Holocene planktonic foraminifers from the equatorial Atlantic, Leg 108. Proceedings of the Ocean Drilling Program Scientific Results, 108:71-91. College Station, TX: Ocean Drilling Program.
Weedon, G.P., Shackleton, N.J., and Pearson, P.N. 1997. The Oligocene time scale and cyclostratigraphy on the Ceara Rise, western equatorial Atlantic. In: Shackleton, N.J., Curry, W.B., Richter, C., and Bralower, T.J. (Eds.) Proceedings of the Ocean Drilling Program Scientific Results, 154:101-114. College Station, TX: Ocean Drilling Program.
Wei, K.-Y. and Kennett, J. 1983. Nonconstant extinction rates of Neogene planktonic foraminifera. Nature, 305:218-220.
Wei, W. 1993. Calibration of Upper Pliocene-Lower Pleistocene nannofossil events with oxygen isotope stratigraphy, Paleoceanography, 8, 85-99.
Wei, W., and Pospichal, J. J. 1991. Danian Calcareous Nannofossil Succession at Site 738 in the Southern Indian Ocean. In: Barron, J., Larsen, B. (Eds.). Proceedings of the Ocean Drilling Program, Scientific Results, 119:495-512. College Station, TX: Ocean Drilling Program.
Wei, W., and Thierstein, H. R. 1991. Upper Cretaceous and Cenozoic Calcareous Nannofossils of the Kerguelen Plateau ( Southern Indian Ocean) and Prydz Bay (East America). In: Barron, J., Larsen, B. (Eds.). Proceedings of the Ocean Drilling Program, Scientific Results, 119:467-493. College Station, TX: Ocean Drilling Program.
Wei, W., and Wise, S. W. 1990. Middle Eocene to Pleistocene Calcareous Nannofossils Recovered by Ocean Drilling Program Leg 113 in the Weddell Sea. In: Barker, P. F., Kennet, J. P. (Eds.). Proceedings of the Ocean Drilling Program, Scientific Results, 113:639-666. College Station, TX: Ocean Drilling Program.
Wei, W., and Wise, S. W. 1992. Oligocene-Pleistocene Calcareous Nannofossils from Southern Ocean Sites. In: Wise, S. W., Schlich, R. (Eds.). Proceedings of the Ocean Drilling Program, Scientific Results, 120:509-521. College Station, TX: Ocean Drilling Program.
Weinheimer, A. L., Sanfilippo, A., and Riedel, W. R. 1994. Radiolarians from Leg 134, Vanuatu Region, Southwestern Tropical Pacific. In: Green, H. G., Collot, J.-Y. (Eds.). Proceedings of the Ocean Drilling Program, Scientific Results, 134:309-318. College Station, TX: Ocean Drilling Program.
Weinreich, N., and Theyer, F. 1985. Paleomagnetism of Deep Sea Drilling Project Leg 85 sediments: Neogene magnetostratigraphy and tectonic history of the central Equatorial Pacific. In L. Mayer & F. Theyer (Eds.), Initial Reports of the Deep Sea Drilling Project, 85:849-904. Washington: U. S. Government Printing Office.
Westberg, M. J., and Riedel, W. R. 1982. Radiolarians from the Middle America Trench off Guatemala, Deep Sea Drilling Project Leg 67. In J. Aubouin & R. von Huene (Eds.), Initial Reports of the Deep Sea Drilling Project, 67:401-424. Washington: U. S. Government Printing Office.
Westberg-Smith, M. J., Tway, L. E., and Riedel, W. R. 1987. Radiolarians from the North Atlantic Ocean, Deep Sea Drilling Project Leg 94. In: Ruddiman, W. F., Kidd, R. B., Thomas, E. (Eds.). Initial Reports of the Deep Sea Drilling Project, 94:763-777. Washington: U. S. Government Printing Office.
Westberg-Smith, M.J.; Riedel, W.R., 1984. Radiolarians from the western margin of the Rockall Plateau: Deep Sea Drilling Project Leg 81. In D. G. Roberts & D. Schnitker (Eds.), Initial Reports of the Deep Sea Drilling Project, 81:479-501. Washington: U. S. Government Printing Office.
Wise, S. W. 1973. Calcareous nannofossils from cores recovered during Leg 18, Deep Sea Drilling Project: biostratigraphy and observations of diagenesis. In L. D. Kulm & R. von Huene (Eds.), Initial Reports of the Deep Sea Drilling Project, 18:569-616. Washington: U. S. Government Printing Office.
Wise, S. W. 1983. Mesozoic and Cenozoic calcareous nannofossils recovered by Deep Sea Drilling Project Leg 71 in the Falkland Plateau region, southwest Atlantic Ocean. In W. J. Ludwig & V. A. Krasheninnikov (Eds.), Initial Reports of the Deep Sea Drilling Project, 71:481-550. Washington: U. S. Government Printing Office.
Wolfart, R. 1981. Neogene radiolarians from the eastern North Pacific (off Alta and Baja California), Deep Sea Drilling Project, Leg 63. In R. S. Yeats & B. U. Haq (Eds.), Initial Reports of the Deep Sea Drilling Project, 63:473-506. Washington: U. S. Government Printing Office.
Worsley, T. R. 1973. Calcareous nannofossils: Leg 19 of the Deep Sea Drilling Project. In J. S. Creager & D. W. Scholl (Eds.), Initial Reports of the Deep Sea Drilling Project, 19:741-750. Washington: U. S. Government Printing Office.
Wright, A.A. 1985. Introduction, cruise summary, and explanatory notes: Deep Sea Drilling Project Leg 86, western North Pacific. In G.R. Heath and L.H. Burckle (Eds.), Initial Reports of the Deep Sea Drilling Project, 86:5-21. Washington: U. S. Government Printing Office.
Wright, J.D. and K.G. Miller 1993. Southern Ocean influences on late Eocene to Miocene deepwater circulation. In: ‘The Antarctic paleoenvironment: a perspective on global change’. AGU Antarctic Research Series, 60:1-25.
Wright, J.D., Miller, K.G., and Fairbanks, R.G. 1992. Early and middle Miocene stable isotopes: implications for deepwater circulation and climate. Paleoceanography, 7:357-389.
Xu, Y. and Wise, S.W., Jr. 1992. Middle Eocene to Miocene calcareous nannofossils of Leg 125 from the western Pacific Ocean. In: P. Fryer, J.A. Pearce, & Stokking, L.B. (Eds.) Proceedings of the Ocean Drilling Program Scientific Results, 125:43-70. College Station, TX: Ocean Drilling Program.
Zachariasse, W. J. 1992. Neogene Planktonic Foraminifers from Sites 761 and 762 off Northwest Australia. In: von Rad, U., Haq, B. U. (Eds.). Proceedings of the Ocean Drilling Program, Scientific Results, 122:665-675. College Station, TX: Ocean Drilling Program.
Zachos, J.C., Flower, B.P., and Paul, H. 1997. Orbitally paced climate oscillations across the Oligocene/Miocene boundary. Nature, 388:567-570.
Zhao, X., Roperch, P., and Stokking, L. 1994. Magnetostratigraphy of the North Aoba Basin. In: Green, H. G., Collot, J.-Y. (Eds.). Proceedings of the Ocean Drilling Program, Scientific Results, 134:457-474. College Station, TX: Ocean Drilling Program.
