Figure 2.1. Location of DSDP and ODP holes in the Neptune database. Dots mark holes with one or more hiati, squares holes with a continuous stratigraphy, within the resolution of the chronology.
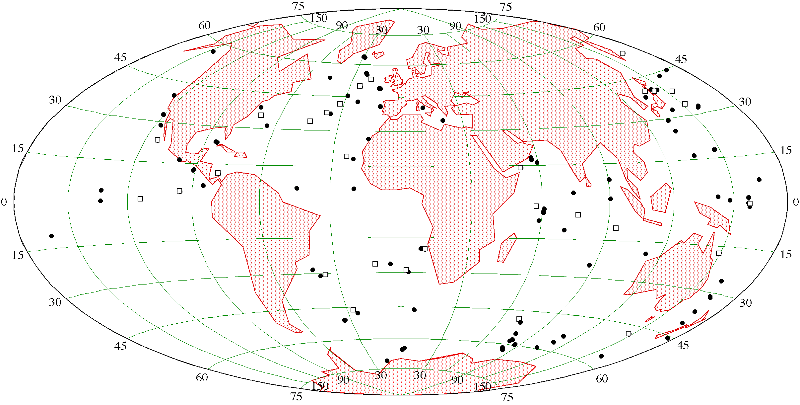
Figure 3.1. Total core recovery in percentage in the holes included in Neptune.

Figure 3.2. Age distribution of the sections included in Neptune.

Figure 3.3. Age distribution of hiati in the sections included in Neptune.

Figure 3.4. Number of species names in each plankton group included in Neptune.

Figure 3.5. Number of reports on Paleogene biostratigraphy in Neptune by plankton group.

Figure 4.1. Overview of database project (modified after Lazarus, 1994). Combining existing data (boxes with thin outlines) with new information generated by project members (rounded boxes with italic text), we have produced new information (bold outline boxes).

Figure 4.2. Simplified sketch of the database structure (modified after Lazarus 1994). Each box represents one relational table, with field names listed in the box. Relational links between tables are shown by thin lines. Arrows point from a table with many records with the same value for the relating field, to a table with unique values for each record in this field. The primary key for each table (the combination of one or more fields which makes each record in the table unique) is underlined. The approximate number of records (as of February, 1998) is shown below each box. The records in the ‘Taxa by Hole’ table were extracted from the DSDP CD-ROM. The other tables were created by Neptune.

Figure 4.3. Age Range Chart produced from Neptune for the occurrences of Globorotalia truncatulinoides and Globorotalia tosaensis. The plot shown here represents only a subset of the data obtained from Neptune for this search. The symbols are explained in the caption at the bottom of the figure. The charts are produced in colour, with the colour of the bullets corresponding to the species name on the right. Small black dots represent samples that were examined but where none of the selected species was found. This figure is an unmodified reproduction of the format produced by the Age Range Chart program (Lazarus, 1994). The large number of data in the figure and its format make difficult to understand it when it is reduced to a one-page size and does not clearly show the differences between the different species’ occurrences.

Figure 4.4. Screen snapshot of a simple query in Neptune. The table in the lower right corner is the list of tables in Neptune that are directly searchable with a ‘Search Editor’ window (under the ‘Select’ menu). Selecting one of the tables shows the records included in it and their number (in the heading). The larger table in the background is the ‘Sample Info’ table, which contains 30800 records.

Figure 4.5. Screen snapshot of the ‘Execute Procedure’ window (under the ‘Special’ menu). This allows to search a combination of tables using one of the predefined procedures. The following figures show the progression of a ‘Bug Data Search’ procedure for the occurrence of the planktic foraminifer Globorotalia truncatulinoides in the Neptune holes. A ‘Bug Data Search Batch’ (described in Section 4.1.4) is one of the other procedures shown on the list.

Figure 4.6. Once the type of procedure is chosen, a ‘Search Editor’ window is shown. In this example, a search is made for the species’ name - ‘Species’ ‘is equal to’ ‘truncatulinoides’.

Figure 4.7. The selected species’ name is found in the ‘Species Names’ table together with linked synonyms. After one has highlighted the names that should be used, one can proceed with the Search. Note the format of the data in the ‘Species Names’ table, described in Section 3.3 and characteristic of Neptune.
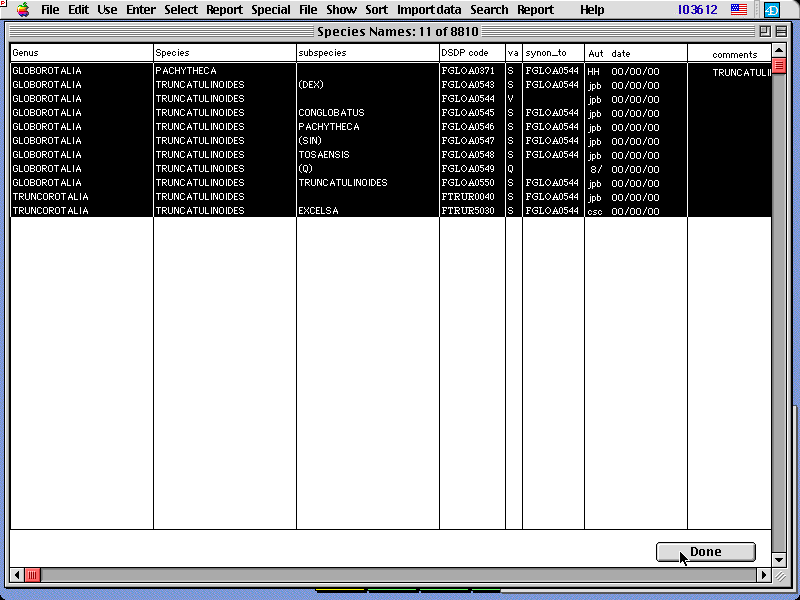
Figure 4.8. The result of the search is shown in a window that gives the number of occurrences in all the holes present in Neptune (779 in this example). The next step allows to refine the selection with additional criteria.

Figure 4.9. In this example I have chosen to refine the search to obtain only data from holes for which we have age models. To do this, I have selected ‘Age’ in the ‘Sample Info’ table (left) and specified that it has to be greater than 0 (all samples from holes without age models have ages set to 0). The ‘Search in selection’ box, which allows to search only in the selection found through the previous queries, is automatically marked.
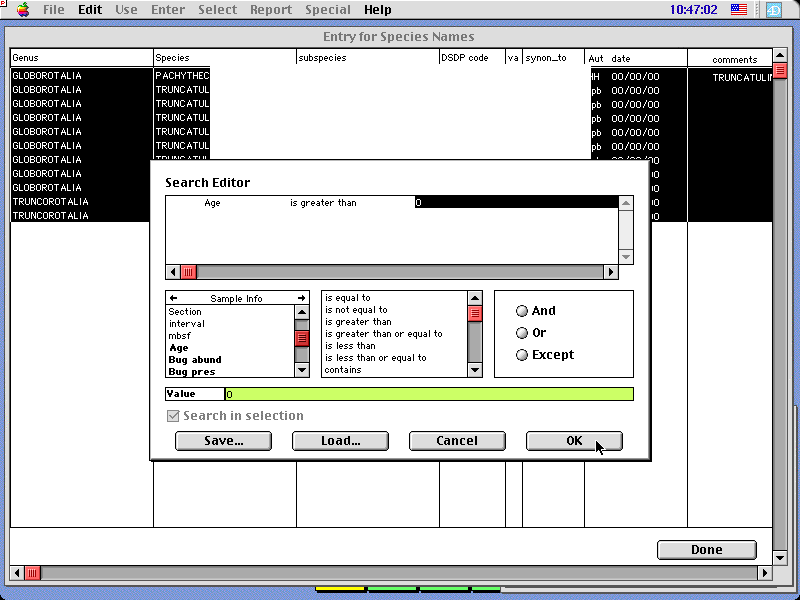
Figure 4.10. The results of this procedure are shown in a table containing 485 records (of the 779 found earlier in the search). This table and related data can be sorted, printed out, exported, or saved in various formats.
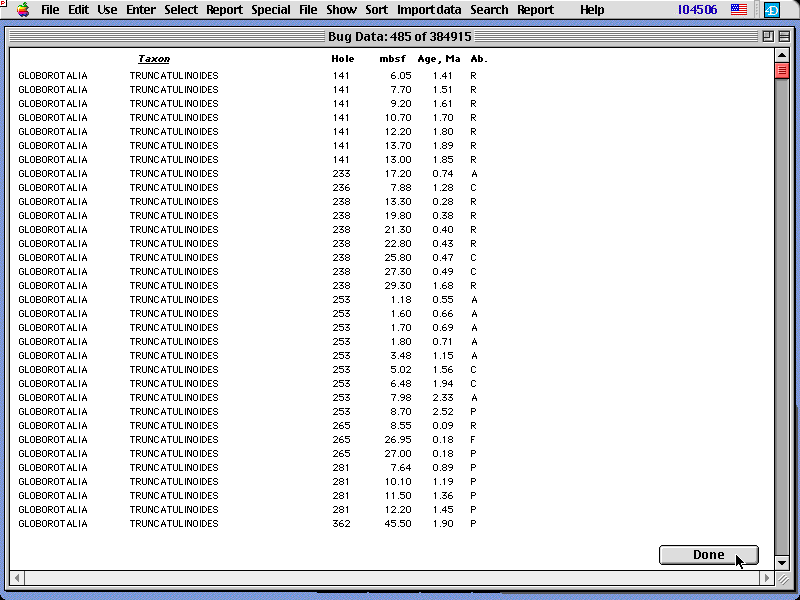
Figure 4.11. Age versus latitude plot of the first occurrences of G. truncatulinoides in selected Neptune sites (from Spencer-Cervato and Thierstein 1997).
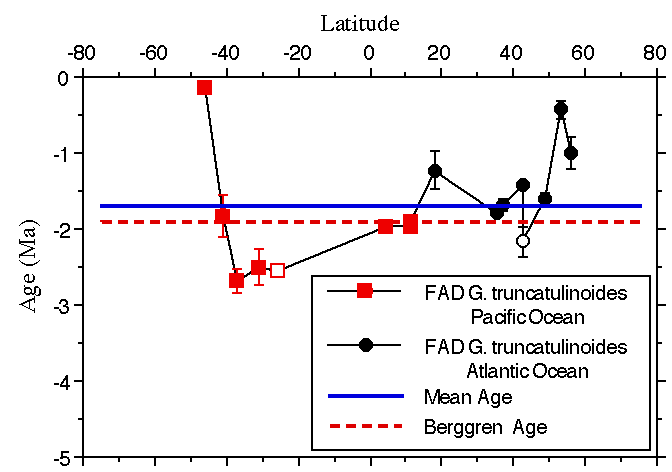
Figure 4.12. Distribution of diatom, foraminifera, nannofossil and radiolarian longevity by species (in m.y.), including both extant and extinct species. Note that, while most phytoplankton species are less longevous than zooplankton species, extreme longevity values are exclusively found in phytoplankton species.

Figure 4.13. Appearance rates (calculated as the ratio between number of FADs versus number of species) of the four groups during the Cenozoic Note that the rates are biased by species richness in low diversity intervals (see Fig. 4.9).

Figure 4.14. Extinction rates (calculated as the ratio between number of LADs versus number of species) of the four groups during the Cenozoic.

Figure 4.15. Geographic distribution of species FADs for the four groups. Southern latitudes are given as negative numbers. The latitude given for each FAD is a calculated paleolatitude at the time of the appearance (see 4.1.1.4 for details on the method).

Figure 4.16. Species richness (total number of species - diamond symbols and black line) and diversity normalised on the number of sections in Neptune (ratios between diversity and number of sections - crosses and grey line) for the four plankton groups during the Cenozoic. Species richness is calculated at 1 m.y. intervals. Note that the scale of the normalised diversity is different in the four graphs.

Figure 4.17. Species richness versus the total number of sections in Neptune. The R2 refers to the simple linear correlation shown in the graphs.

Figure 4.18. Age differences between equatorial Pacific calibration (defined as 0) and North Pacific age ranges. The horizontal bar represents the suggested calibration for the single events. The events are divided into three groups, from left to right: the first, largest group includes events that are older in the North Pacific than they are in the Equatorial Pacific, the second group of events is synchronous in the equatorial and North Pacific, the third group includes events that are younger in the North Pacific. The number of sites included in the age range is written below the bar (from Spencer-Cervato et al. 1993).

Figure 4.19. Latitudinal range versus standard deviation (in m.y.) for four plankton groups (from Spencer-Cervato et al. 1994). Note the higher standard deviations (interpreted as higher diachrony) for events with broader latitudinal ranges (i.e., cosmopolitan events). Also, note the relatively low standard deviation values for calcareous nannofossils, which are largely cosmopolitan. This suggest that they are particularly well suited for biostratigraphic correlations.

Figure 4.20. (a) Number of Cenozoic DSDP and ODP sections per 0.5 m.y. in the Neptune database. (b) Number of hiati recorded in the Neptune database during the last 65 m.y. (c) Curve of the frequency of hiati. The vertical line represents the average frequency (30%). Shaded intervals mark periods characterised by a higher than average frequency of hiati (hiatus events). (d) "Eustatic" sea level curve of Haq et al. (1987). (e) Benthic foraminifera oxygen isotope curve (Miller et al. 1987). All curves are calibrated to Berggren et al.’s (1995b) biochronology (from Spencer-Cervato 1998).

Figure 4.21. The lines with symbols represent the frequency of hiati recorded at various paleodepth intervals: (a) shallower than 2000 m, (b) between 2000 and 3000 m, and (c) deeper than 3000 m. The continuous lines represent the percentage of sections in the Neptune database in that interval of paleo-water depth (from Spencer-Cervato 1998).

Figure 5.1. Number of reports on Cenozoic biostratigraphy in Neptune by plankton group. Reports that cover the whole or only a part of the series are included. No selection based on the detail or the quality of the reports was made. Note the overall better availability of nannofossil biostratigraphy in comparison with the other plankton groups. The anomalously low number of reports for foraminifera, diatoms and radiolarians may be in part due to the lower number of Pleistocene sections available in Neptune (Fig. 3.2). However, it likely represents also an artifact of the analysis caused by the scarcity of biostratigraphic events of these three groups calibrated for the Pleistocene.

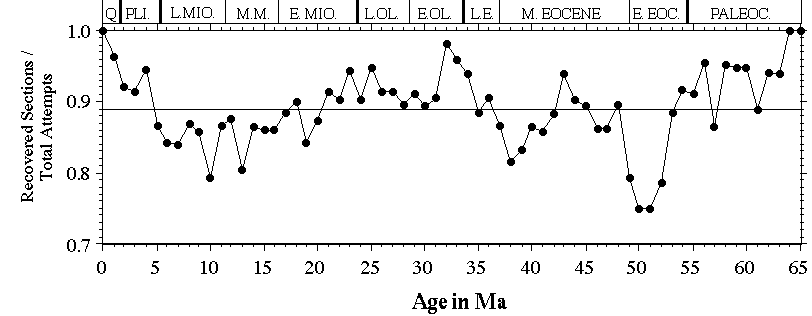
Figure 5.2. Ratio between the number of recovered sections and the total number of times recovery was attempted at 1-m.y. resolution. Sections that recovered sediments containing at least 5% of the one m.y. interval are included. The horizontal line represents the average recovery ratio for all the sections analysed (0.89). The data are limited to the sections included in Neptune and for which we have age control. This means that in some instances, deeper sediments were also recovered, but no biostratigraphic study done on them to provide us with an age model. This graph does not reflect the ‘true’ availability of sediments but only the time interval that was recovered in each section - it includes also intervals that are represented by hiati (see Fig. 3.3), which are e.g., quite frequent in Miocene sediments. Note that Paleocene sediments are overall quite well recovered even though scarce (Fig. 3.2), an improvement from the early study by Moore (1972) which identified this interval as the least well represented in the Cenozoic sediments recovered by the early DSDP legs.
