FIGURE 1. 1A. Cube plot of data for Cribroelphidium gunteri. 1B. Square plot for Cribroelphidium gunteri averaged across salinity. i.e., The upper right edge of Figure 1A was averaged to produce the upper right corner of Figure 1B [(0.023 + 0.97)/2 = 0.993/2 = 0.497]. 1C. Line plot of pH for Cribroelphidium gunteri. The right hand side of Figure 1B was averaged to produce the right side of Figure 1C [(0.497 + 0.056)/2 = 0.5525/2 = 0.277].
1A. 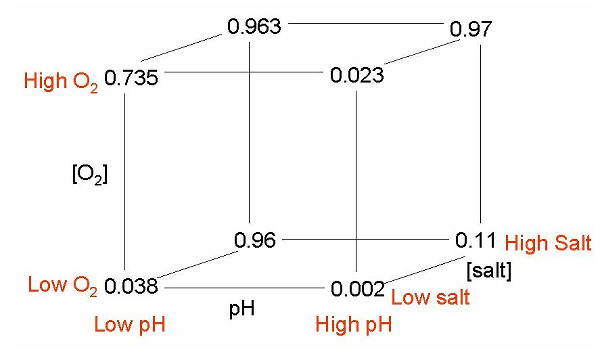
1B. 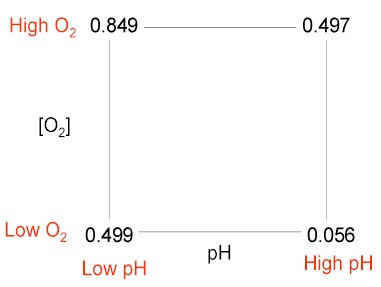
1C. 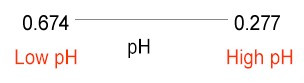
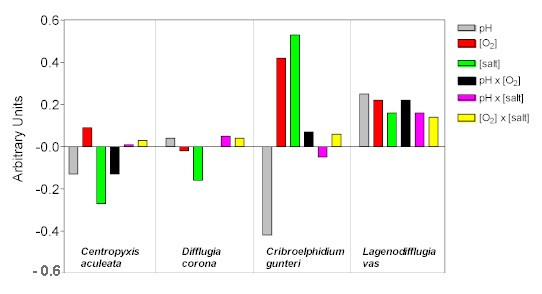
FIGURE 2. Histograms of effects of pH, [O2], [salt] and variable interactions on the abundances of four protists.