FIGURE 1. The "trophic triangle" of ungulate dental microwear that results from plotting scratch and pit frequencies in bivariate space, based on data from Solounias and Semprebon (2002). Each data point is the average for a species sample. Excepting a few outliers, the shaded regions represent the areas occupied by the main clusters of the three dietary categories, grazer, browser, and frugivore/hard object feeder.
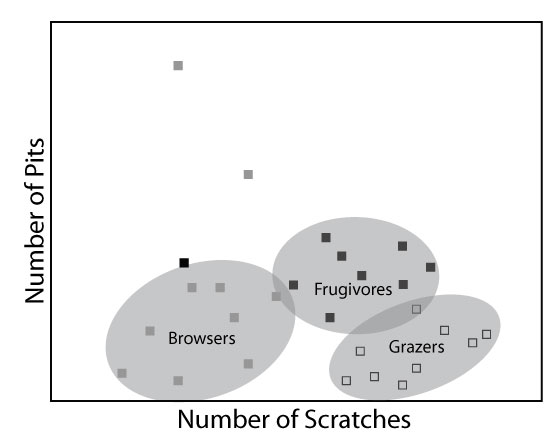
FIGURE 2. The microscope and camera used in this study, demonstrating optical and digital magnification. Digital magnification is expressed in terms of the number of pixels per micron of tooth surface. The resulting pixel width is 0.74 μm. Note that the camera does not see through the 10x eyepiece and therefore has a lower optical magnification, but nonetheless produces a resolution similar to the specimen seen through the eyepiece at 100x
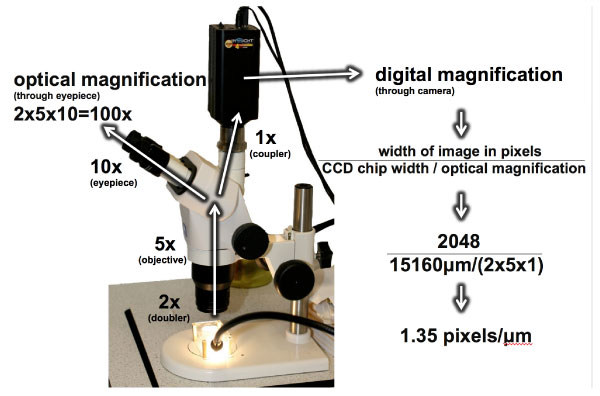
FIGURE 3. Images of two dental wear surfaces and different interpretations of three observers (Obs1, Obs 2, and Obs 3). The diameters and widths of the circles and lines with which microwear features have been marked indicate the size and shape category to which each microwear feature was assigned.
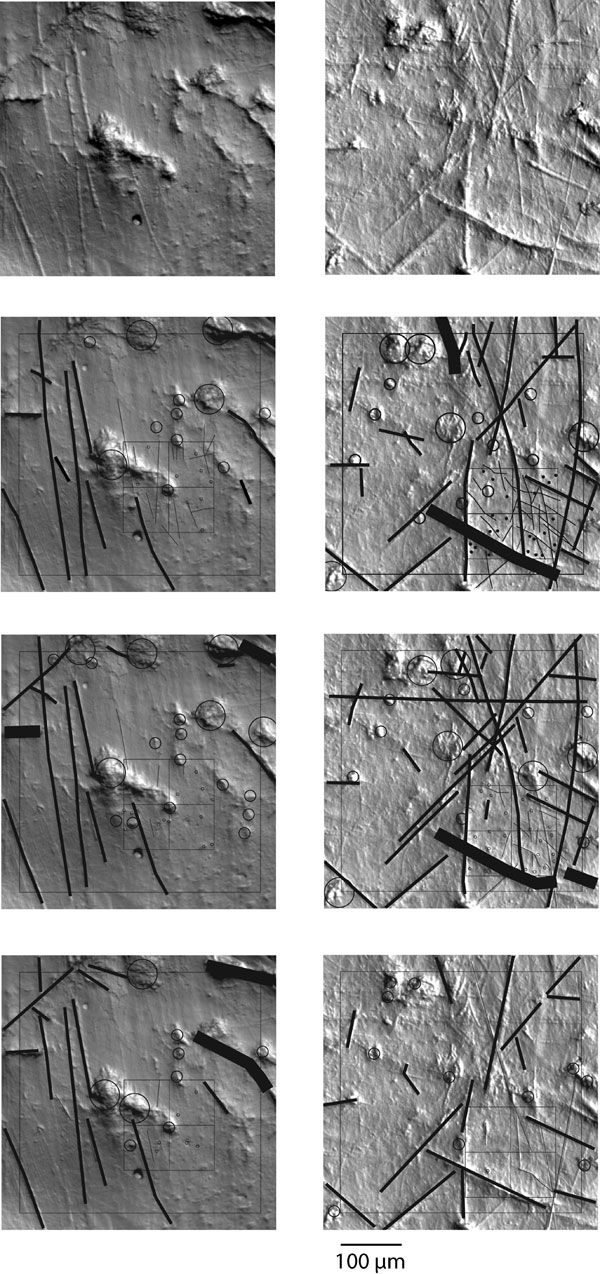
FIGURE 4. Plots of species means and standard errors for all observers during iteration 3. Browsing species are gray, grazers are white, and the frugivore/hard object feeder is black. Dotted lines represent the shape of the "trophic triangle" of each observer relating the spatial relationships of these dietary categories in bivariate space. G = giraffe (Giraffa camelopardalis), H = hippo (Hippopotamus amphibius), M = moose (Alces alces), P = peccary (Tayassu pecari), R = black rhino (Diceros bicornis), Z = zebra (Equus burchelli).
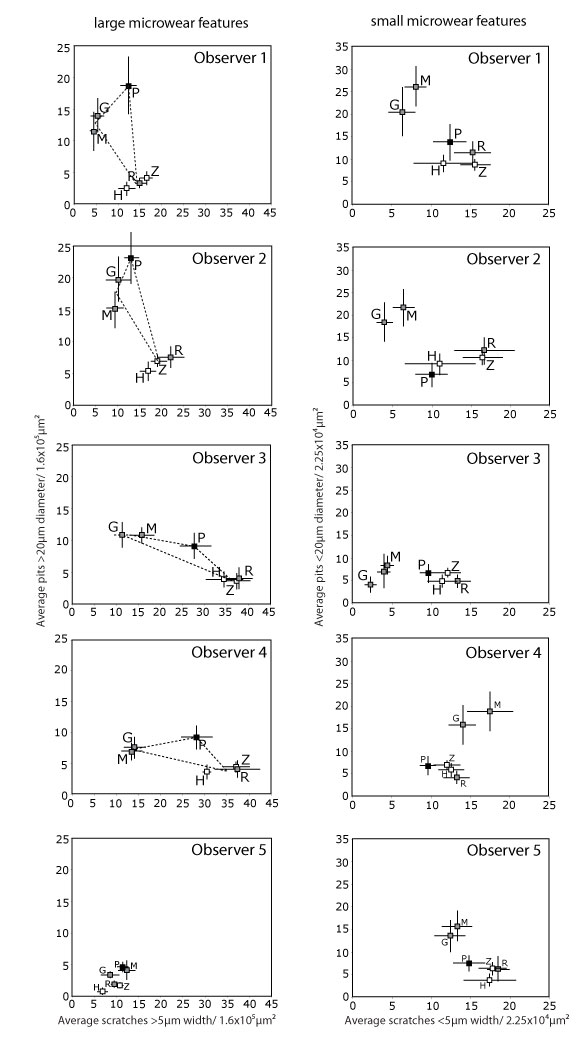
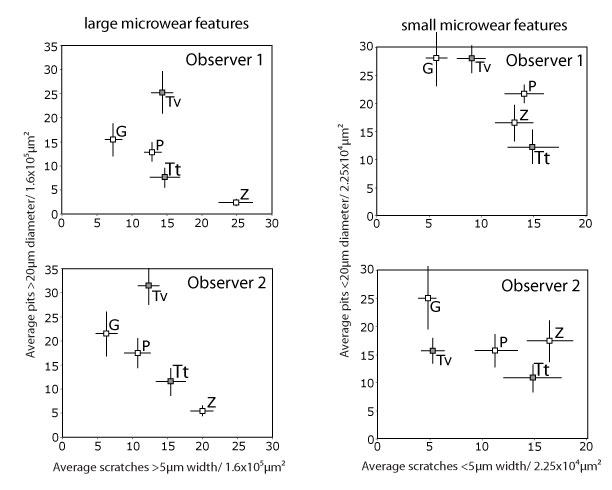
FIGURE 5. Plots of species means and standard errors for observers 1 and 2 during the fourth and final iteration. The scatter pattern for large microwear features is very similar between observers, while the scatter pattern for small microwear features is quite different. The two tapir species are gray, and other species are white. Abbreviations: G = giraffe (Giraffa camelopardalis), P = peccary (Tayassu pecari), TT = extant Brazilian tapir (Tapirus terrestris), TV = extinct Florida tapir (Tapirus veroensis), Z = zebra (Equus burchelli).