FIGURE 1. Histogram of the grayscale distribution of the entire CT data set of the holotype skull of C. carrascoensis. Red line, original data set; green line, endocast of the bony labyrinth; blue line, skull with endocast and unprepared matrix removed.
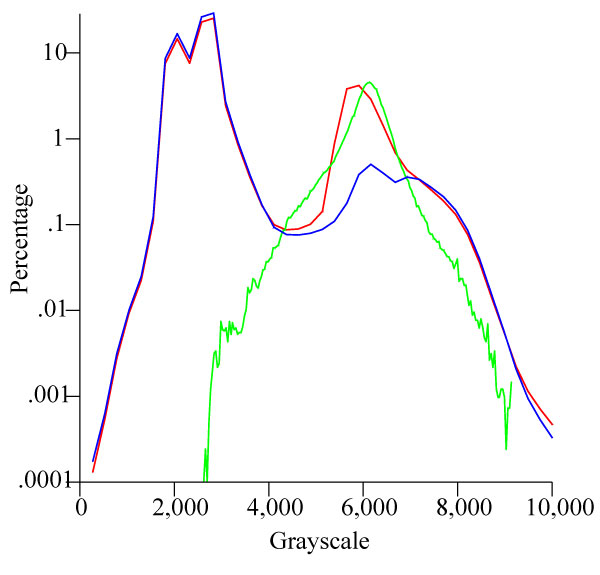
FIGURE 2. An example of the CT image segmentation process. The Half Maximum Height method (Baxter and Sorenson, 1981; Spoor et al., 1993) is used to assist in identifying the bone-matrix interface. 1, original CT images across the right ear region in coronal plane; 2, endocasts of the bony labyrinth and cranial cavity are segmented; 3, endocast of the bony labyrinth. 4, 5, and 6 indicate the grayscale distribution of 1, 2, and 3, respectively.
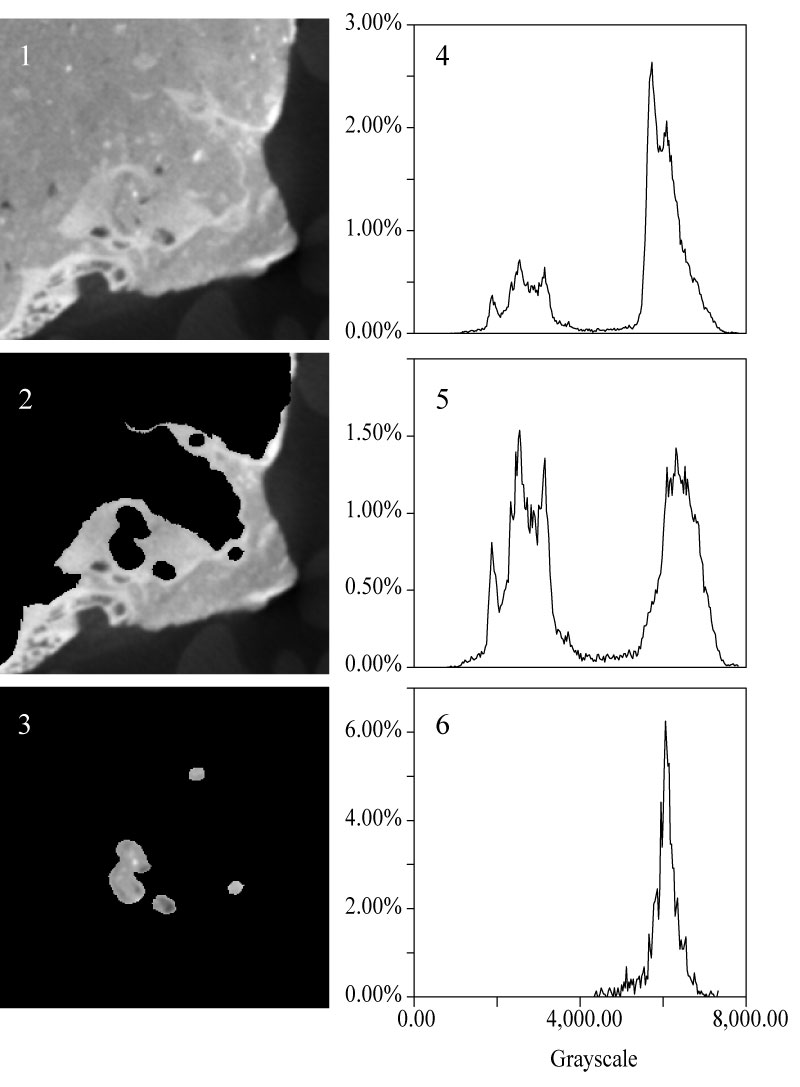
FIGURE 3. Three-dimensional virtual reconstruction of the bony labyrinth and the skull of C. carrascoensis. To show the position of the bony labyrinths, the rest of the skull is set to transparent. 1, dorsal view, un-restored; 2, dorsal view, restored with 7.7° offset.
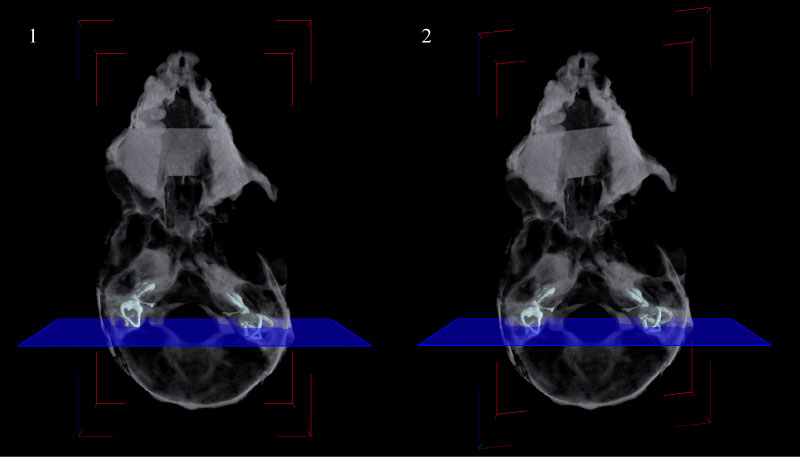
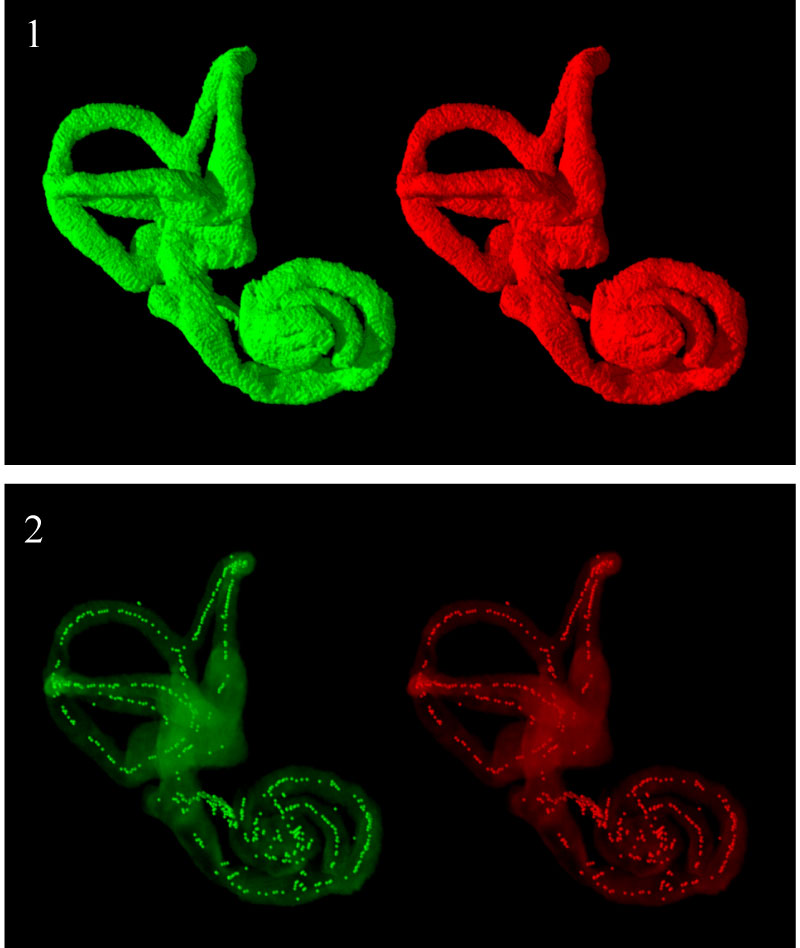
FIGURE 4. 1, Stereoscopic anterolateral view of the three-dimensional virtual reconstructions of the right bony labyrinth of C. carrascoensis; 2, stereoscopic view of the skeletonized right bony labyrinth. The bony labyrinth was set to be transparent. The white dots, generated via the skeletonization process, represent the central path of the bony labyrinth.