FIGURE 1. Charniodiscus from the Mistaken Point Formation: (1) Field photograph of Charniodiscus procerus with a prominent stem. (2) Field photograph of C. spinosus with a distal spine and shorter, poorly-preserved stem. Scale bar increments equal 1 cm. Labeled cartoon reconstructions of (3) Charniodiscus procerus and (4) Charniodiscus spinosus. Note presence of spire extending beyond frond in latter form.
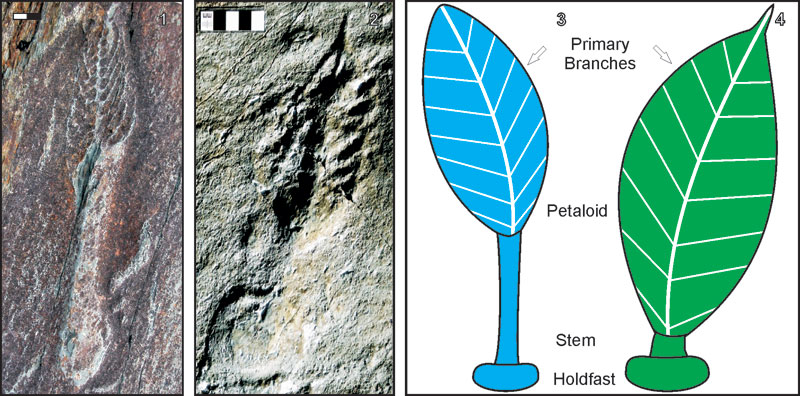
FIGURE 2. Epoxy models of Charniodiscus spinosus and C. procerus.
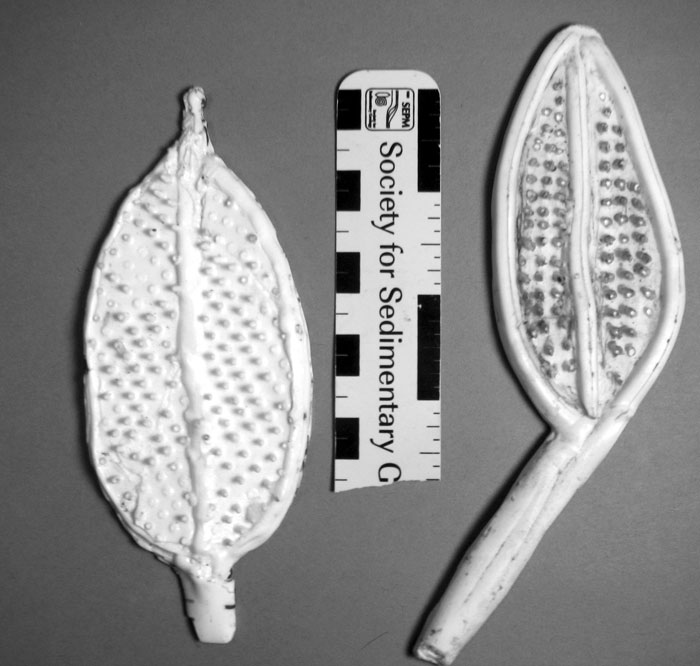
FIGURE 3. Reconstructions of Charniodiscus spinosus and the surface textures tested. (1) smooth model with no interpreted structure, (2) quilted model based on reconstruction of Charnia quilts by Seilacher(1992), (3) membrane model with two orders of branching connected by a membrane, and (4) 3D with perpendicular rods to represent three orders of branching with a membrane. The same textures were evaluated in C. procerus as well. Scale bar equals 1 cm increments.
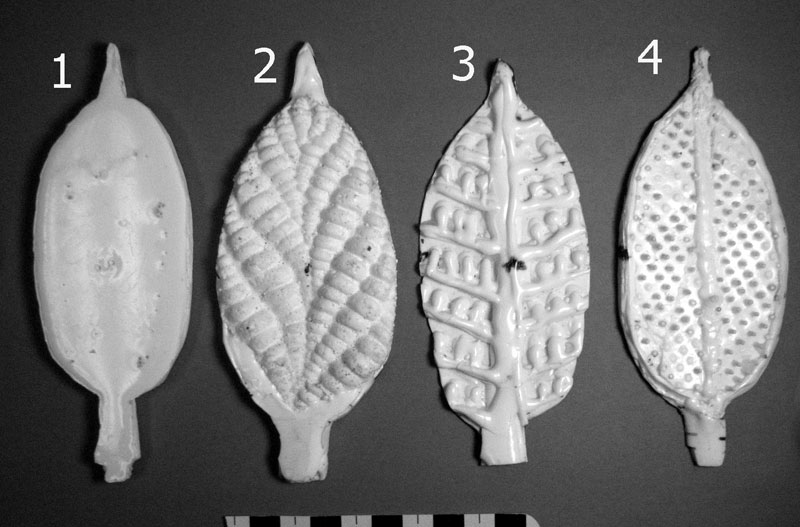
FIGURE 4. Charniodiscus spinosus model oriented for determination of drag coefficients. Flow is from right to left.
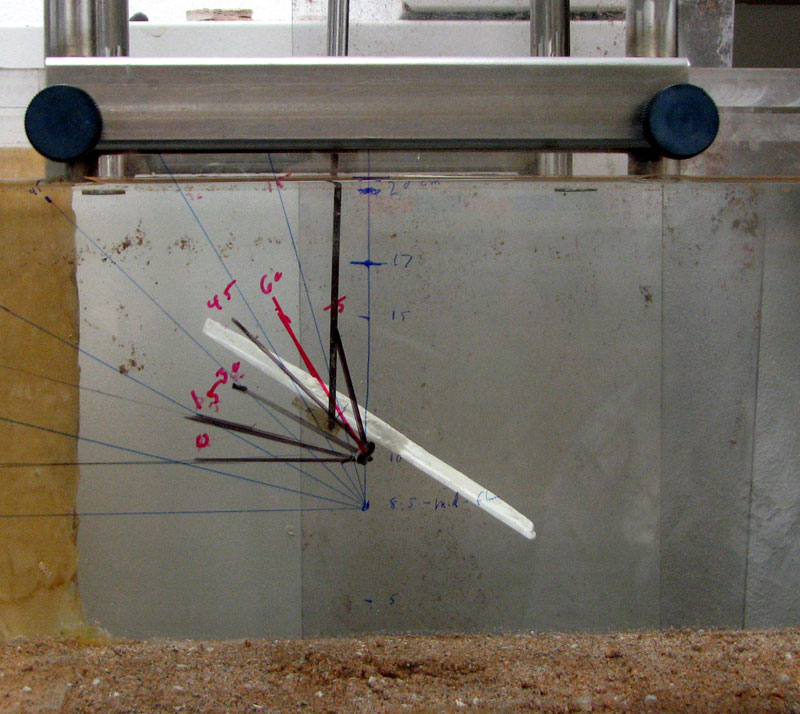
FIGURE 5. Drag coefficients of Charniodiscus spinosus epoxy models as a function of angle of attack relative to ambient flow and surface texture. Flow velocity 0.095 m/s.
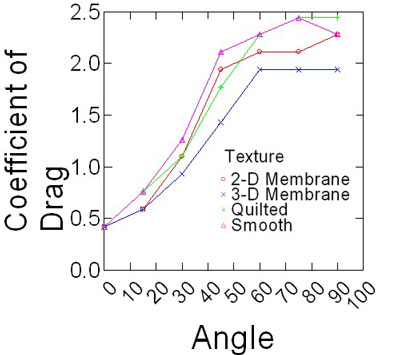
FIGURE 6. Drag coefficients of Charniodiscus procerus epoxy models as a function of angle of attack relative to ambient flow and surface texture. Flow velocity 0.095 m/s.
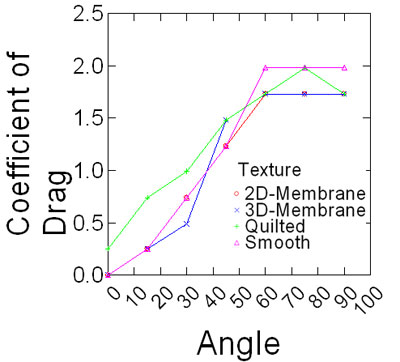
FIGURE 7. Drag coefficients as a function of angle of attack relative to ambient flow for Charniodiscus spinosus and C. procerus. Flow velocity 0.095 m/s. Fitted lines generated by locally weighted scatterplot smoothing (LOWESS).
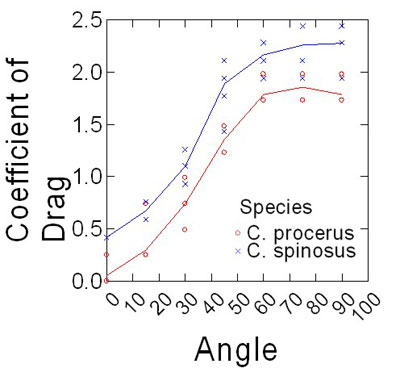
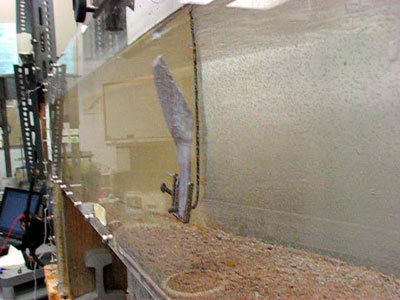
FIGURE 8. Silicon model of Charniodiscus spinosus bending in flow. Flow velocity 0.2 m/s, from right to left. Base of model mounted at bottom of tank.
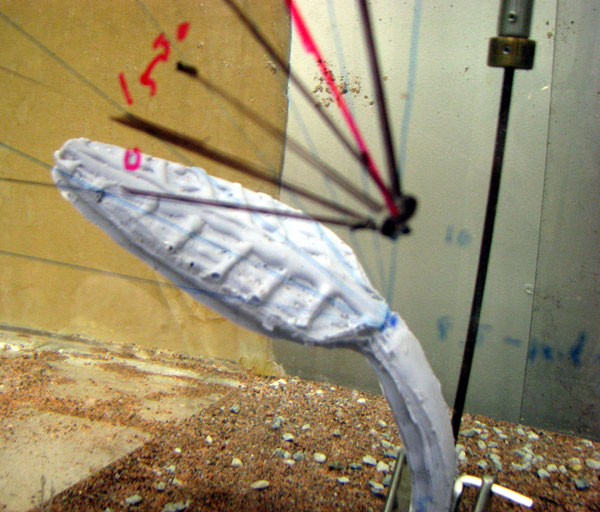
FIGURE 9. Drag on epoxy (stiff) and silicon (compliant) models as a function of velocity squared. Velocity squared is used since drag is linear with respect to velocity squared. Base of stem mounted near bottom of tank; stalk perpendicular to flow at zero velocity. Linear regression lines for the two species and materials shown.
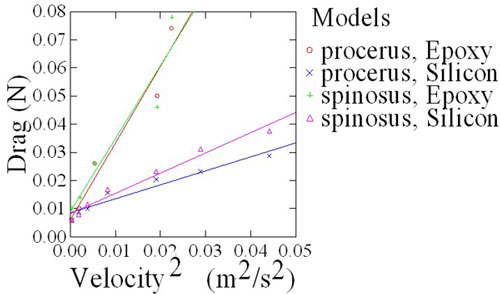
FIGURE 10. Video of an agar model of Charniodiscus spinosus with quilted surface showing overall movements in frond and movement of flow around and along surface of frond. Observed motions include vertical vibrations limited to the tip of the frond; motion laterally across the frond typically observed at the margins of the petalodium, and slow sinusoidal vibrations along the entire length of the frond. The dye streams show backflow along the surface of the frond, concentrated in the "canals" produced by the texture. Velocity is approximately 0.1 m/s.
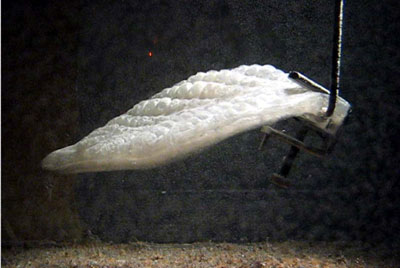
FIGURE 11. Video of periodic vibrations in silicon model of Charniodiscus procerus. Flow is away from the viewer, at approximately 0.10 m/s.