FIGURE 1. Hermaphrodite Eulimnadia dahli. 1) Antennae. 2) Brood chamber with egg clutch. 3) Head. 4) Phyllopod appendages. 5) Telson. 6) Trunk.

FIGURE 2. Limnadia badia female (1) and male (2). Carapace dimorphism prominent on dorsal margin associated with presence/absence of brood chamber. Limnadopsis occidentalis female (3) and male (4) displaying similar carapace dimorphism to that seen in L. badia, despite gross morphologic difference. Female (5) and male (6) Cyzicus mexicanus. The dimorphism in Cyzicus is more subtle than that seen within the Limnadiidae, the female (5) being slightly more elongate with a flattened postero-ventral margin. 'Female' morphotype (7) and 'male' morphotype (8) of Carapacestheria disgragaris. All scale bars equal 1 mm.

FIGURE 3. Modes of shape change represented by eigenshape (ES) axes 1-4. Eigenshapes produced via standard eigenshape analysis (sensu MacLeod 1999) of digitized outlines of 120 total specimens of E. dahli, E. texana, L. badia and L. stanleyana. Dark-light shading indicates representative shapes with low to high scores on each of the four axes.

FIGURE 4. A plot of 120 extant specimens (E. dahli, E. texana, L. badia and L. stanleyana) by sex (red = female/hermaphrodite, blue = male) on the first and second eigenshape axes. Mean shapes for males (blue) and females/hermaphrodites (red) shown both separate and overlapping to highlight dimorphism.

FIGURE 5. Hierachical cluster analysis (Ward's method) of all 120 extant specimens using eigenshape axes 1-4. Note distinct clustering of two groups with little error. Terminal nodes labeled with species/sex abbreviations.

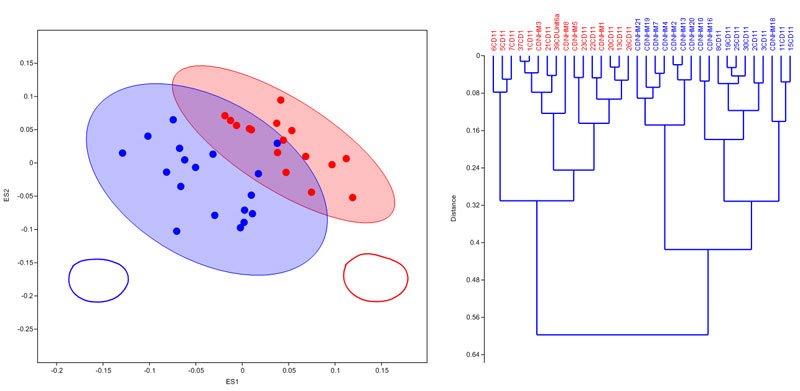
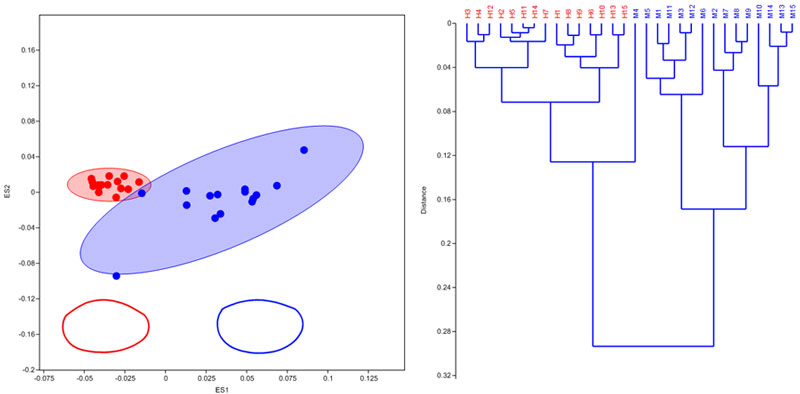
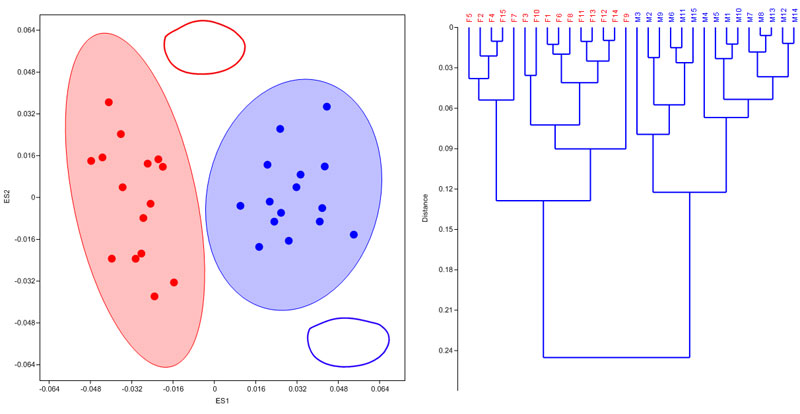
FIGURE 6. Plot of C. mexicanus on eigenshape axes 1 and 2 with dendrogram of hierarchical cluster analysis (Ward's method) using the first four eigenshapes. Mean shapes for males (blue) and females (red) shown separate and overlapping to highlight dimorphism.

FIGURE 7. Plot of L. occidentalis on eigenshape axes 1 and 2 with dendrogram of hierarchical cluster analysis (Ward's method) using the first four eigenshapes. Mean shapes for males (blue) and females (red) shown separate and overlapping to highlight dimorphism.

FIGURE 8. Plot of C. disgragaris on eigenshape axes 1 and 2. Mean shapes for morphotype 1 'male' (blue) and morphotype 2 'female' (red) highlight possible dimorphism with associated Hierarchical cluster analysis (Ward's method) using eigenshape axes 1-4. The designation of specimens to either two morphotypes is based on the distinct two-group clustering.

FIGURE 9. Plot of E. texana males and self-fertilizing hermaphrodites on eigenshape axes 1 and 2 with dendrogram of hierarchical cluster analysis (Ward's method) using the first four eigenshapes.

FIGURE 10. Plot of L. badia males and females on eigenshape axes 1 and 2 with dendrogram of hierarchical cluster analysis (Ward's method) using the first four eigenshapes.


